A Closer Look at May Fund Flows: Equity ETFs Defy ‘Sell in May’

Money Market funds reversed a two-month trend of outflows, reeling in $62.3B in May.
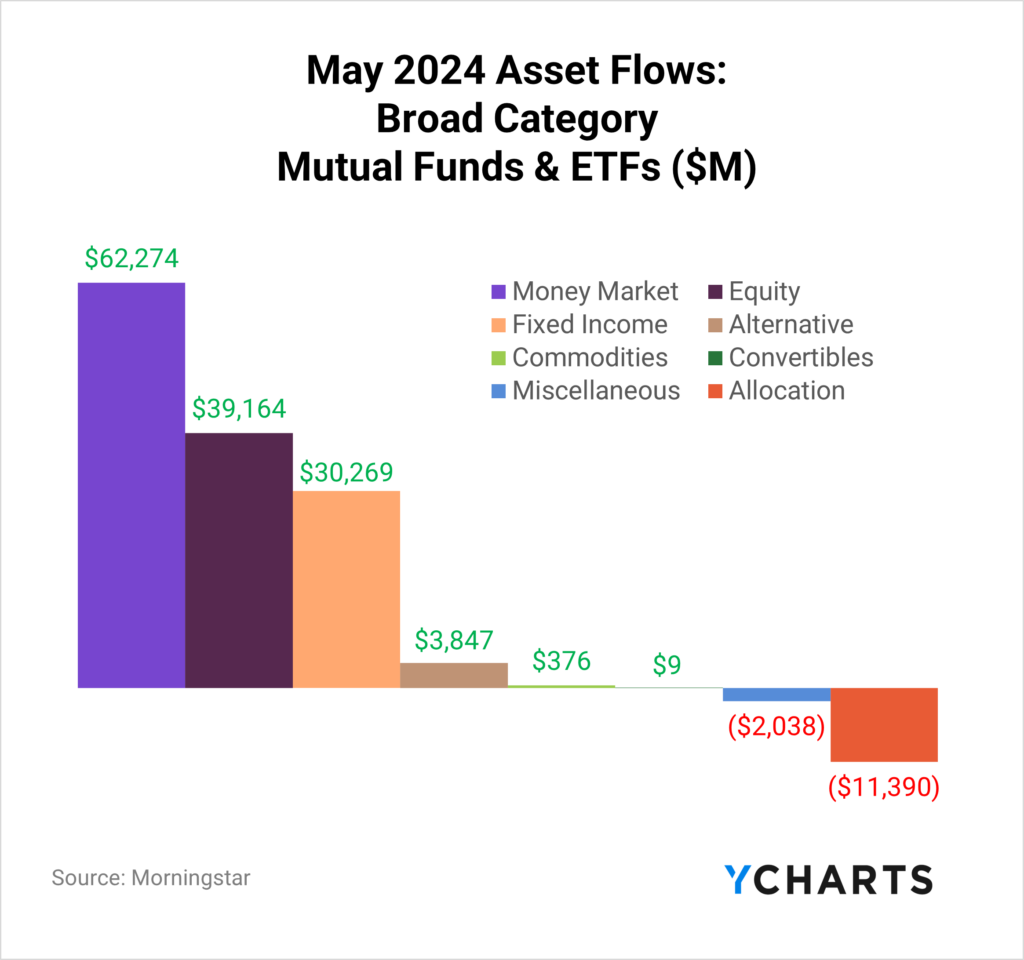
Contrary to the adage “sell in May and go away,” Equity funds rebounded from a net negative April, capturing $39.2B in net inflows, driven predominantly by a $58B influx into equity ETFs—a sign of sustained investor confidence in the stock markets. Similarly, Fixed Income funds continued to appeal to investors, securing $30.3B in inflows, including $24.4B into Fixed Income ETFs.
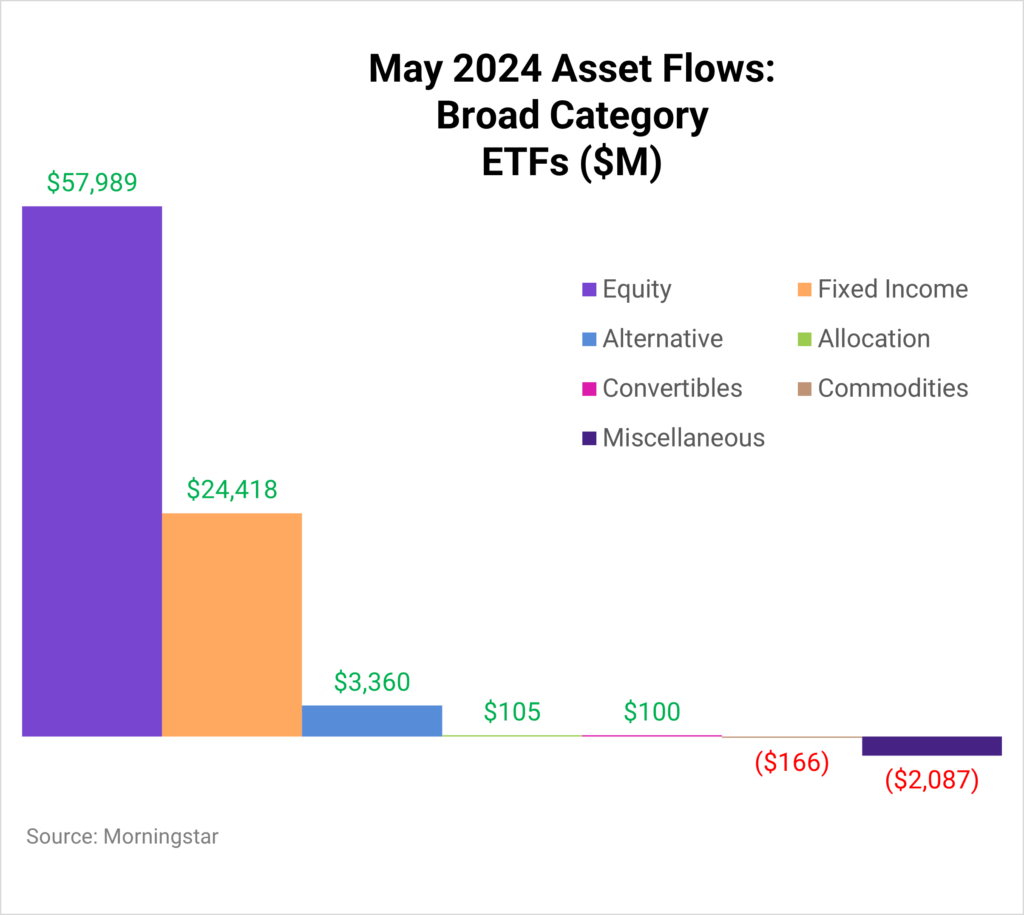
Clients, sign up to get the full Fund Flow Report sent directly to your inbox.
For a more nuanced look at monthly flows, sign up for a copy of our Fund Flows Report and Visual Deck (clients only):Active ETFs vs Passive ETFs
According to a 2023 survey by the Money Management Institute, 42% of asset managers currently support active ETFs, and an additional 33% plan to do so soon. Moreover, among those asset managers who already offer active ETFs, 75% plan to increase their support for this type of investment vehicle.
One reason behind this trend is the growing demand for active ETFs from wealth managers, with 89% already using these vehicles. Of those currently using active ETFs, 42% have expressed their intention to increase their focus on this investment option.
Of the $24.4B that went into Fixed Income ETFs in May, $7B (or 29%) came from active strategies. Furthermore, from May 2023 until May 2024, $55.7B went into active fixed income ETFs, representing 28% of those flows during that time despite only making 14% of fixed income ETF AUM.

Active equity ETFs accounted for 17.8% of all equity ETF inflows in May, 26% of flows in 2024, and 19% from May 2023 through May 2024, despite making up 5% of AUM.

Which Equity ETFs Are Advisors Choosing?
According to the latest findings from Brown Brothers Harriman’s 11th Annual Global ETF Investor Survey, 82% of advisors plan to increase their ETF allocations over the next 12 months, highlighting ETFs’ growing role in modern investment strategies.
Regarding portfolio construction, 33% of US-based advisors incorporate ETFs as core portfolio holdings due to their broad market access and cost efficiency, and 44% embed them into model portfolios, indicating their integral role in standardized investment strategies.
This is highlighted by the growth in funds like Vanguard S&P 500 ETF (VOO) and SPDR® Portfolio S&P 500® ETF (SPLG), which have brought in $40.6B and $8B so far in 2024, respectively. Based on equity assets gathered this year, these funds rank first and fourth across asset managers with over $1T in ETF AUM.
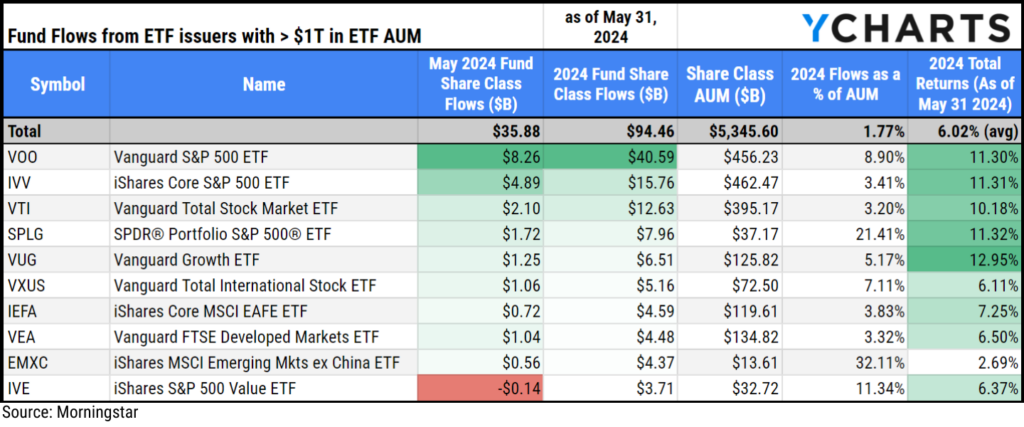
Download Visual | View as a Comp Table in YCharts
47% of US-based advisors use ETFs as satellite positions to enhance specific exposures or achieve tactical goals. Advisors have allocated over $22B combined to Invesco QQQ Trust (QQQ), Invesco NASDAQ 100 ETF (QQQM), and VanEck Semiconductor ETF (SMH) in 2024 to participate in emerging trends in technology like artificial intelligence.
While funds like Pacer US Cash Cows 100 ETF (COWZ), Invesco S&P 500® Equal Weight ETF (RSP), and Capital Group Dividend Value ETF (CGDV) have allowed investors to differentiate their equity allocations via weight or underlying holdings.
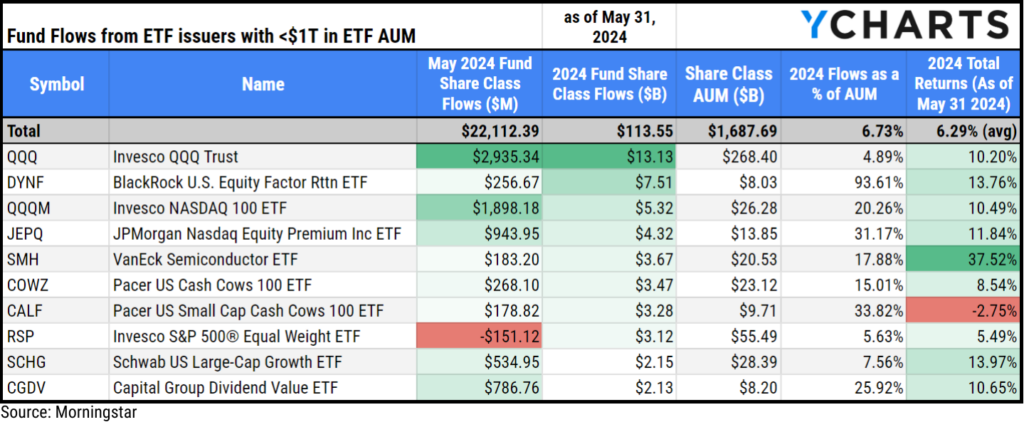
Download Visual | View as a Comp Table in YCharts
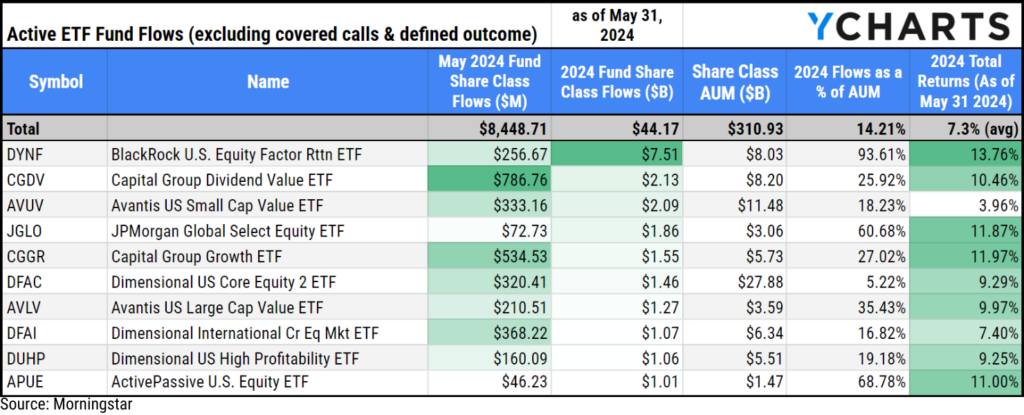
Active ETFs have been surging in popularity. BBH’s survey shows that 28% of US-based advisors are most interested in actively managed ETFs. 37% of advisors use active ETFs as core elements in their portfolios, while another 37% use the vehicles as satellites that provide the potential for income, risk mitigation, or alpha.
28% reported being most interested in defined outcome ETFs as a way to mitigate risk (their growth was highlighted in last month’s report). When looking at active ETFs that are designed to generate alpha (versus income or risk mitigation), BlackRock U.S. Equity Factor Rotation ETF (DYNF) Capital Group Dividend Value ETF (CGDV), and Avantis US Small Cap Value ETF (AVUV) have been some of the most popular active strategies this year, reeling in $7.5B, $2.1B, and $2.1B, respectively.
Download Visual | View as a Comp Table in YCharts
Biggest ETF Winners & Losers in May 2024
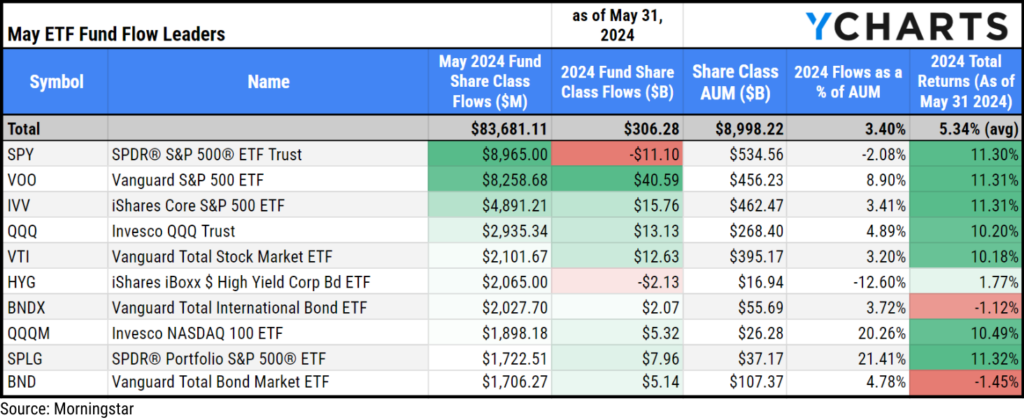
Across all asset classes and categories, the biggest winners in May 2024 were SPDR® S&P 500® ETF Trust (SPY), Vanguard S&P 500 ETF (VOO), iShares Core S&P 500 ETF (IVV), Invesco QQQ Trust (QQQ), and Vanguard Total Stock Market ETF (VTI).
Download Visual | View as a Comp Table in YCharts
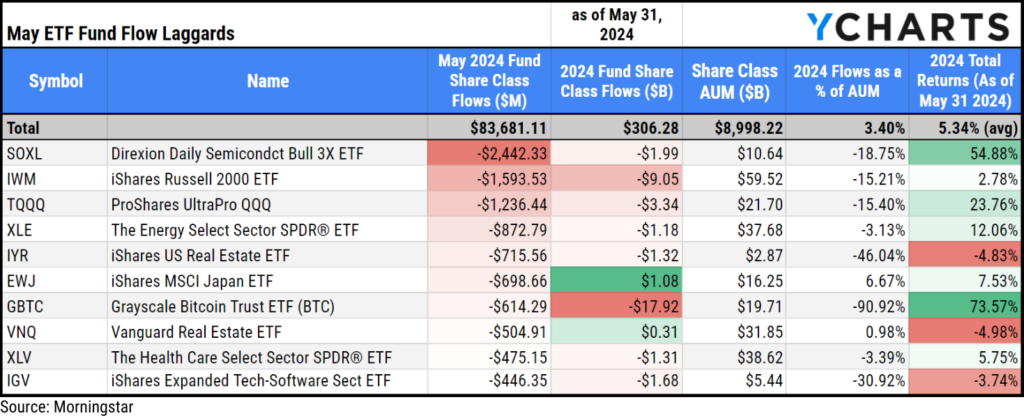
These funds lost the most assets in May:
Download Visual | View as a Comp Table in YCharts
Inflows and Outflows for Equity ETFs in May 2024
Asset flows in equity mutual funds and ETFs suggested that investors had a mixed appetite In May 2024. Only Large Blend experienced positive inflows within mutual funds, while all other style boxes faced outflows. Conversely, ETFs saw inflows in six of the nine style boxes. Despite the outflows in mutual funds, the robust inflows into ETFs led to a net-positive month for equity funds.
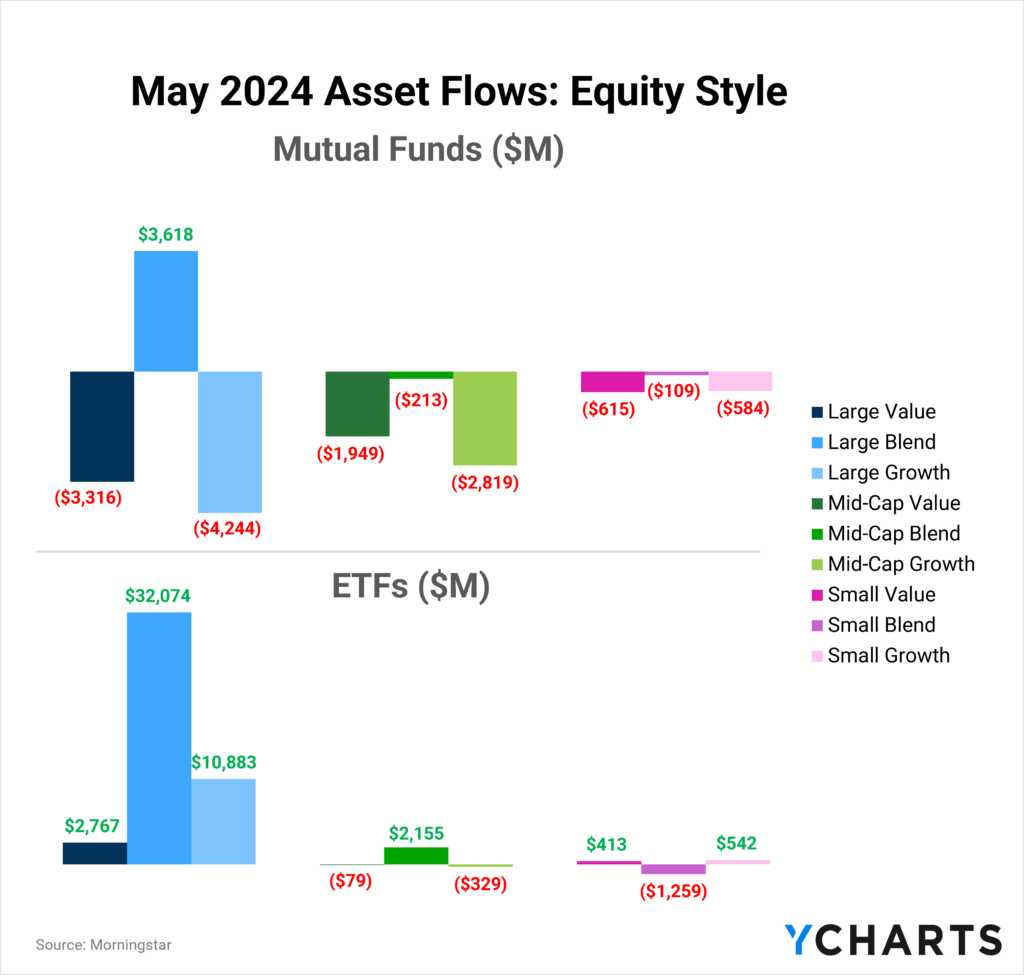
Here are some of May’s most popular and unpopular ETF categories and strategies:
Inflows in Large Blend ETFs
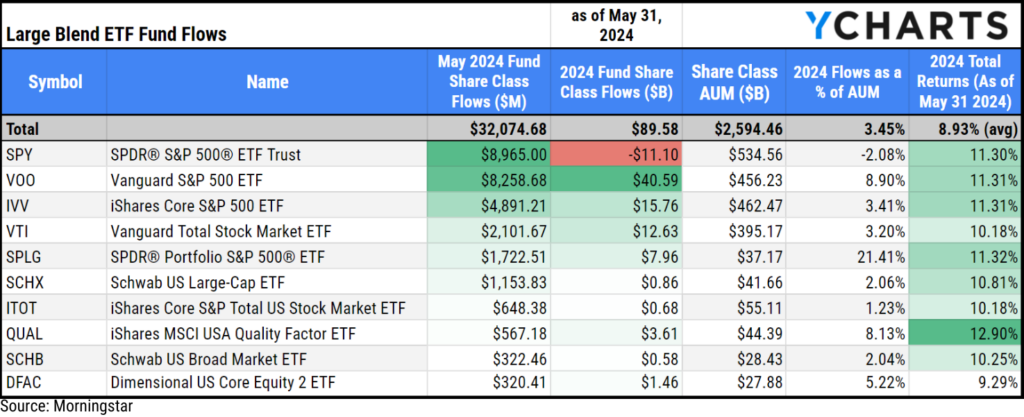
Large Blend ETFs brought in $32.1B in May and have attracted $89.6B in 2024, 3.5% of its $2.6T AUM.
The funds that attracted the most assets in May were SPDR® S&P 500® ETF Trust (SPY), Vanguard S&P 500 ETF (VOO), and iShares Core S&P 500 ETF (IVV) with $9B, $8.3B, and $4.9B in inflows, respectively.
Download Visual | Modify as a Comp Table in YCharts
Inflows in Large Growth ETFs
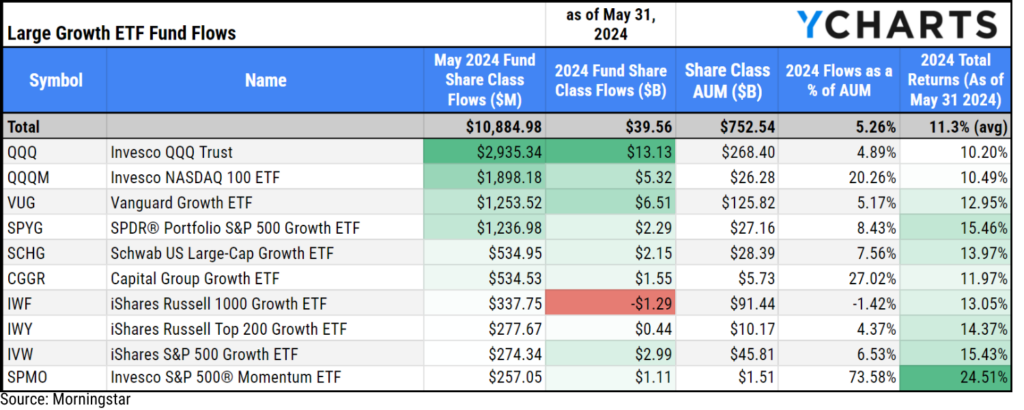
Large Growth ETFs brought in $10.9B in May. The category has attracted $39.6B in 2024 so far, which is 5.3% of its $752.5B AUM.
The fund that attracted the most assets in May was Invesco QQQ Trust (QQQ), bringing in $2.9B. It was followed by Invesco NASDAQ 100 ETF (QQQM), which attracted $1.9B, and Vanguard Growth ETF (VUG), which saw $1.3B in inflows.
Download Visual | Modify as a Comp Table in YCharts
Outflows in Leveraged Equity ETFs
Leveraged Equity ETFs, which are designed to magnify exposure in bullish or bearish directions for specific sectors, industries, or stocks, experienced $3B in outflows in May. As highlighted in our February report, these funds can often act as a barometer of market sentiment. For instance, the rise of the GraniteShares 2x Long NVDA Daily ETF (NVDL), which ballooned to $4B in AUM, is a testament to investor enthusiasm for NVIDIA (NVDA).
Despite NVDL’s success, the broader $85.4B Leveraged Equity category has faced $5.7B in outflows in 2024. Below is a table of the funds that saw the biggest outflows in the category in May.

Download Visual | Modify as a Comp Table in YCharts
May 2024 Inflows and Outflows for Fixed Income ETFs
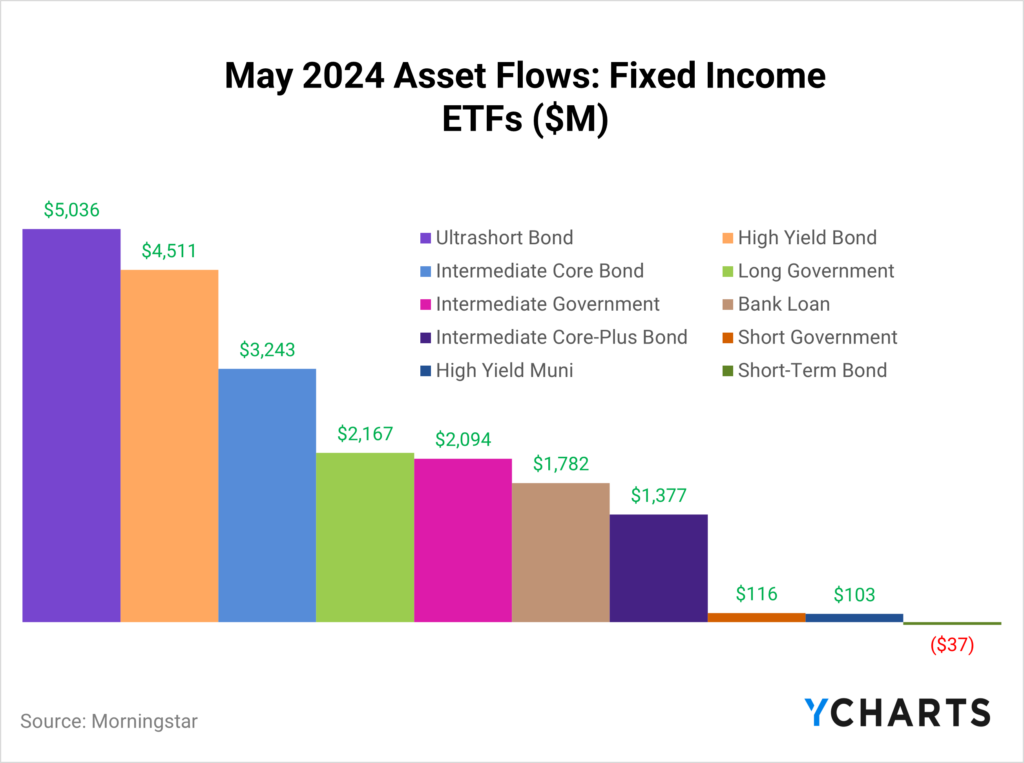
May was a pretty good month for Fixed Income ETFs, as all but one major category (short-term bond) positively contributed to the $24.4B that went into these ETFs.
Inflows in Ultrashort Bond ETFs
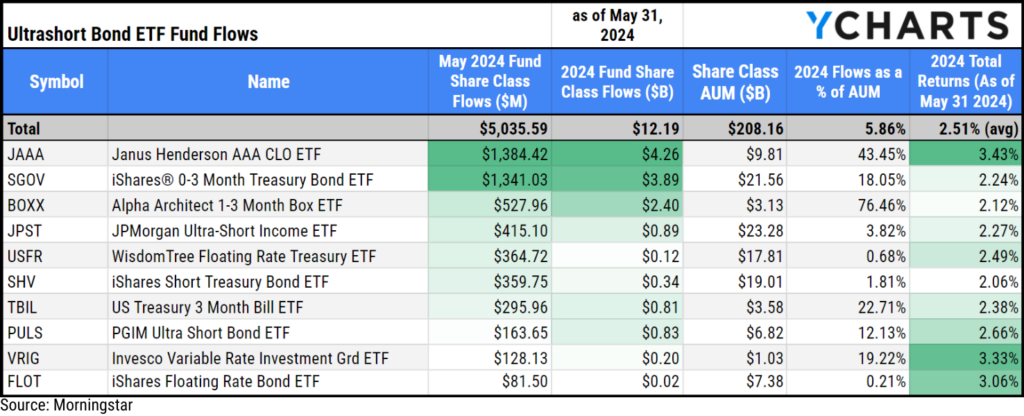
Ultrashort Bond ETFs brought in $5B in May. These strategies have attracted $12.2B in 2024, 5.9% of the category’s $208.2B AUM.
The most popular strategies in May were Janus Henderson AAA CLO ETF (JAAA), iShares® 0-3 Month Treasury Bond ETF (SGOV), and Alpha Architect 1-3 Month Box ETF (BOXX), which brought in $1.4B, $1.3B, and $528M, respectively.
Download Visual | Modify as a Comp Table in YCharts
Inflows in High Yield Bond ETFs
High Yield Bond ETFs brought in $4.5B in May, offsetting some of the category’s outflows at the beginning of the year. The category has attracted $2.9B in 2024, representing 3.8% of its $78.8B AUM.
The most popular strategies in May were iShares iBoxx $ High Yield Corp Bond ETF (HYG), iShares Broad USD High Yield Corporate Bond ETF (USHY), and SPDR® Portfolio High Yield Bond ETF (SPHY), which brought in $2.1B, $1.1B, and $537M, respectively.
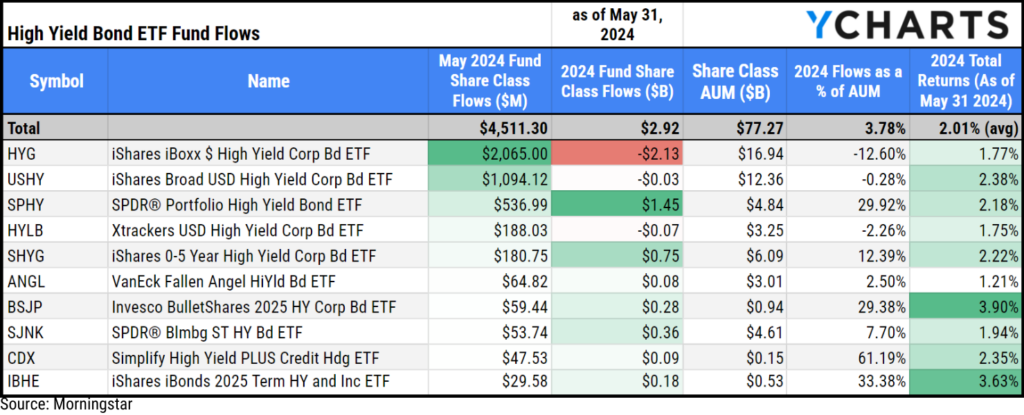
Download Visual | Modify as a Comp Table in YCharts
Outflows in Short-Term Bond ETFs
Short-Term Bond ETFs saw $37M leave the category in May. It’s been a slow year for the category, bringing in $313.9M, representing less than 1% of its $117.5B AUM. Below is a table of the funds that saw the biggest outflows in the category in May.

Download Visual | Modify as a Comp Table in YCharts
Data used in this article is sourced from Morningstar data.
Whenever you’re ready, there are three ways YCharts can help you:
Have questions about how YCharts can help you grow AUM and prepare for meetings?
Email us at hello@ycharts.com or call (866) 965-7552. You’ll get a response from one of our Chicago-based team members.
Unlock access to our Fund Flows Report and Visual Deck by becoming a client.
Dive into YCharts with a no-obligation 7-Day Free Trial now.
Sign up for a copy of our Fund Flows Report and Visual Deck (clients only):
Disclaimer
©2024 YCharts, Inc. All Rights Reserved. YCharts, Inc. (“YCharts”) is not registered with the U.S. Securities and Exchange Commission (or with the securities regulatory authority or body of any state or any other jurisdiction) as an investment adviser, broker-dealer or in any other capacity, and does not purport to provide investment advice or make investment recommendations. This report has been generated through application of the analytical tools and data provided through ycharts.com and is intended solely to assist you or your investment or other adviser(s) in conducting investment research. You should not construe this report as an offer to buy or sell, as a solicitation of an offer to buy or sell, or as a recommendation to buy, sell, hold or trade, any security or other financial instrument. For further information regarding your use of this report, please go to: ycharts.com/about/disclosure
Next Article
Mastering the Art of Financial Presentations with YChartsRead More →
