A Guide to the Shifting Landscape of REITs and Commercial Real Estate
In navigating the tumultuous landscape of the regional banking sector, investors and advisors face a growing challenge: the instability of commercial real estate, particularly office buildings.
With the demand for office space dwindling, the traditionally stable and attractive yields from office Real Estate Investment Trusts (REITs) are wobbling as well.
Office space occupancy is gradually making a comeback three years after COVID-19 first struck, but what is truly the current state of commercial real estate? Also, what are the potential implications for investors and advisors? This article explores all of that and more, including how YCharts can be used to find viable alternatives in this shifting landscape.
What’s Going on in Commercial Real Estate?
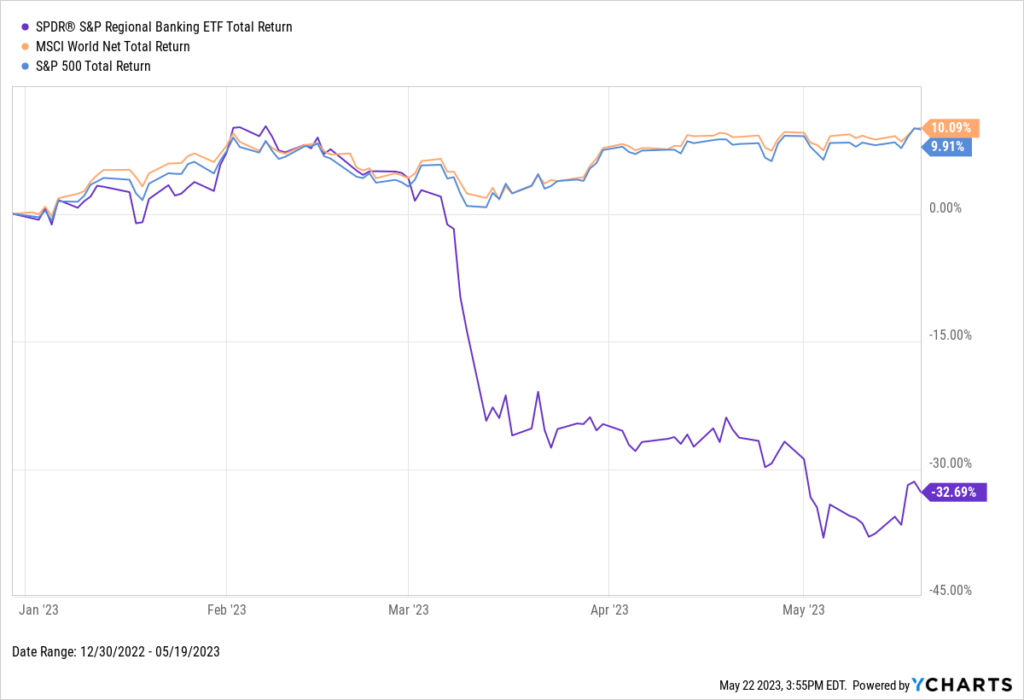
The regional banking sector has had a challenging year, illustrated below by the SPDR S&P Regional Banking ETF (KRE), which has seen a 32% year-to-date decline. A series of high-profile regional bank failures have contributed to this downturn. And most of these bank failures were attributed to poor diversification and duration risk management. Now, these banks face the potential threat of another wave of challenges.
According to a JP Morgan analysis in April 2023, commercial real estate makes up 28.7% of assets for small regional banks. And one segment of commercial real estate – office buildings – is currently experiencing a period of instability.
Download Visual | Modify in YCharts
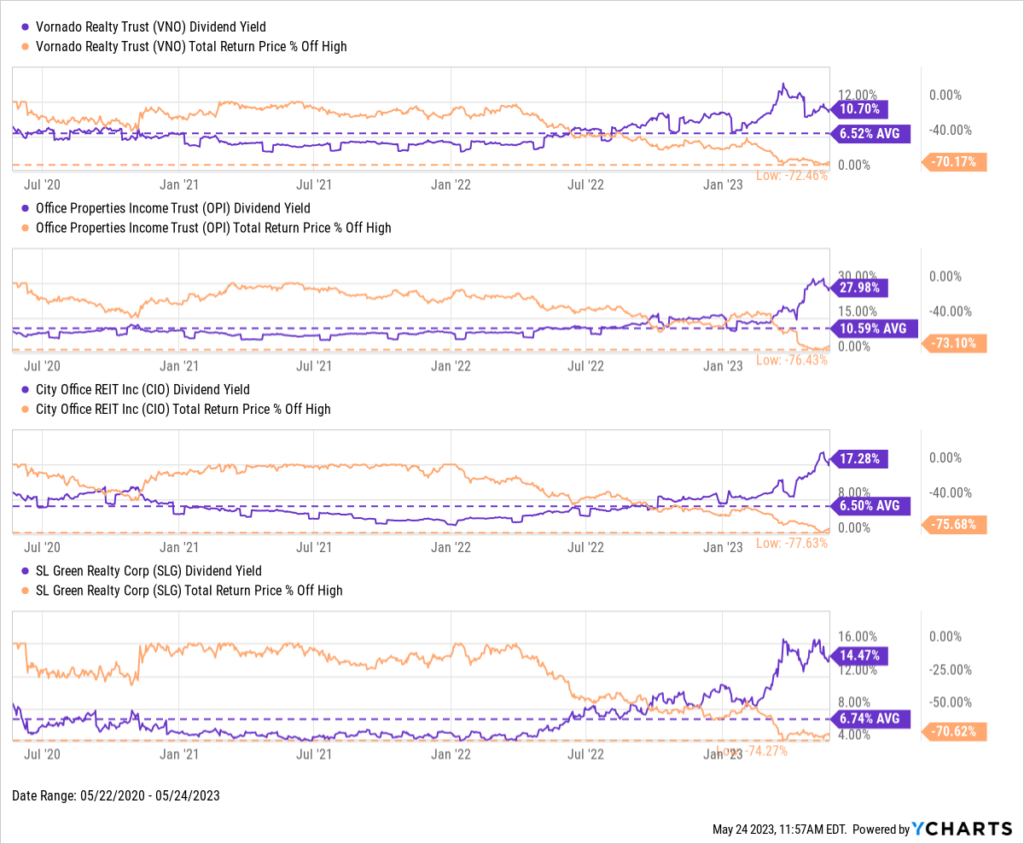
The post-pandemic initiative to return to offices has stagnated, leading to decreased demand for office space. This is a cause for concern for investors and advisors because of how attractive and consistent the yields from office REITs have been. While the dividend yields of several office REITs have grown significantly, accelerating drawdowns have put their stability in question. This instability is particularly worrisome for income-seeking clients who prioritize predictable fixed income.
Download Visual | Modify in YCharts
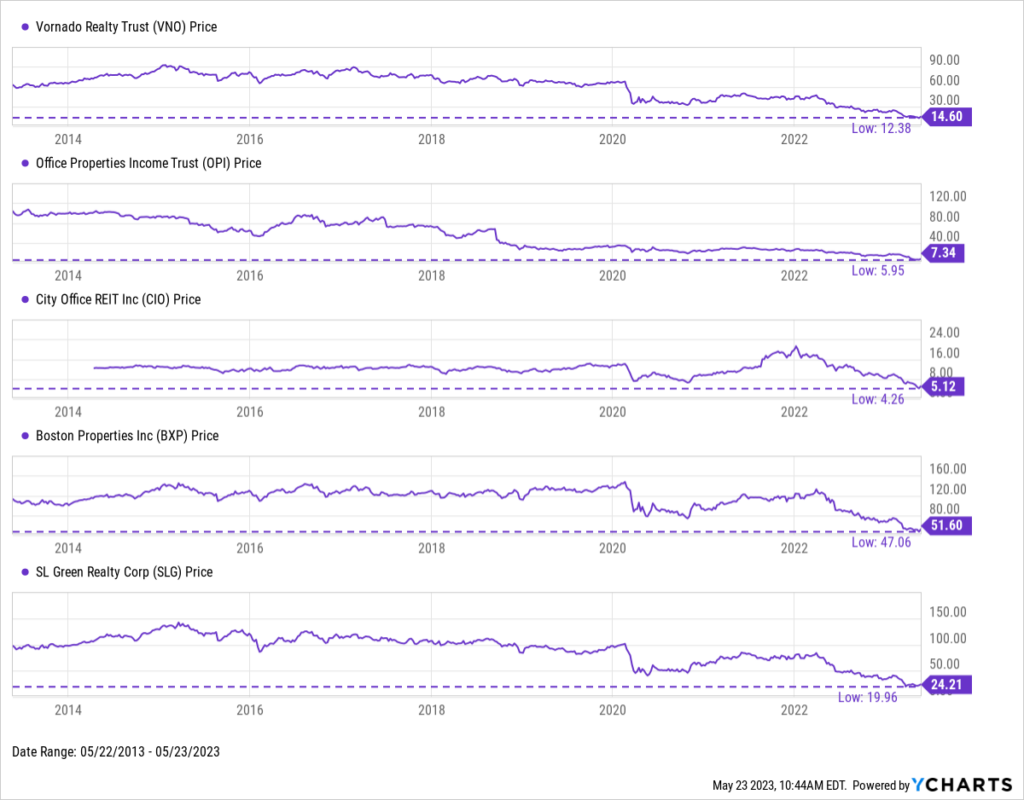
REIT dividend instability is partly due to office vacancy rates lingering around 12.5%, which is in line with vacancy rate peaks after the global financial crisis in 2010, coupled with the rising cost of borrowing due to interest rate hikes. Consequently, investments in office spaces and their subsequent income may appear less appealing. A stark example of a commercial real estate investment gone awry is a 22-story office building in San Francisco, which was purchased for $300 million in 2019 but is projected to sell for a mere $60 million this year. This depreciation trend is also evident in several office REITs, as the share prices of numerous companies are flirting with their 10-year lows.
Download Visual | Modify in YCharts
Supposing the yields from commercial real estate investments continue to deteriorate in quality, it raises a critical question about their place in the income component of a client’s portfolio, especially those who rely more heavily on that income stream.
How Can Advisors Find Alternatives to Commercial Real Estate?
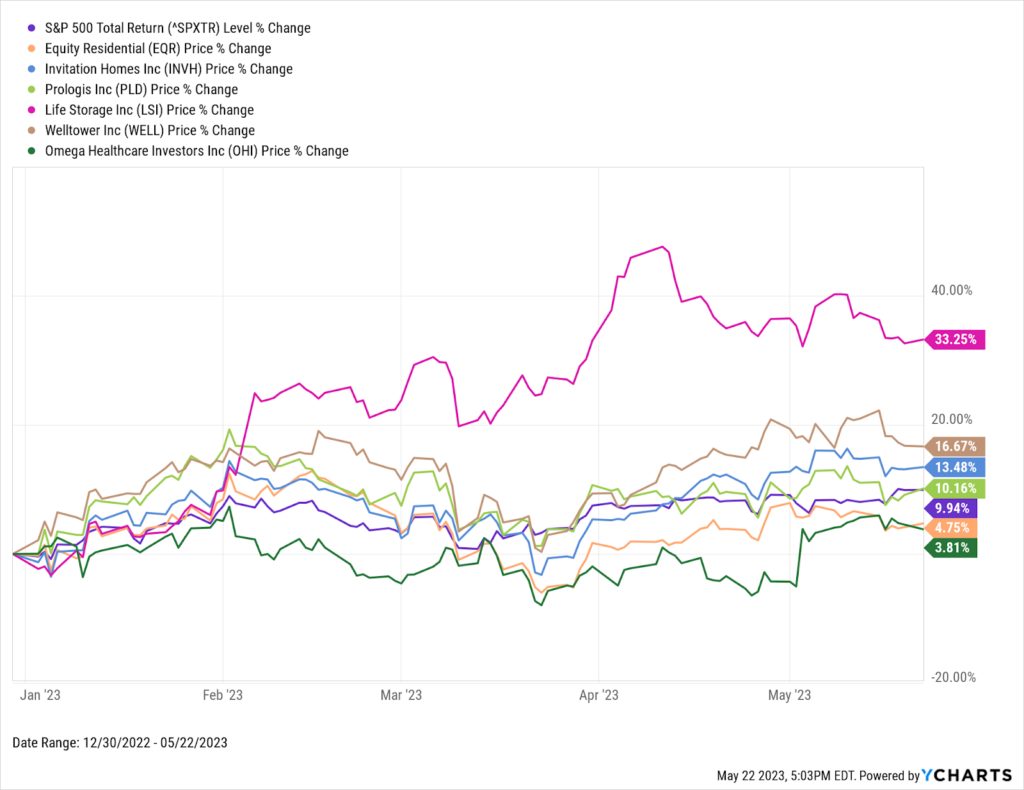
Despite the challenges faced by a particular segment of REITs, it’s important to note that not all REITs are underperforming. REITs focusing on residential, industrial, and healthcare real estate have posted solid YTD performances, perhaps warranting a closer examination of these industries for potential investment opportunities.
Download Visual | Modify in YCharts
Additionally, yields derived from traditional fixed income instruments have become increasingly attractive due to recent rate hikes. The Fed’s policy shift allows advisors to continue generating yield for their clients while maintaining a higher credit quality rating, thereby adding an extra layer of security to the income portion of a portfolio. Using YCharts’ Fund Screener can streamline the process of identifying and comparing these promising opportunities, enhancing efficiency and effectiveness in investment decision-making.
Showcase Your New Strategy in a Report
Leveraging YCharts’ Report Builder tool, advisors can effortlessly construct a multi-comparison report to illustrate the potential outcomes of varying exposures to income-focused securities. In this report, an advisor can demonstrate the hypothetical scenarios if a client’s holdings were shifted from office REITs to residential or warehouse REITs, or bonds.
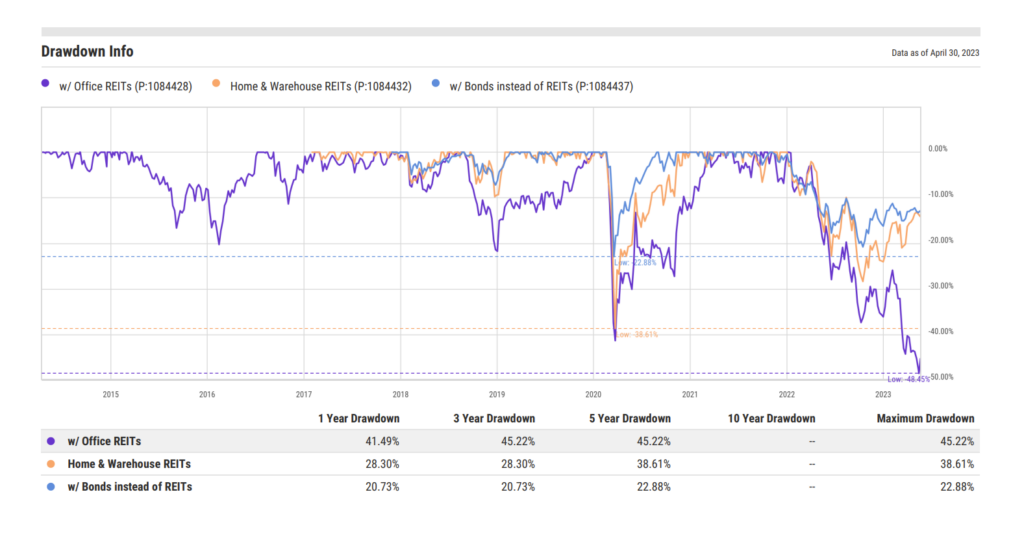
Build your Own Report in YCharts
As the commercial real estate sector, particularly office REITs, contends with uncertainty, it’s clear that strategic flexibility and diversification are key for advisors. By using tools like YCharts, advisors can find stable, income-focused alternatives and vividly project the impact of these strategies on client portfolios. In the current commercial real estate flux, advisors’ role in reassessing and guiding their clients towards sustainable investments becomes not just valuable, but essential.
Connect With YCharts
To get in touch, contact YCharts via email at hello@ycharts.com or by phone at (866) 965-7552
Interested in adding YCharts to your technology stack? Sign up for a 7-Day Free Trial.
Disclaimer
©2023 YCharts, Inc. All Rights Reserved. YCharts, Inc. (“YCharts”) is not registered with the U.S. Securities and Exchange Commission (or with the securities regulatory authority or body of any state or any other jurisdiction) as an investment adviser, broker-dealer or in any other capacity, and does not purport to provide investment advice or make investment recommendations. This report has been generated through application of the analytical tools and data provided through ycharts.com and is intended solely to assist you or your investment or other adviser(s) in conducting investment research. You should not construe this report as an offer to buy or sell, as a solicitation of an offer to buy or sell, or as a recommendation to buy, sell, hold or trade, any security or other financial instrument. For further information regarding your use of this report, please go to: ycharts.com/about/disclosure
Next Article
New on YCharts: ScenariosRead More →