A Look at the Top Charts of 2023
Our latest resource, The Top 23 Charts of 2023, packages 23 “charts of the year” into a useful slide deck. Read on for a sneak peek of the stories that defined the market and economy in 2023, and download your copy of the full slide deck.
(Bonus for YCharts clients: you can download custom copies of the visuals with your firm logo on them. Email us for more info or start a free trial to test it out!)
Get your copy of The Top 23 Charts of 2023 here:End of the Bear Market
The S&P 500, represented below by the SPDR® S&P 500 ETF Trust (SPY), drew down by as much as 25.4% in 2022. Not only did the index emerge out of bear market territory in 2023, but it just about fully erased that drawdown heading into 2024. The S&P 500 index rose 24.3% in 2023, ending the year half a percent away from its all-time high.
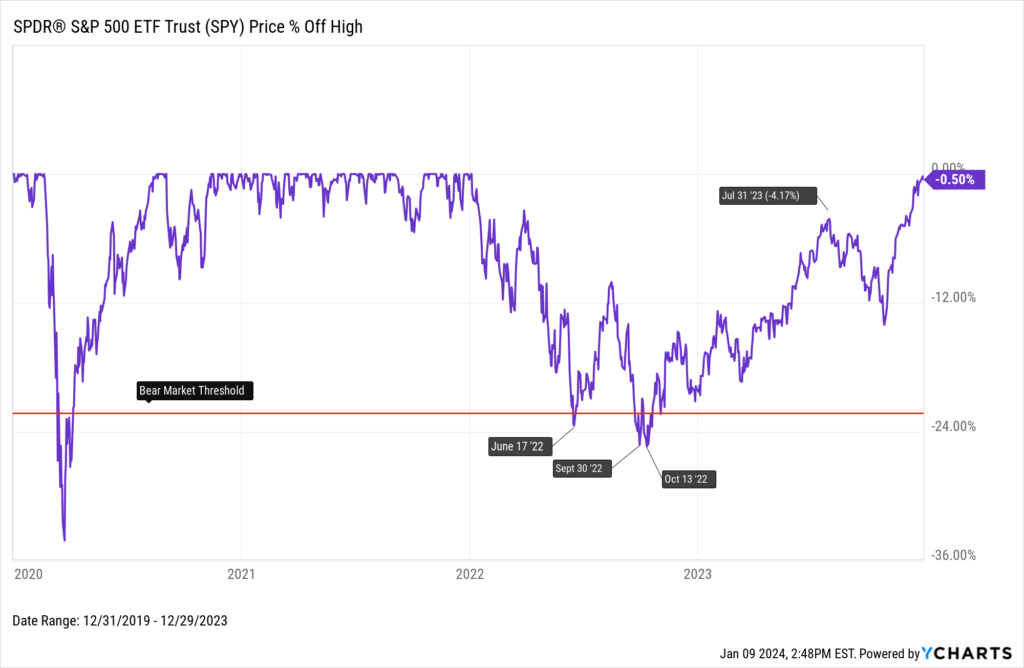
Download Visual | Modify in YCharts
Brian Portnoy discussed this chart further on our webinar from earlier this year: Brian Portnoy Decodes the Psychology of Client Wealth. You can watch the segment below:
At the same time, failing to stay invested proved to be costly. Missing out on just the five best market days in 2023 considerably diminished that 24.3% return by 11.55 percentage points. Missing the 15 best days turned an investment in the S&P 500 negative. And so on…
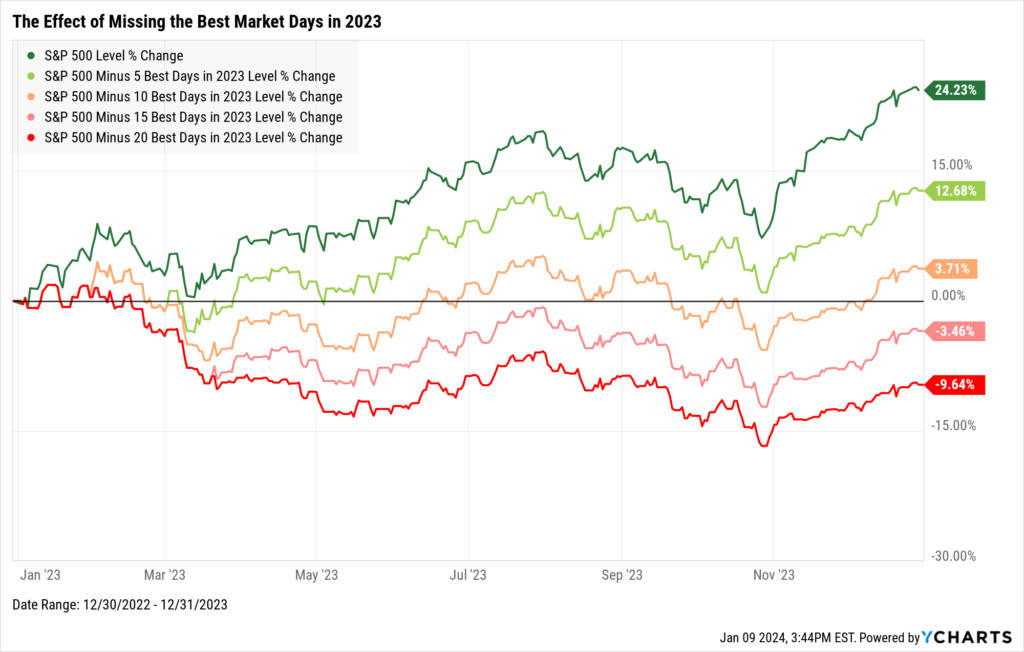
Download Visual | Contact Us to Access This Chart
Fed Rate Hikes
In response to rising inflation, the Federal Reserve hiked the Federal Funds Rate at an unprecedented pace. The Fed issued rate hikes in 11 of its last 15 FOMC meetings for a total of 525 basis points, including four consecutive 75bps hikes. On the other hand, the Fed has kept rates steady at 5.25-5.50% in its last three meetings. What will the Fed do in 2024?
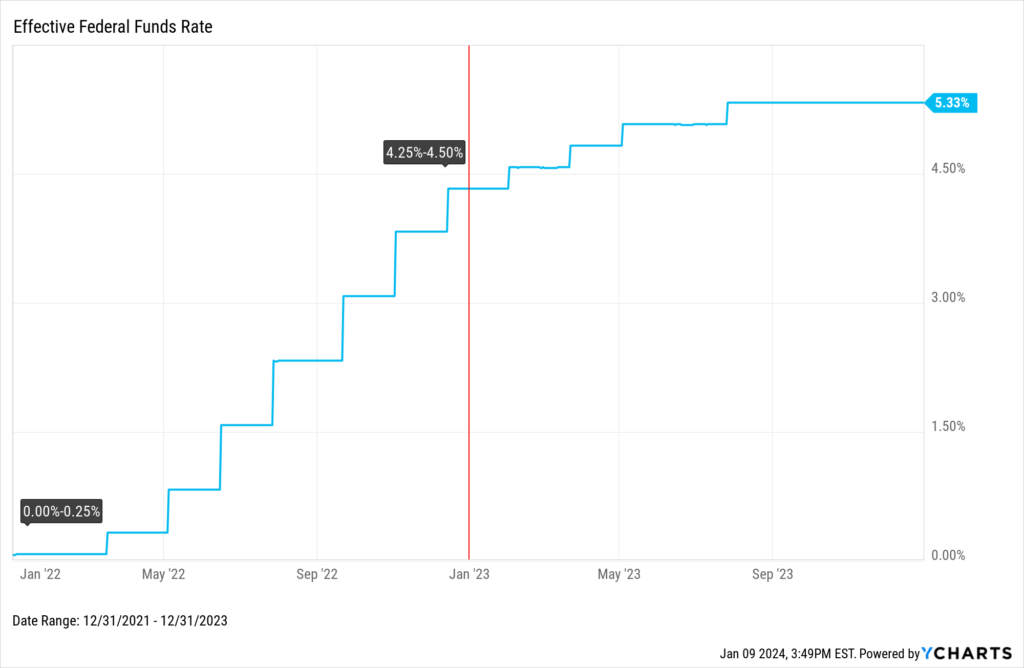
Download Visual | Modify in YCharts
Charlie Bilello discussed this chart further on our webinar from earlier this year: Inflation, Inversions, and a Recession? Charlie’s Tips for Navigating Today’s Markets. You can watch the segment below:
Whenever you’re ready, there are 3 ways YCharts can help you:
1. Interested in making your own reports and yearly recap materials with YCharts?
Send us an email at hello@ycharts.com or call (866) 965-7552. You’ll be directly in touch with one of our Chicago-based team members.
2. Want to test out YCharts for free?
Start a no-risk 7-Day Free Trial.
3. Download The Top 23 Charts of 2023 slide deck for more visuals to help your firm thrive:
Disclaimer
©2024 YCharts, Inc. All Rights Reserved. YCharts, Inc. (“YCharts”) is not registered with the U.S. Securities and Exchange Commission (or with the securities regulatory authority or body of any state or any other jurisdiction) as an investment adviser, broker-dealer, or in any other capacity, and does not purport to provide investment advice or make investment recommendations. This report has been generated through application of the analytical tools and data provided through ycharts.com and is intended solely to assist you or your investment or other adviser(s) in conducting investment research. You should not construe this report as an offer to buy or sell, as a solicitation of an offer to buy or sell, or as a recommendation to buy, sell, hold or trade, any security or other financial instrument. For further information regarding your use of this report, please go to: ycharts.com/about/disclosure
Next Article
Monthly Market Wrap: December 2023Read More →