Monthly Market Wrap: December 2023
Welcome back to the Monthly Market Wrap from YCharts, where we break down the most important trends for advisors and their clients in this monthly market review, including a recap of 2023.
Want to use these visuals in your own presentations? Download our free Monthly Market Wrap slide deck, containing all charts featured in the Market Wrap and more–including full-year recap charts!–in a shareable, presentation-ready format.
December 2023 Market Summary
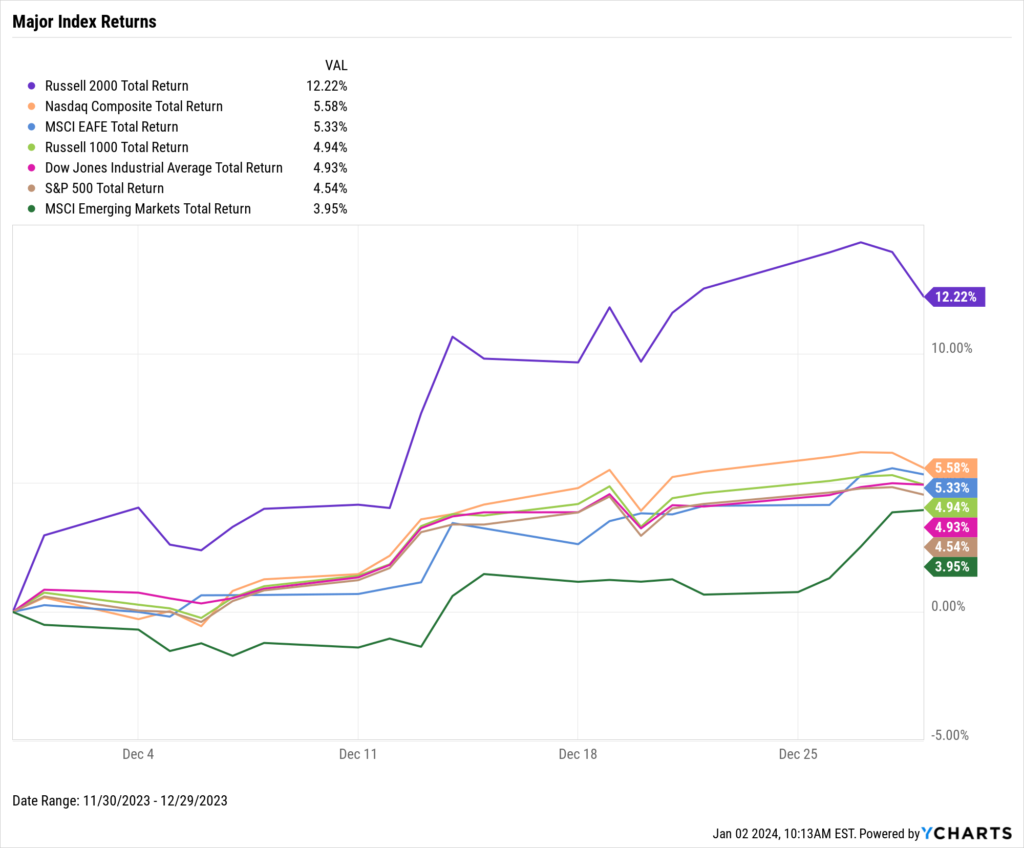
Stocks rallied into the end of the year. The Dow Jones Industrial Average rose 4.9%, the S&P 500 advanced 4.5%, and the NASDAQ jumped 5.6%. Small-caps had a particularly standout month, as the Russell 2000 surged 12.2% in December. For the year, the Dow logged a 16.2% gain, the S&P 500 added 26.3%, and the NASDAQ blazed higher by 44.6%.
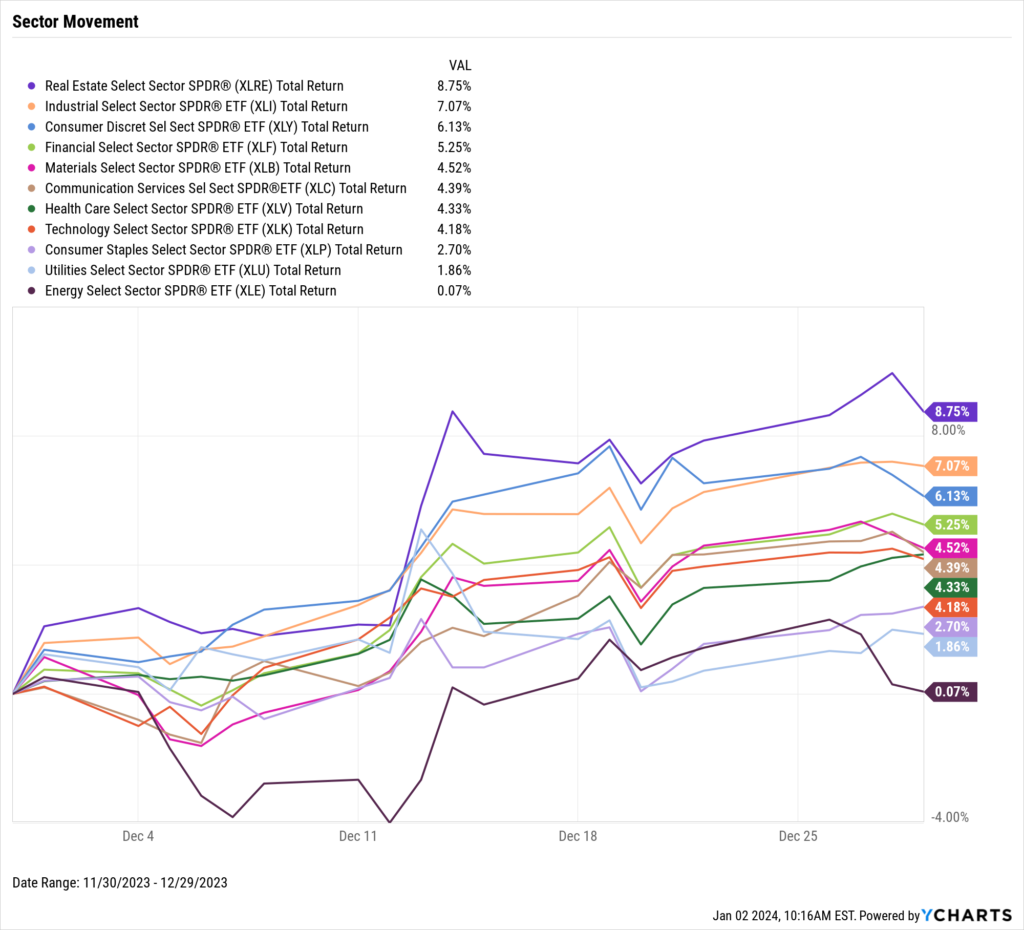
All eleven sectors posted a positive December. Real Estate led the way with an 8.8% increase, followed by a 7.1% advance in Industrials and 6.1% in Consumer Discretionary. Technology, Communication Services, and Consumer Discretionary were the best-performing sectors in 2023, while three sectors recorded a down year: Energy, Consumer Staples, and Utilities.
Mortgage rates retreated lower in December as the 15-year fell below 6% for the first time since May 2023, and the 30-year ended below 7% for the first time since mid-August. The average retail price of gas reached its lowest level of 2023 in December, which was $3.18 per gallon. Cryptocurrencies officially put a significant rebound year in the books; Bitcoin added 11.7% in December for a total gain of 153.7% in 2023, and Ethereum advanced 13.3% last month to wrap up the year with an increase of 90.95%.
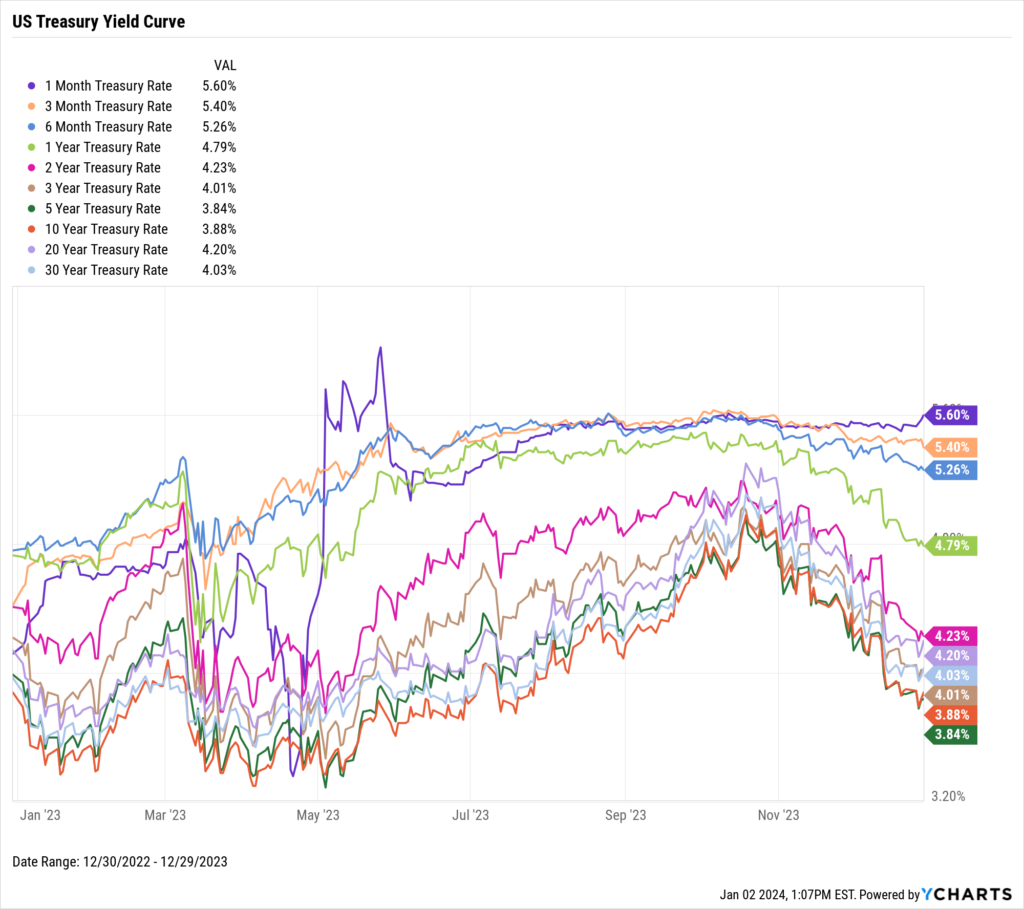
Treasury yields fell further in December as investors continued to pile into equities. Longer-term instruments saw larger declines, as yields on the 20-year and 30-year fell by 52 and 51 basis points, respectively. The 5-year and 10-year both tumbled below 4%. However, bond ETFs experienced price appreciation in December as a result of falling yields; the iShares 20+ Year Treasury Bond ETF (TLT) popped higher by 8.7%, and the iShares Core US Aggregate Bond ETF (AGG) rose 3.7%.
Jump to Fixed Income Performance
Want to create your own monthly recap, complete with these charts in a presentation deck that contains your firm’s branding? Start a Free Trial →
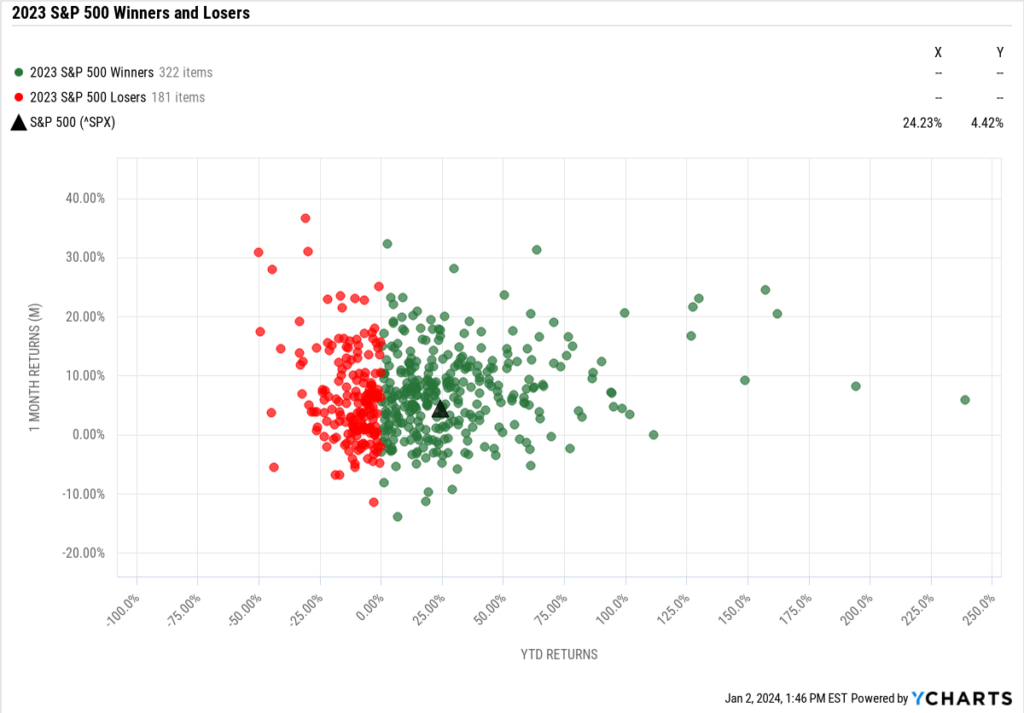
Off the YCharts! 2023 S&P 500 Winners & Losers
Out of the 503 S&P 500 constituents, 322 of them posted positive returns in 2023. In other words, about two-thirds of the S&P 500 (64%) had a good year.
Who were the best and worst performers in 2023? The best: NVIDIA (NVDA) took the crown with a whopping 238.9% increase. Meta Platforms (META) was a close second at 194.2%, followed by Royal Caribbean Group (RCL), which bounced back 162% in 2023 after slumping 63% between 2020-2022.
The worst performers in 2023: Enphase Energy (ENPH), FMC (FMC), and Dollar General (DG), which ended the year down 50.1%, 49.5%, and 44.8%, respectively.
Download Visual | Contact Us to Learn How to Make This Chart
Equity Performance
Major Indexes
Download Visual | Modify in YCharts | View Below Table in YCharts
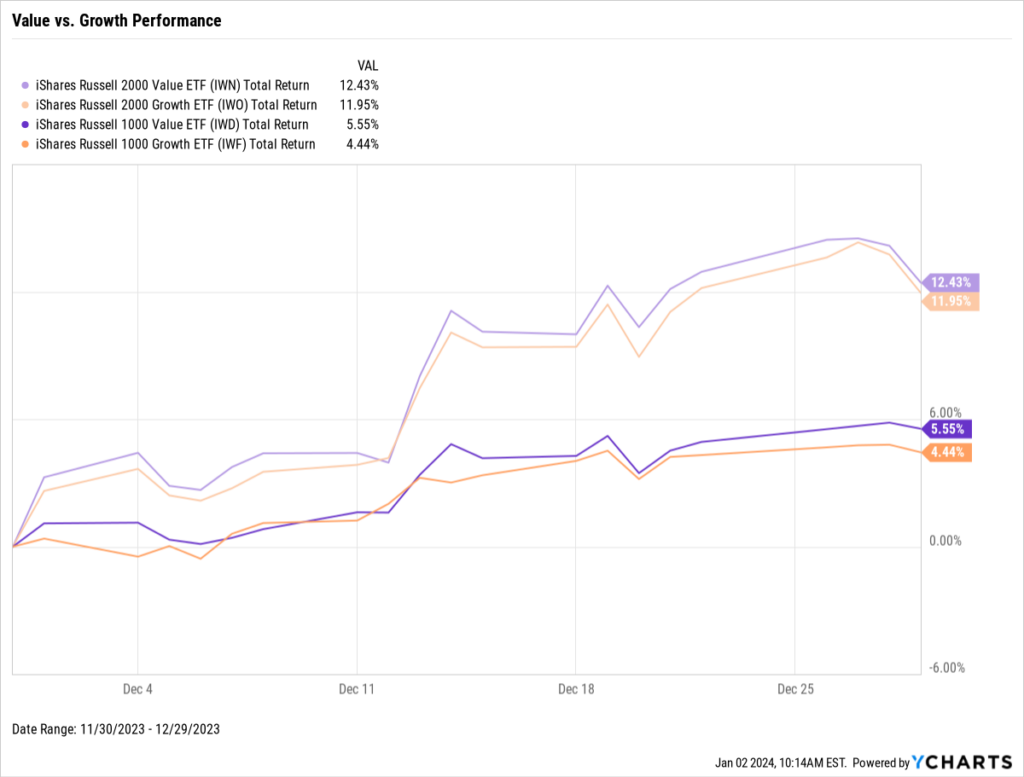
Value vs. Growth Performance
Download Visual | Modify in YCharts | View Below Table in YCharts
US Sector Movement
Download Visual | Modify in YCharts | View Below Table in YCharts
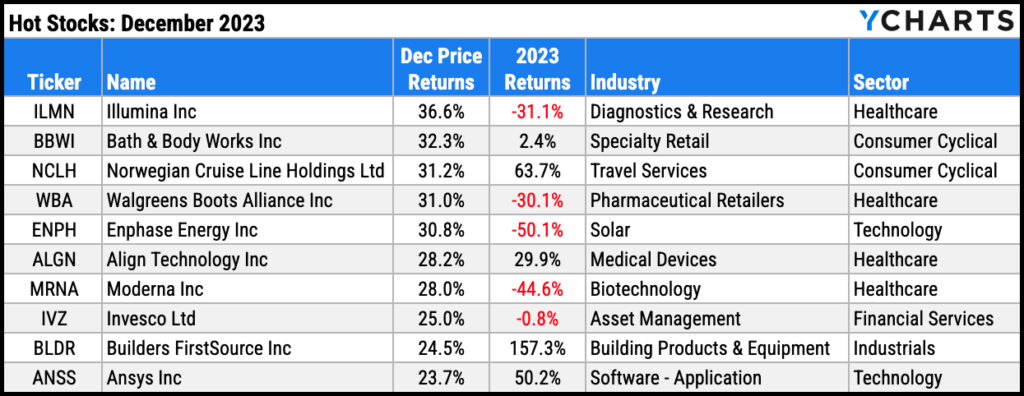
Hot Stocks: Top 10 S&P 500 Performers of December 2023
Download Visual | Modify in YCharts
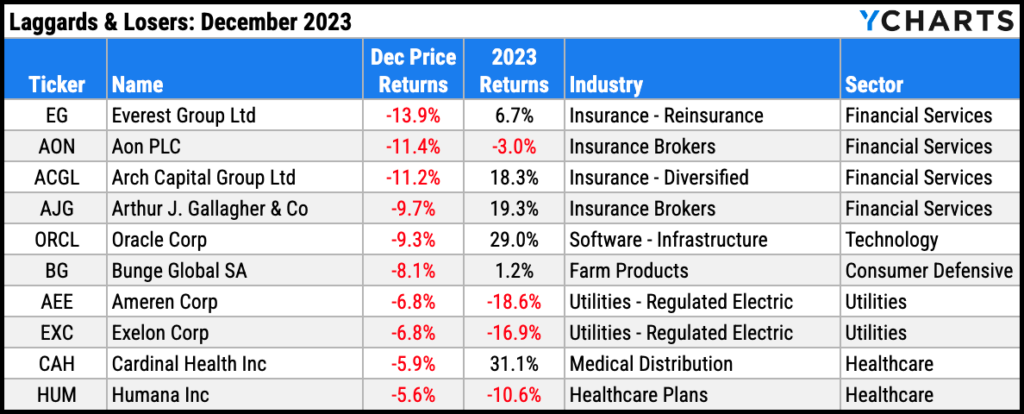
Laggards & Losers: 10 Worst S&P 500 Performers of December 2023
Download Visual | Modify in YCharts
Featured Market & Advisor News
Global ESG Fund Inflows Outpace Overall Market, Report Says (FA-Mag)
The 10 Best Performing Stocks in the Last 25 Years (YCharts)
Most Americans are not expecting improved finances in 2024 (InvestmentNews)
Michael Batnick & Ben Carlson’s Year-End Strategy Session Recap (YCharts)
Baby Boomers Over 70 Hold More Than 30% of Wealth in the US (WealthManagement.com)
NEW on YCharts: Portfolio Types & Advanced Features (YCharts)
Economic Data
Employment
November’s unemployment rate retreated two-tenths of a percentage point lower to 3.7%, as the labor force participation rate rose to 62.8%. 199,000 jobs were added in November according to nonfarm payroll data, slightly above the expected increase of 190,000.
Consumers and Inflation
The US inflation rate continued its YoY slide, falling to 3.14% in November which is the lowest print in 5 months. Core Inflation slowed to 4.01%, its lowest YoY level since September 2021. The monthly US Consumer Price Index inched 0.1% higher, and monthly US Personal Spending grew a quarter of a percent in the same month. The Federal Reserve held its key Fed Funds Rate at 5.50% at its December 13th, 2023 meeting, marking the Fed’s third consecutive meeting in which rates were left unchanged.
Production and Sales
The US ISM Manufacturing PMI remained unchanged at 46.7 in November and in contraction territory for the 13th consecutive month. November US Retail and Food Services Sales rose 0.28% MoM after contracting for the first month in the last eight, while the YoY US Producer Price Index fell for the second straight month to 0.86%.
Housing
US New Single-Family Home Sales plummeted 12.2% MoM in November while US Existing Home Sales inched 0.8% higher MoM. However, the Median Sales Price of Existing Homes fell for the fifth straight month to $387,600 in November. The median price of existing homes is 6.33% below its all-time high. Mortgage rates continued their cooldown into December; the 15-year Mortgage Rate ended the year at 5.93%, below 6% for the first time since May. The 30-year closed out 2023 at 6.61%, falling below 7% for the first time since mid-August.
Commodities
The price of Gold ended the year at $2,062.28 per ounce, representing a monthly increase of 1.32%. Crude oil prices were largely unchanged MoM despite having encountered some price volatility within December. As of Christmas Day, the price of WTI per barrel was $75.84 while Brent was $80.23. December brought drivers the lowest average price of gas in 2023, which was $3.18 per gallon on December 18th. The last time the average price of gas was that low was June of 2021.
Cryptocurrencies
Though we have officially entered the winter season, 2023 was far from a “crypto winter”. The price of Bitcoin jumped 153.7% in 2023–adding 11.7% in December alone–to finish the year at $42,220.61 per coin. Ethereum surged 90.95% in 2023–with a gain of 13.3% in December–to close out at a price of $2,294.34 per ether. However, Bitcoin is still 37.6% below its all-time high set in November 2021 while Ethereum is 52.3% off of its all-time high.
Fixed Income
US Treasury Yield Curve
1 Month Treasury Rate: 5.60%
3 Month Treasury Rate: 5.40%
6 Month Treasury Rate: 5.26%
1 Year Treasury Rate: 4.79%
2 Year Treasury Rate: 4.23%
3 Year Treasury Rate: 4.01%
5 Year Treasury Rate: 3.84%
10 Year Treasury Rate: 3.88%
20 Year Treasury Rate: 4.20%
30 Year Treasury Rate: 4.03%
Download Visual | Modify in YCharts
Bond Fund Performance
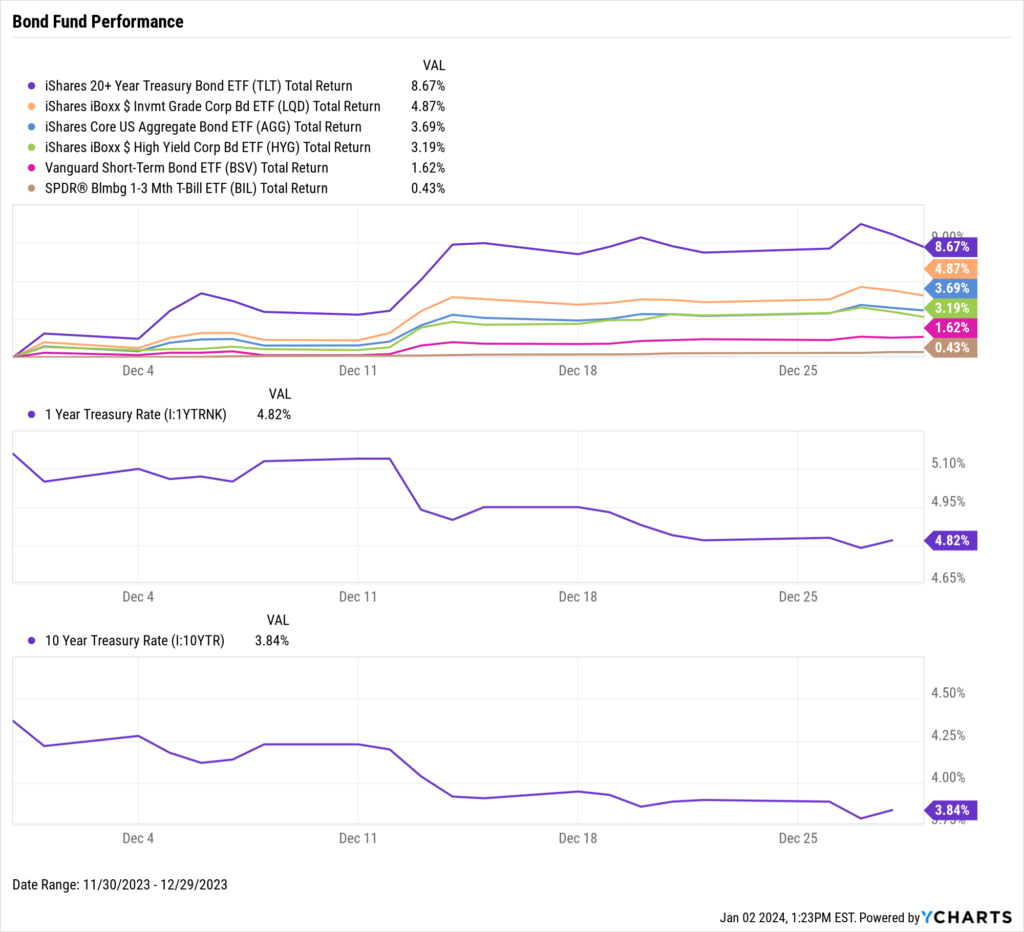
Download Visual | Modify in YCharts | View Below Table in YCharts
Have a great January and 2024! 📈
Whenever you’re ready, there are 3 ways YCharts can help you:
1. Looking for a communication tool to show the impact of monthly market events?
Send us an email at hello@ycharts.com or call (866) 965-7552. You’ll be directly in touch with one of our Chicago-based team members.
2. Want to test out YCharts for free?
Start a no-risk 7-Day Free Trial.
3. Download a copy of the Monthly Market Wrap slide deck:
Disclaimer
©2024 YCharts, Inc. All Rights Reserved. YCharts, Inc. (“YCharts”) is not registered with the U.S. Securities and Exchange Commission (or with the securities regulatory authority or body of any state or any other jurisdiction) as an investment adviser, broker-dealer or in any other capacity, and does not purport to provide investment advice or make investment recommendations. This report has been generated through application of the analytical tools and data provided through ycharts.com and is intended solely to assist you or your investment or other adviser(s) in conducting investment research. You should not construe this report as an offer to buy or sell, as a solicitation of an offer to buy or sell, or as a recommendation to buy, sell, hold or trade, any security or other financial instrument. For further information regarding your use of this report, please go to: ycharts.com/about/disclosure
Next Article
NEW on YCharts: Portfolio Types & Advanced FeaturesRead More →