Ad-Tech Sector Check In…Is Recovery Underway?
FEATURING THE FOUNDER OF THE I/O FUND, BETH KINDIG
The ad-tech sector’s performance is closely linked with the macroeconomy. This sector has been hit hard in the last few months due to global uncertainty. We believe this sector will recover when the economy starts picking up. It is practically impossible to time the market. However, we believe that being prudent and buying stocks during the downturn helps to outperform the market in the long term.
Below we review the stocks in the sector to find out which companies have performed well in the recent quarter results and which companies stand out in revenue growth, profits, cash flows, and earnings surprise.

Top Ad-Tech Stocks With the Highest Revenue Growth Rates in Q2
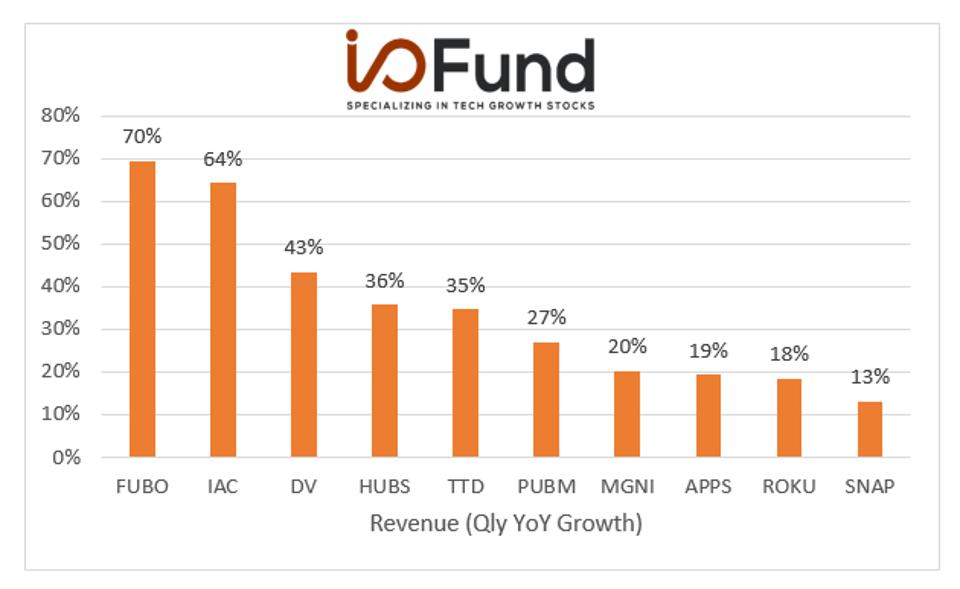
FuboTV led the ad-tech sector with the highest revenue growth rate in the recent Q2 results. The company’s revenue grew by 70% YoY to $221.9 million. North American revenue grew by 65% YoY to $216.2 million. For the next quarter, it expects North American revenue from $200 million to $205 million, representing a YoY growth of 29% at the mid-point of the guidance.
The company also announced that it would place Fubo Gaming under strategic review due to the changing macro environment. David Gandler, co-founder and CEO of the company, said, “We recognized that the market has changed and therefore, we have made the decision to place fubo Gaming, our online sports wagering business under strategic review. We will no longer pursue this opportunity on our own and are exploring the best path forward to scale the business. We look forward to continuing to update you as conversations progress.” The market reaction was positive following the strong results and the announcement on gaming.
The company’s first investor day on August 16th drew interest as the stock closed the day with 45% gains. The company’s CFO, John Janedis, said, “We continue to work towards long-term targets of adjusted EBITDA profitability and positive cash flow in 2025, and the Fubo flywheel will help us track towards that goal, as we execute a plan of controlled growth, alongside margin expansion.”
Quarterly Revenue Surprise
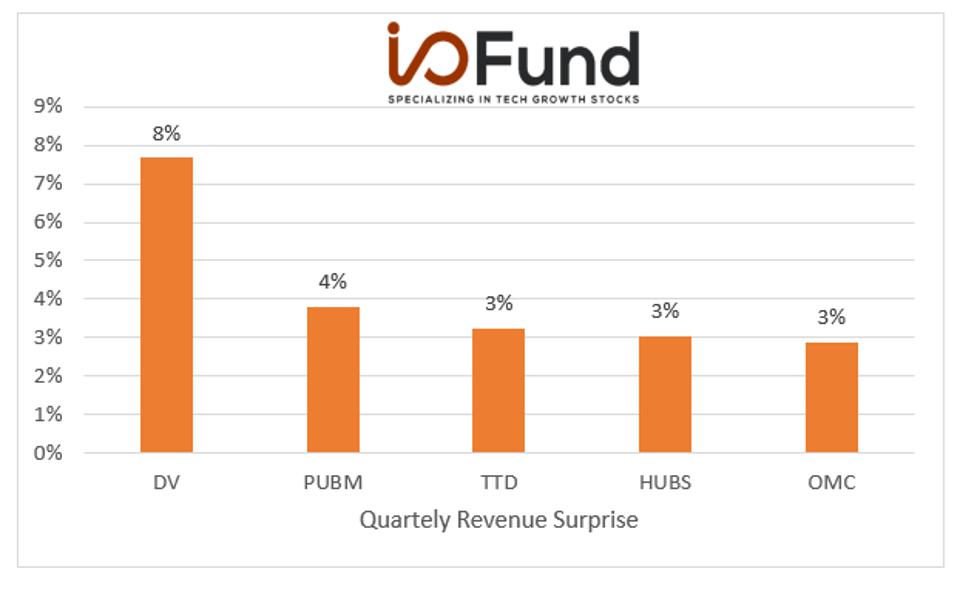
DoubleVerify has crushed the analysts’ revenue estimates by 8% in the Q2 results and leads the ad-tech sector. It was followed by PubMatic, which beat analysts’ revenue estimates by 4%. PubMatic’s Q2 revenue grew by 27% YoY to $63 million, and the company reported an adjusted EPS of $0.23, which beat the analysts’ estimates by $0.08. The company’s CFO, Steve Pantelick, said, “We saw broad strength in the Americas region, led by fast-growing ad formats CTV, online video and mobile, and continued momentum in Supply Path Optimization.” The company also benefitted from the diversified portfolio of advertisers from over 20 different verticals.
Top Ad-Tech Stocks With the Highest Revenue Growth Estimate for Q3
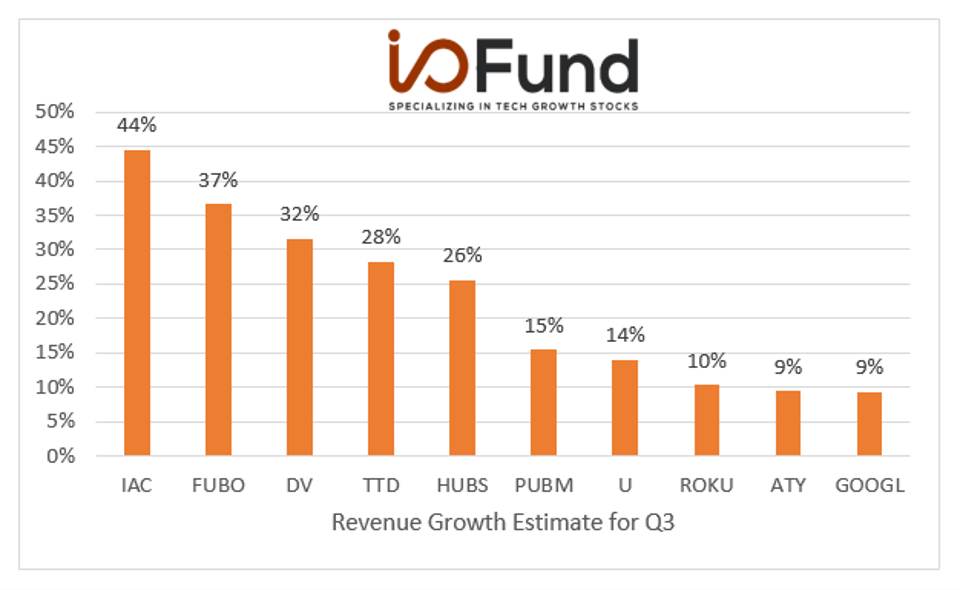
Ad-Tech stocks are expected to show strong growth rates in Q3. IAC leads the sector, with the analysts’ expecting its revenue to grow 44%, followed by FuboTV at 37%, and DoubleVerify at 32%. Advertisement measurement and analytics company DoubleVerify shares were listed in April 2021. The company’s revenue in Q2 grew by 43% YoY to $109.8 million. The company’s CEO, Mark Zagorski, said, “We delivered an outstanding second quarter and surpassed our expectations for growth and profitability fueled by record Activation revenue and continued momentum on Social and CTV platforms,” The company also raised the full-year revenue guidance from a 33% YoY growth to 35% YoY growth of $449 million at the mid-point of the guidance.
Top Ad-Tech Stocks With the Highest Revenue Growth Estimate for Q4
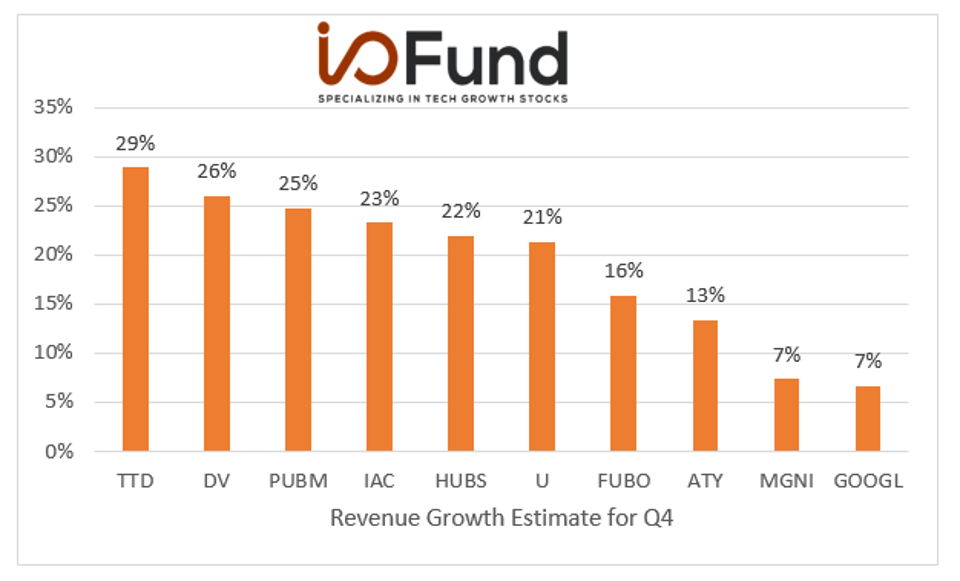
The Trade Desk leads the sector with the strongest expected revenue growth rates for Q4. The company’s revenue in the recent quarter grew by 35% YoY to $377 million and beat analysts’ revenue estimates by 3%. Truist analyst Youssef Squali, said in a note to the clients. “Strength in [connected TV] and record new client relationships drove this performance, which is likely sustainable in [second-half 2022] given 100% Solimar adoption, continued momentum in CTV, in shopper [marketing] and in international, with the additional kicker of political spend around the midterms.”
Top Ad-Tech Stocks With the Highest Revenue Growth Estimate for the Current Fiscal Year
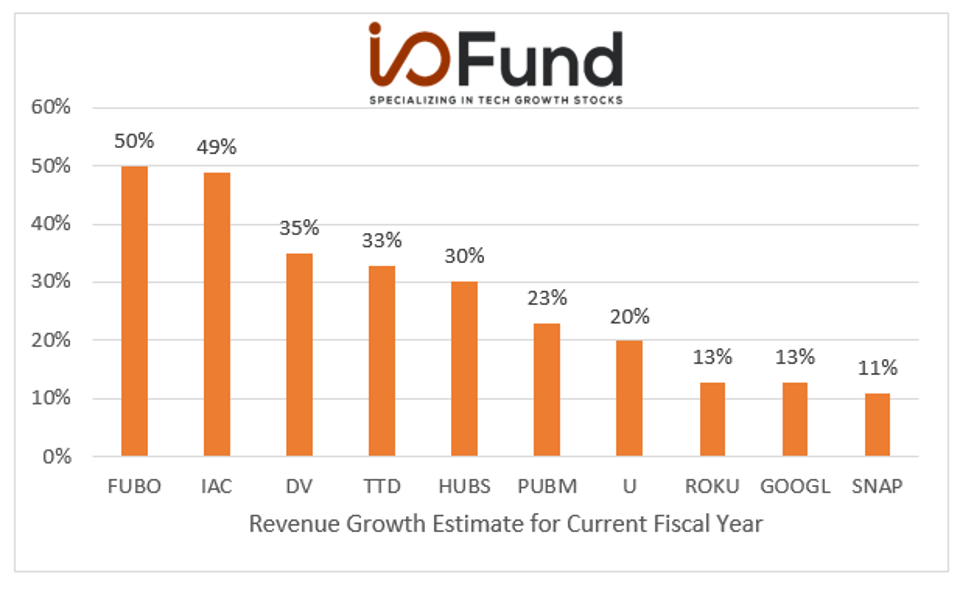
For the current fiscal year, analysts expect FuboTV to have the highest revenue growth estimate among ad-tech stocks. It is followed by IAC, which analysts expect to grow by 49%, and DoubleVerify is expected to grow by 35%.
Ad-Tech Stocks Based on Forward P/S Ratio
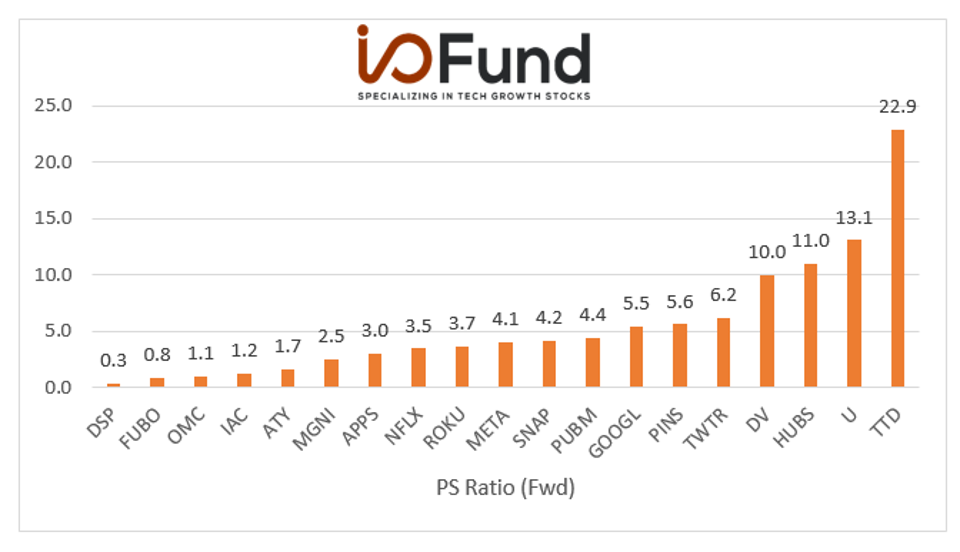
Ad-tech stocks are trading at a very low valuation. We can see from the above chart that the majority of the ad-tech stocks are trading at a forward P/S ratio of below 5.
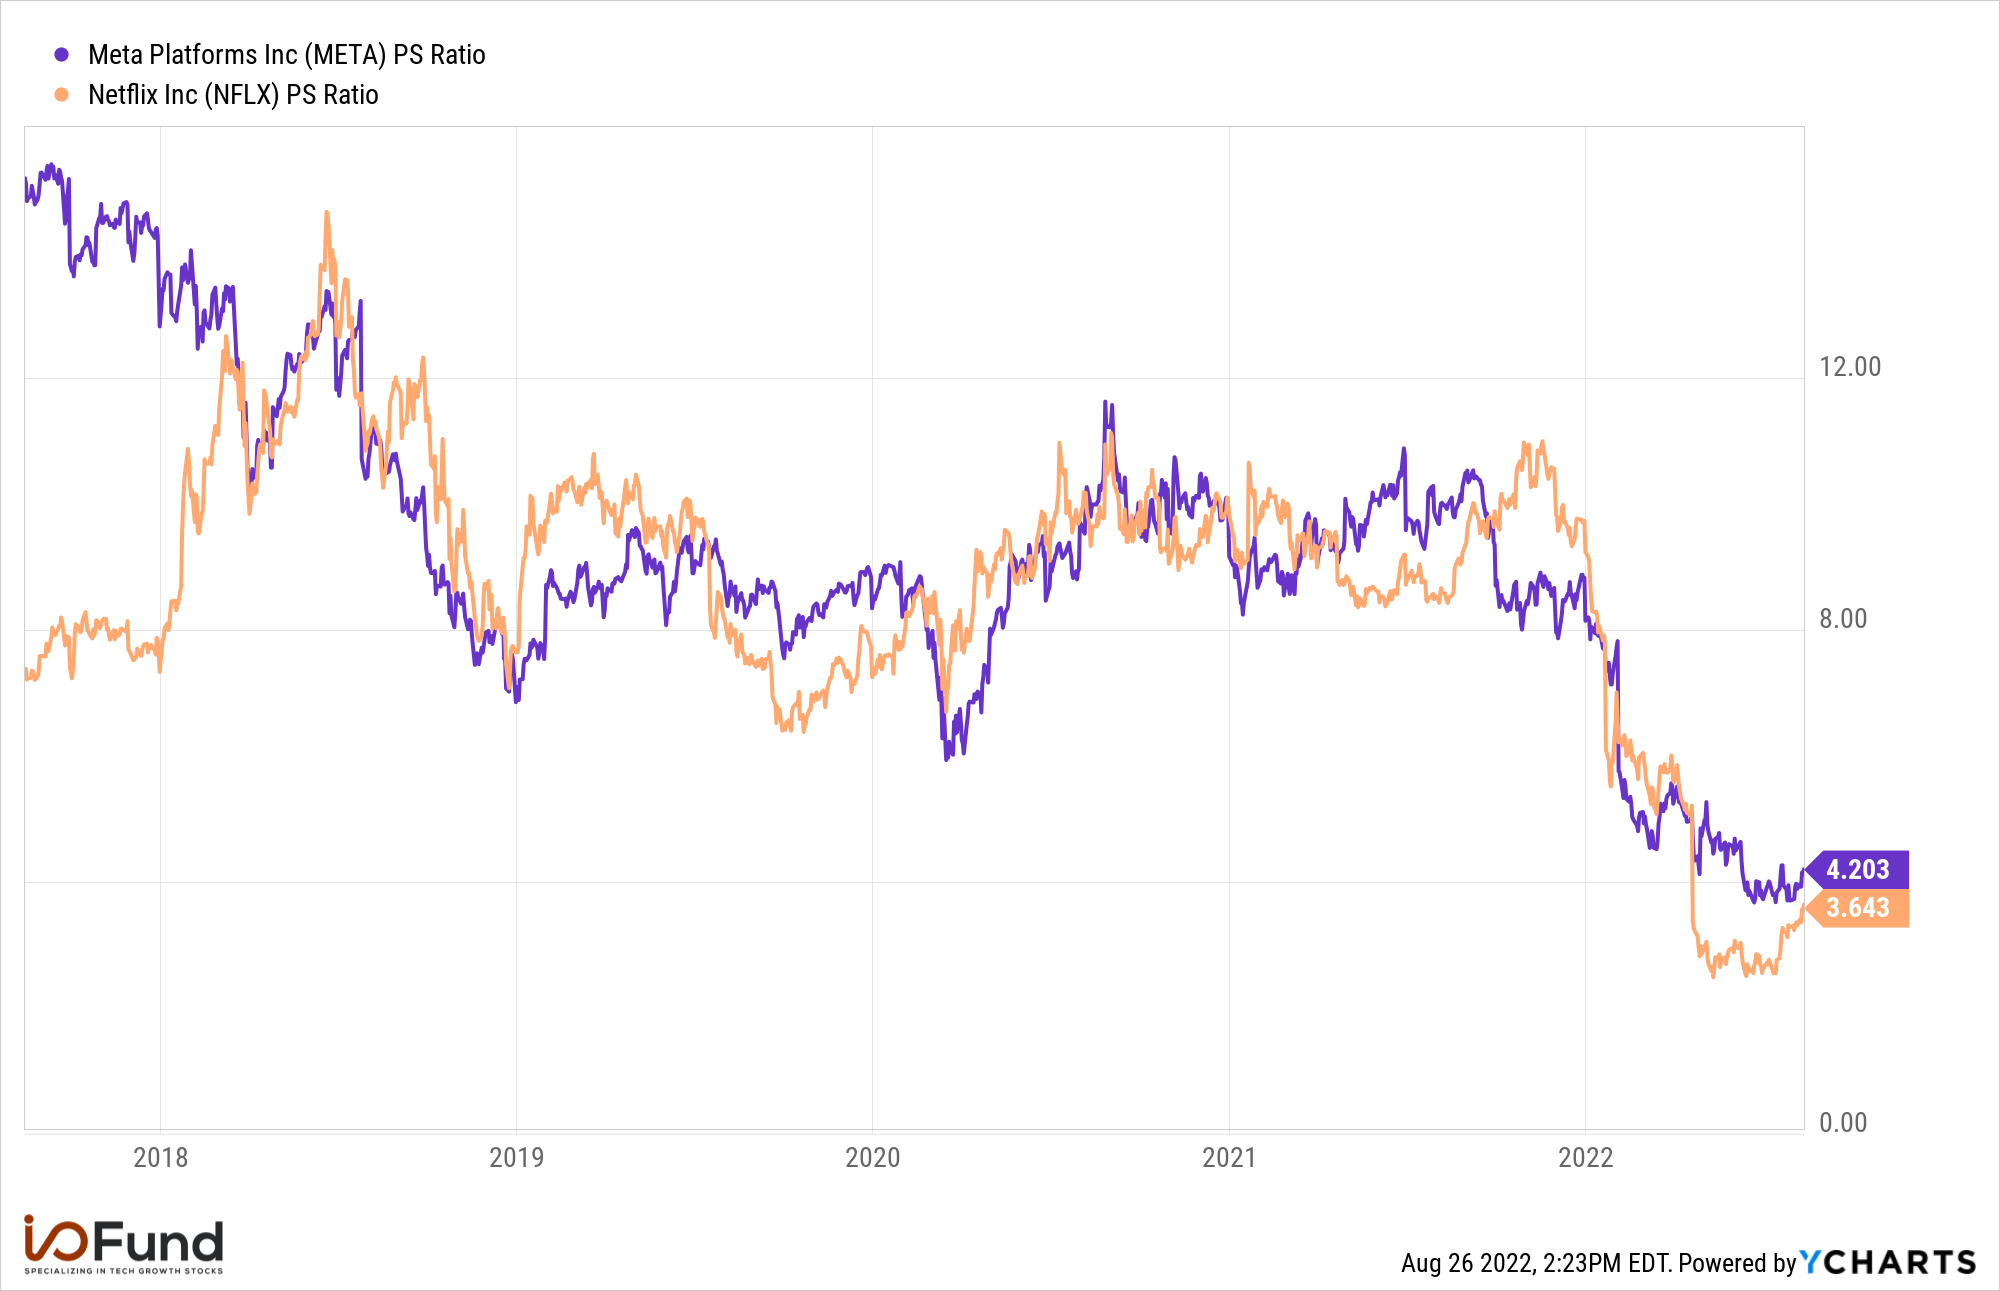
The P/S ratio chart below shows how Meta Platforms and Netflix are trading at a discount compared to the past five-year period. Companies like Netflix lost cash in 2019 when the company was building the original content pipeline. Now, the management is guiding for free cash flow of $1 billion this year and ‘substantial’ free cash flow in 2023.
Download Visual l Modify in YCharts
Top Ranked Ad-Tech Stocked Based on Free Cash Flow Margin
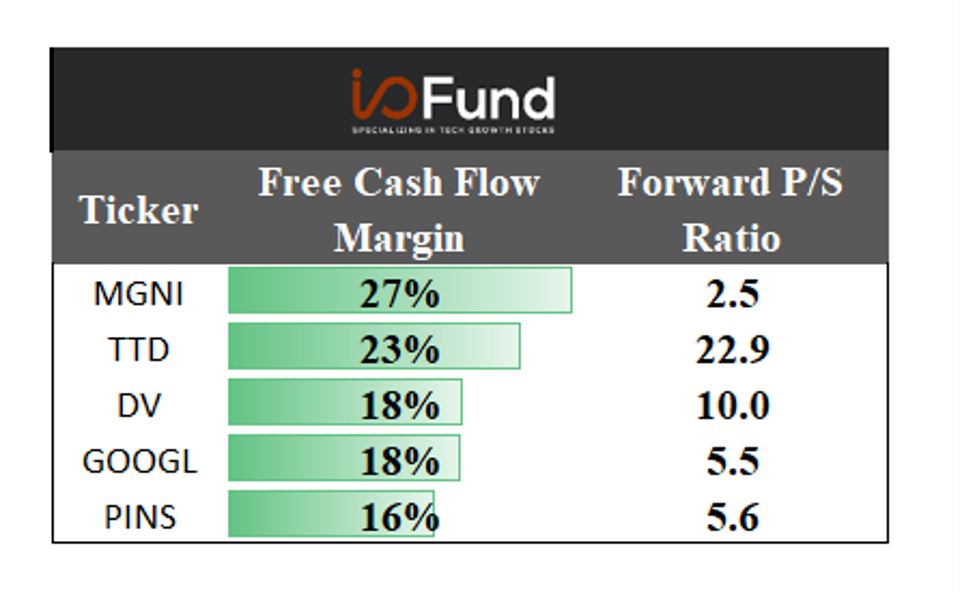
Magnite leads the ad-tech sector with the highest free cash flow margin of 27%. It is followed by The Trade Desk, which has a free cash flow margin of 23% and DoubleVerify has 18%.
Top Ranked Ad-Tech Stocks Based on Net Profit Margin
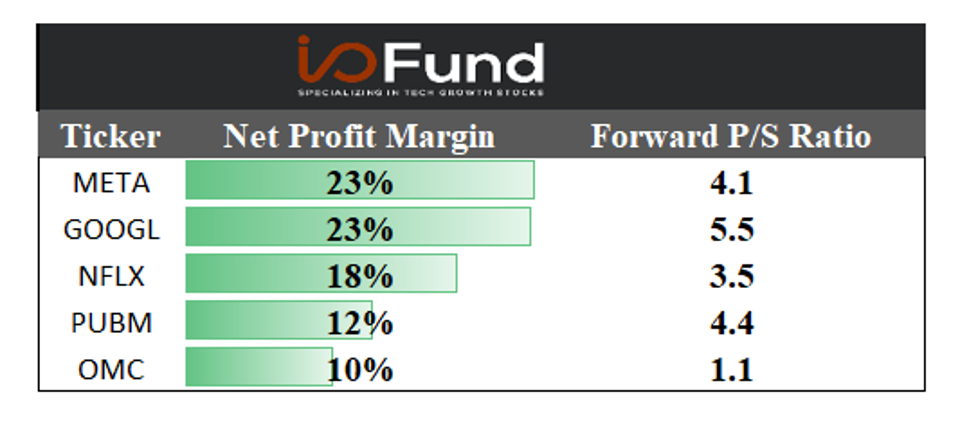
Meta Platforms leads the ad-tech sector with the highest net profit margin. The company’s revenue declined for the first time in Q2. Revenue fell by 1% YoY to $28.8 billion. The company is looking to reduce its expenses due to the revenue slowdown to maintain strong margins. For the full year, it expects total expenses of $85 billion to $88 billion, down from the last quarter’s guidance of $87 billion to $92 billion and the prior estimate of $90 billion to $95 billion.
Royston Roche, Equity Analyst at the I/O Fund, contributed to this article.
Please note: The I/O Fund conducts research and draws conclusions for the company’s portfolio. We then share that information with our readers and offer real-time trade notifications. This is not a guarantee of a stock’s performance and it is not financial advice. Please consult your personal financial advisor before buying any stock in the companies mentioned in this analysis. Beth Kindig and the I/O Fund do not own any of the stocks discussed in the analysis at the time of writing although Beth Kindig and the I/O Fund may own stocks pictured in the charts. The I/O Fund and Beth Kindig do not have plans to initiate any new positions in the next 72 hours.
Follow me on Twitter. Check out my website or some of my other work here.

Beth Kindig (@Beth_Kindig) has ten years of experience in competitive analysis and product analysis in the tech industry dating back to 2011. Considering tech growth stocks took off after the financial crisis, she is an experienced professional in every sense of the word.
Disclosure: Beth Kindig and the I/O Fund may own shares in any of the discussed companies and do not have plans to change their respective positions within the next 72 hours. The above article expresses the opinions of the author, and the author did not receive compensation from any of the discussed companies.
.
Connect With YCharts
To get in touch, contact YCharts via email at hello@ycharts.com or by phone at (866) 965-7552
Interested in adding YCharts to your technology stack? Sign up for a 7-Day Free Trial.
Disclaimer
©2022 YCharts, Inc. All Rights Reserved. YCharts, Inc. (“YCharts”) is not registered with the U.S. Securities and Exchange Commission (or with the securities regulatory authority or body of any state or any other jurisdiction) as an investment adviser, broker-dealer or in any other capacity, and does not purport to provide investment advice or make investment recommendations. This report has been generated through application of the analytical tools and data provided through ycharts.com and is intended solely to assist you or your investment or other adviser(s) in conducting investment research. You should not construe this report as an offer to buy or sell, as a solicitation of an offer to buy or sell, or as a recommendation to buy, sell, hold or trade, any security or other financial instrument. For further information regarding your use of this report, please go to: ycharts.com/about/disclosure
Next Article
Do Inverted Yield Spreads Really Predict Market Crashes?Read More →