Do Inverted Yield Spreads Really Predict Market Crashes?
Inverted yield spreads are among the most widely-followed indicators for predicting economic recessions. In fact, an inverted yield curve has preceded every US recession since 1955.
But how effectively can inverted yield spreads be used to predict stock market declines?
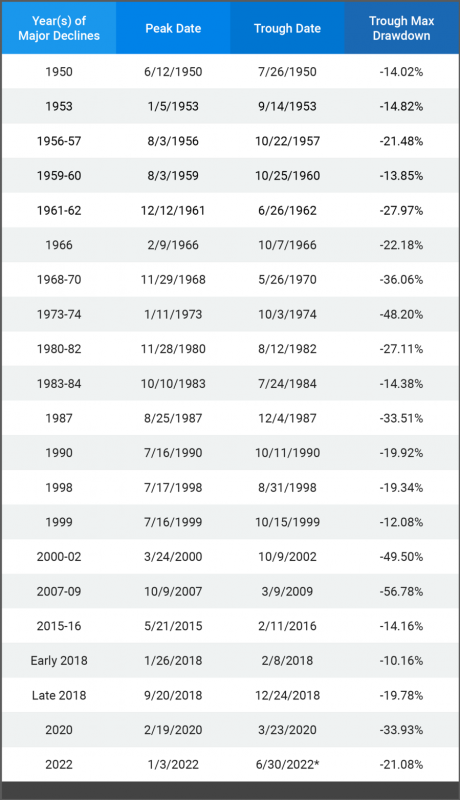
In our latest white paper, Which Leading Indicators Best Predict Market Declines?, we analyzed the 10-2 Year Treasury Yield Spread, 10 Year-3 Month Treasury Yield Spread, and five other leading indicators which are commonly used to predict market crashes. Over 21 major market declines since 1950, each indicator’s accuracy and consistency were varied.
Download the Full Report to Learn More
In addition, we calculated each indicator’s correlation with forward S&P 500 returns, and how much of a warning, measured in months, they gave for impending market crashes.
The findings help answer a timeless (and timely) question: can any leading indicator be consistently trusted to stay ahead of market declines?
Download the new White Paper—which also looks at S&P 500 PE Ratio, CAPE Ratio, The “Buffett Indicator”, Tobin’s Q, and Negative S&P 500 Earnings Growth—for our full findings:
How Accurate are Negative 10-2 Year Yield Spreads At Predicting Market Declines?
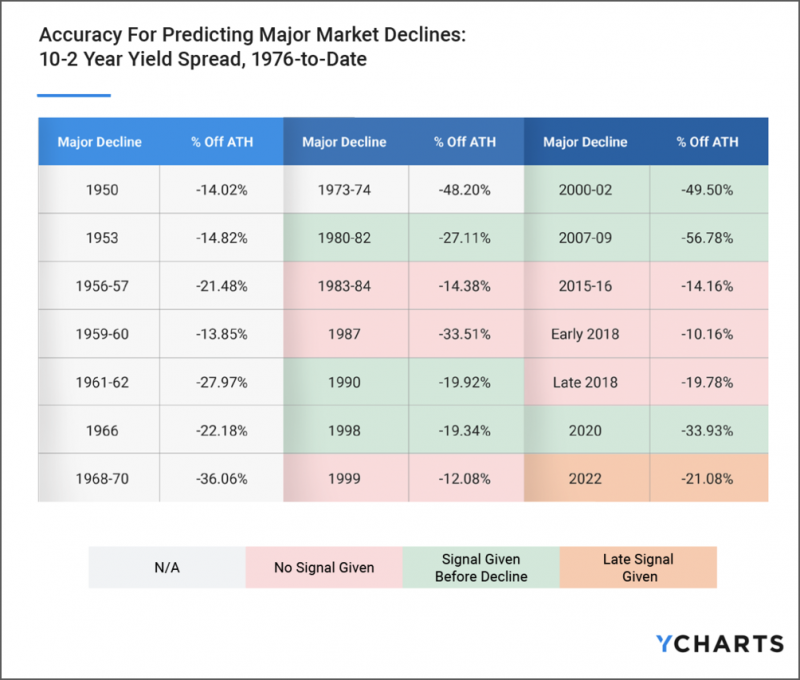
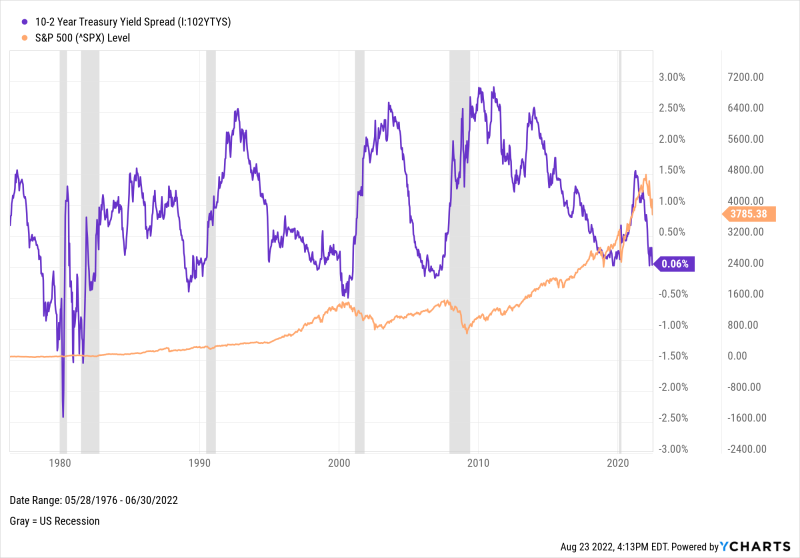
Out of a possible 13 major market declines dating back to May 1976, the 10-2 Year Treasury Yield Spread flipped negative in advance of 6 of them. It also inverted three months after the start of the 2022 market decline—a late warning for anyone trying to time the action.
Download the Full Report to Learn More
With a success rate of 46%, Negative 10-2 Year Spreads are by no means a perfect indicator of stock market declines. However, relative to other leading indicators studied, Negative 10-2 Year Spreads provided timely notice ahead of market declines. The average time between the 10-2’s initial inversion and the S&P 500’s relative peak was 10.57 months across the six market declines. In addition, the 10-2 Year Spread inverted multiple times before some of the six market declines had started, providing additional “heads-up” that long-term investors might have appreciated.
The 10-2 Year Spread’s best timing of a market decline, arguably, was 2000-02. Had you exited the S&P 500 when the spread turned negative on February 2nd, 2000, you would have “taken the money and ran,” just 1 month, 22 days prior to the start of the dot-com crash.
Download Visual | Modify in YCharts
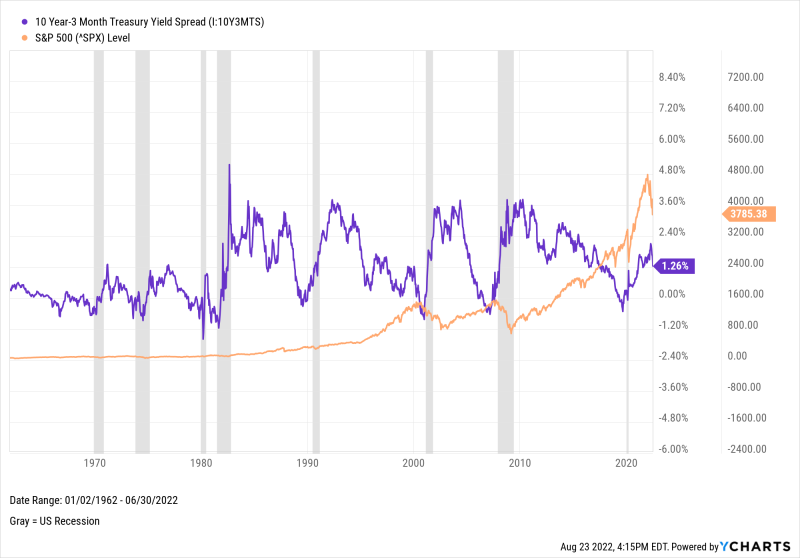
How Accurate are Negative 10 Year-3 Month Yield Spreads At Predicting Market Declines?
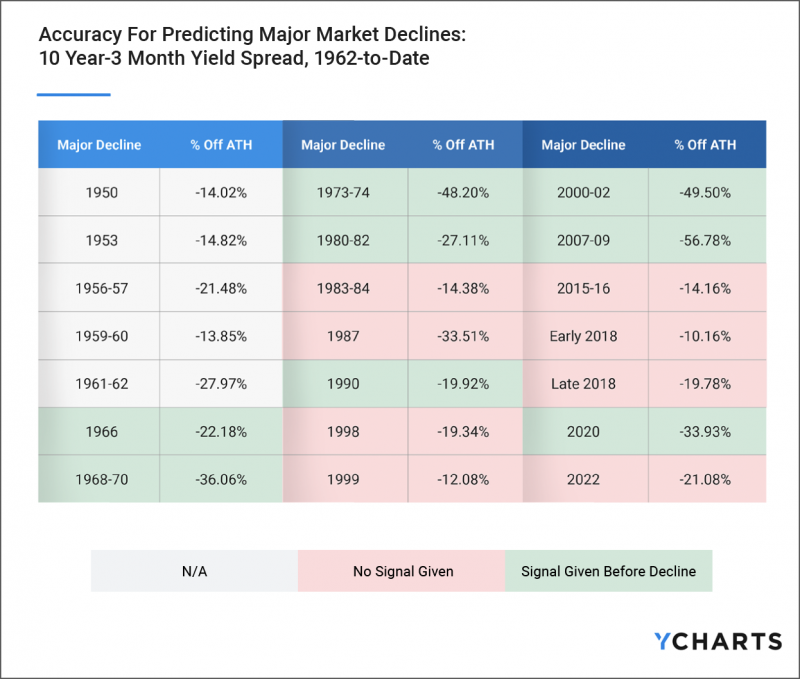
Out of a possible 16 major market declines dating back to January 1962, the 10 Year-3 Month Treasury Yield Spread inverted and provided a warning before 8 of them.
Download the Full Report to Learn More
While the 10 Year-3 Month Spread also hasn’t been a perfect arbiter of market declines, a success rate of 50% is a slight step up from its 10-2 Year Spread cousin. On average, the 10 Year-3 Month Spread inverted 12.9 months in advance of eight major market declines (like the 10-2 Spread, multiple inversions preceded some market crashes). Effectively, this means the 10 Year-3 Month Spread also provided several wake-up calls before some market declines—a great thing if you had hit the snooze button once or twice.
Download Visual | Modify in YCharts
To see how effective other leading indicators have been at preceding stock market declines, download the FREE white paper today!
Connect with YCharts
To get in touch, contact YCharts via email at hello@ycharts.com or by phone at (866) 965-7552
Interested in adding YCharts to your technology stack? Sign up for a 7-Day Free Trial.
Disclaimer
©2022 YCharts, Inc. All Rights Reserved. YCharts, Inc. (“YCharts”) is not registered with the U.S. Securities and Exchange Commission (or with the securities regulatory authority or body of any state or any other jurisdiction) as an investment adviser, broker-dealer or in any other capacity, and does not purport to provide investment advice or make investment recommendations. This report has been generated through application of the analytical tools and data provided through ycharts.com and is intended solely to assist you or your investment or other adviser(s) in conducting investment research. You should not construe this report as an offer to buy or sell, as a solicitation of an offer to buy or sell, or as a recommendation to buy, sell, hold or trade, any security or other financial instrument. For further information regarding your use of this report, please go to: ycharts.com/about/disclosure
Next Article
Why Super Investors Are Selling $MSFTRead More →