Why Super Investors Are Selling $MSFT
FEATURING THE ACQUIRER’S MULTIPLE FINANCIAL ANALYST, JOHNNY HOPKINS
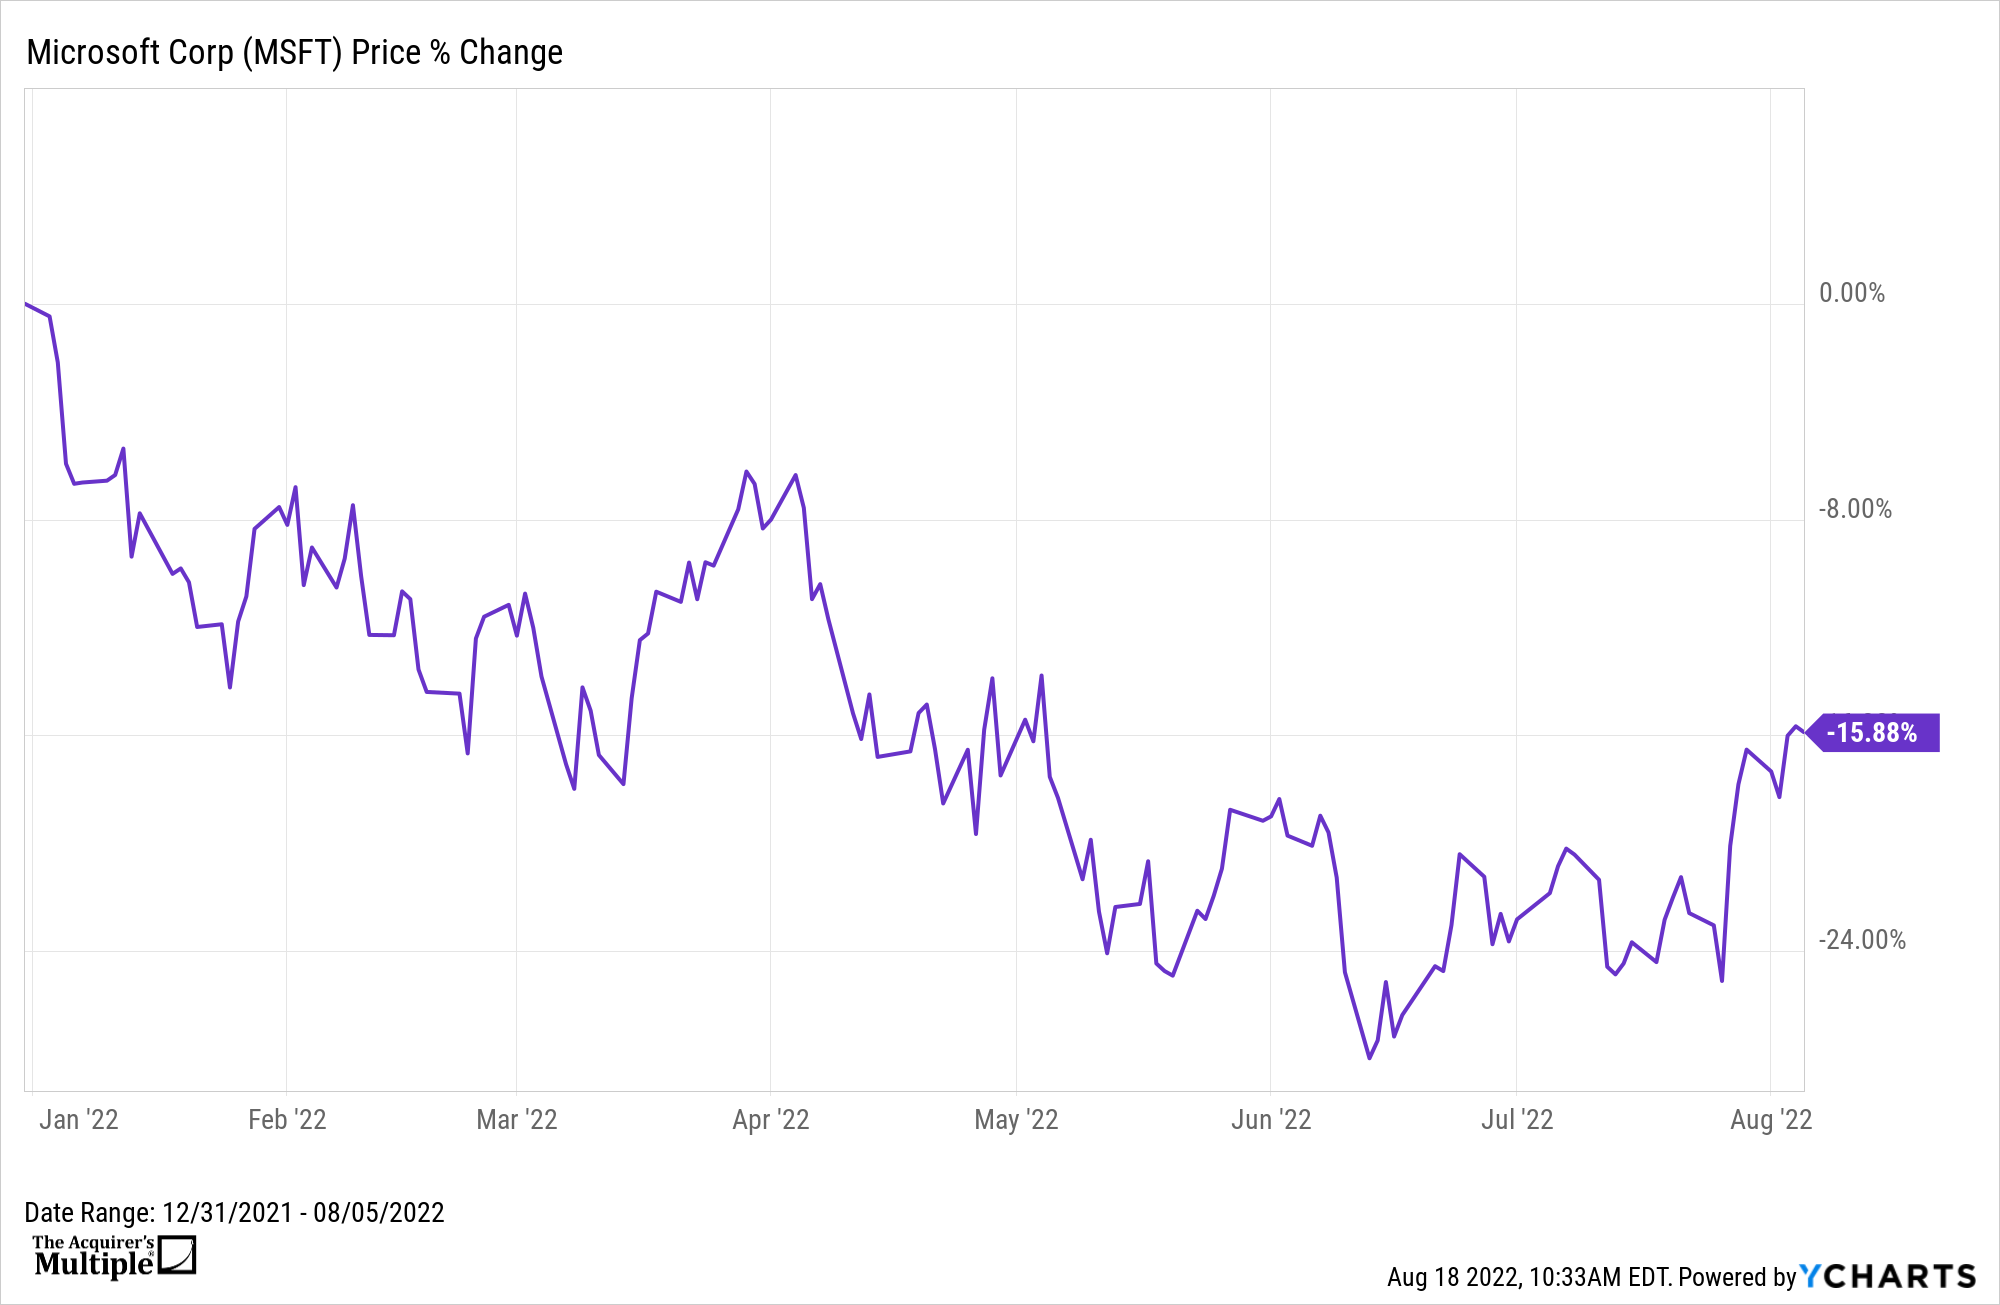
As you can see from the chart below Microsoft Corp’s (MSFT) stock price has fallen 15.88% YTD. Coincidentally, a number of super investors (a list of which is provided below) have reduced their positions in the company and a lot of investors are asking why.
Download Visual l Modify in YCharts

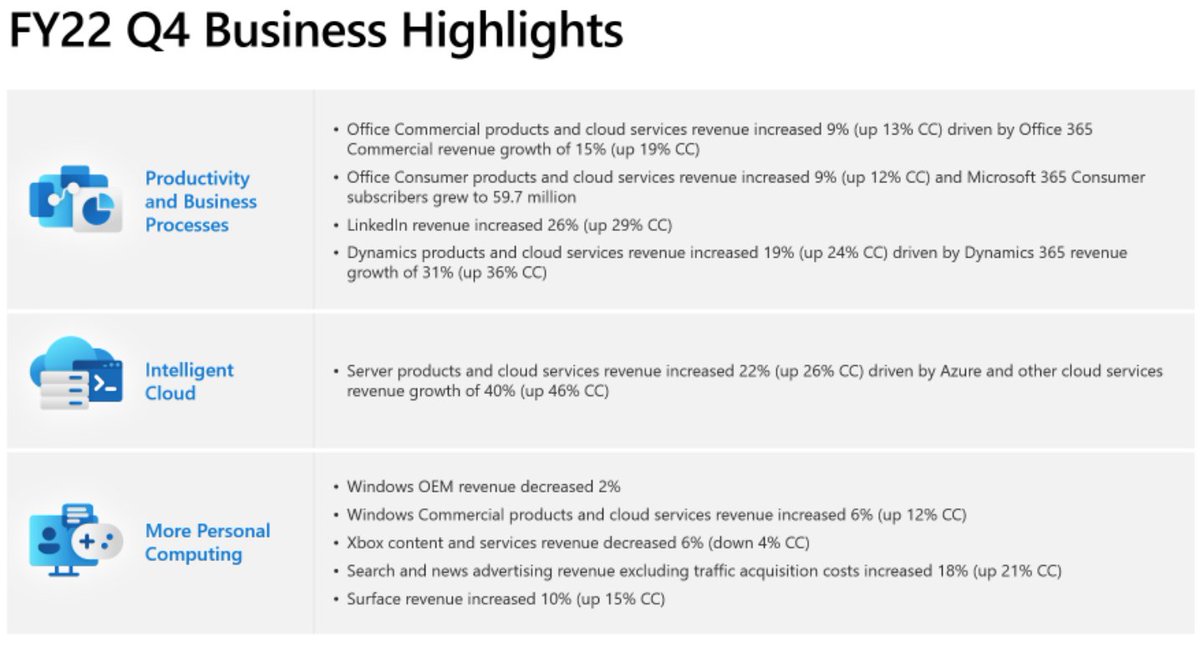
If we look at the company’s latest FY22 Q4 earnings release, total revenue increased 12% to $51.9 Billion compared to the previous corresponding period for 2021. Revenue in Productivity and Business Processes increased 13% to $16.6 billion, driven mainly by 9% revenue growth from Office Commercial products and cloud services. There was 9% revenue growth from Office Consumer products and cloud services. Revenue from LinkedIn increased 26%, and Dynamics products and cloud services revenue increased 19%.
The company also increased its Revenue in Intelligent Cloud by 20% to $20.9 billion, driven mainly by Azure and other cloud services revenue growth of 40%. Revenue in More Personal Computing was $14.4 billion, an increase of 2%.
For the full year 2022 the company posted total revenue of $198.3 Billion, an increase of 18%, while there was a 19% increase in its operating income to $83.4 Billion, and a 19% increase in net income to $72.7 Billion GAAP, compared to the fiscal year 2021.
So it would appear that the company is still a powerhouse in terms of growing demand for its cloud computing and Office products, generating $65.15 Billion of Free Cash Flow in the last twelve months.
Why Are Super Investors Selling?
To understand why super investors are selling we need to take a deeper look at the company’s financials. In the last quarter, the company posted $51.86 Billion in total revenue compared to the previous quarter of $49.36 Billion. That equates to an increase of 5%.
However, over the same period, gross income was $35.44 Billion compared to $33.74 Billion, but the gross margin as a percentage of revenue actually decreased. At the same time, operating income was $20.53 Billion compared to $20.36 Billion for the previous quarter, but the operating margin also decreased.
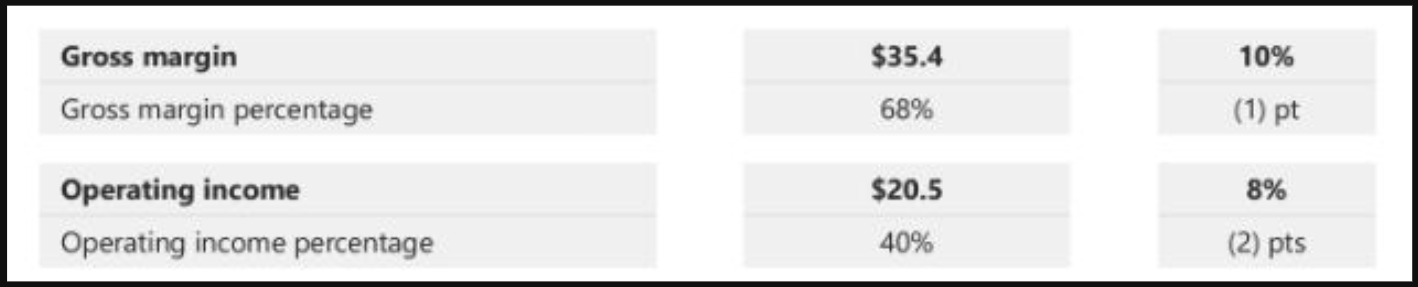
There is no doubt that margins are diminishing.
If we go back to the company’s latest earnings release Microsoft reported the following macroeconomic conditions and other ‘unforeseen items’ that have impacted the fourth quarter results. These include:
• Unfavorable foreign exchange rate movement within the quarter negatively impacted revenue and diluted earnings per share $(595) million and $(0.04), respectively
• Extended production shutdowns in China that continued through May and a deteriorating PC market in June contributed to a negative impact on Windows OEM revenue of over $(300) million
• Reductions in advertising spend contributed to a negative impact on LinkedIn as well as Search and news advertising revenue of over $(100) million
• With the ongoing war in Ukraine, we made the decision to significantly scale down our operations in Russia. As a result, we recorded operating expenses of $126 million related to bad debt expense, asset impairments, and severance.
• As part of a strategic realignment of our business groups, we recorded employee severance expenses of $113 million, excluding Russia
So the company is facing ongoing FX headwinds, a deteriorating PC market, and reductions in advertising spending. Gaming revenue also declined 7%, driven by ‘lower engagement hours’, and ‘monetization in third-party and first-party content. Xbox hardware revenue also declined by 11%. The question for investors is, how much of what has impacted Microsoft’s results in the last quarter is temporary, and how much is set to continue?
The Stock Is Still Expensive
In addition to the above, it’s also important to consider the company’s current valuation, which will illustrate that the company remains overvalued, despite the fact that the stock is down just 2% in the last twelve months.
(EV to EBIT)
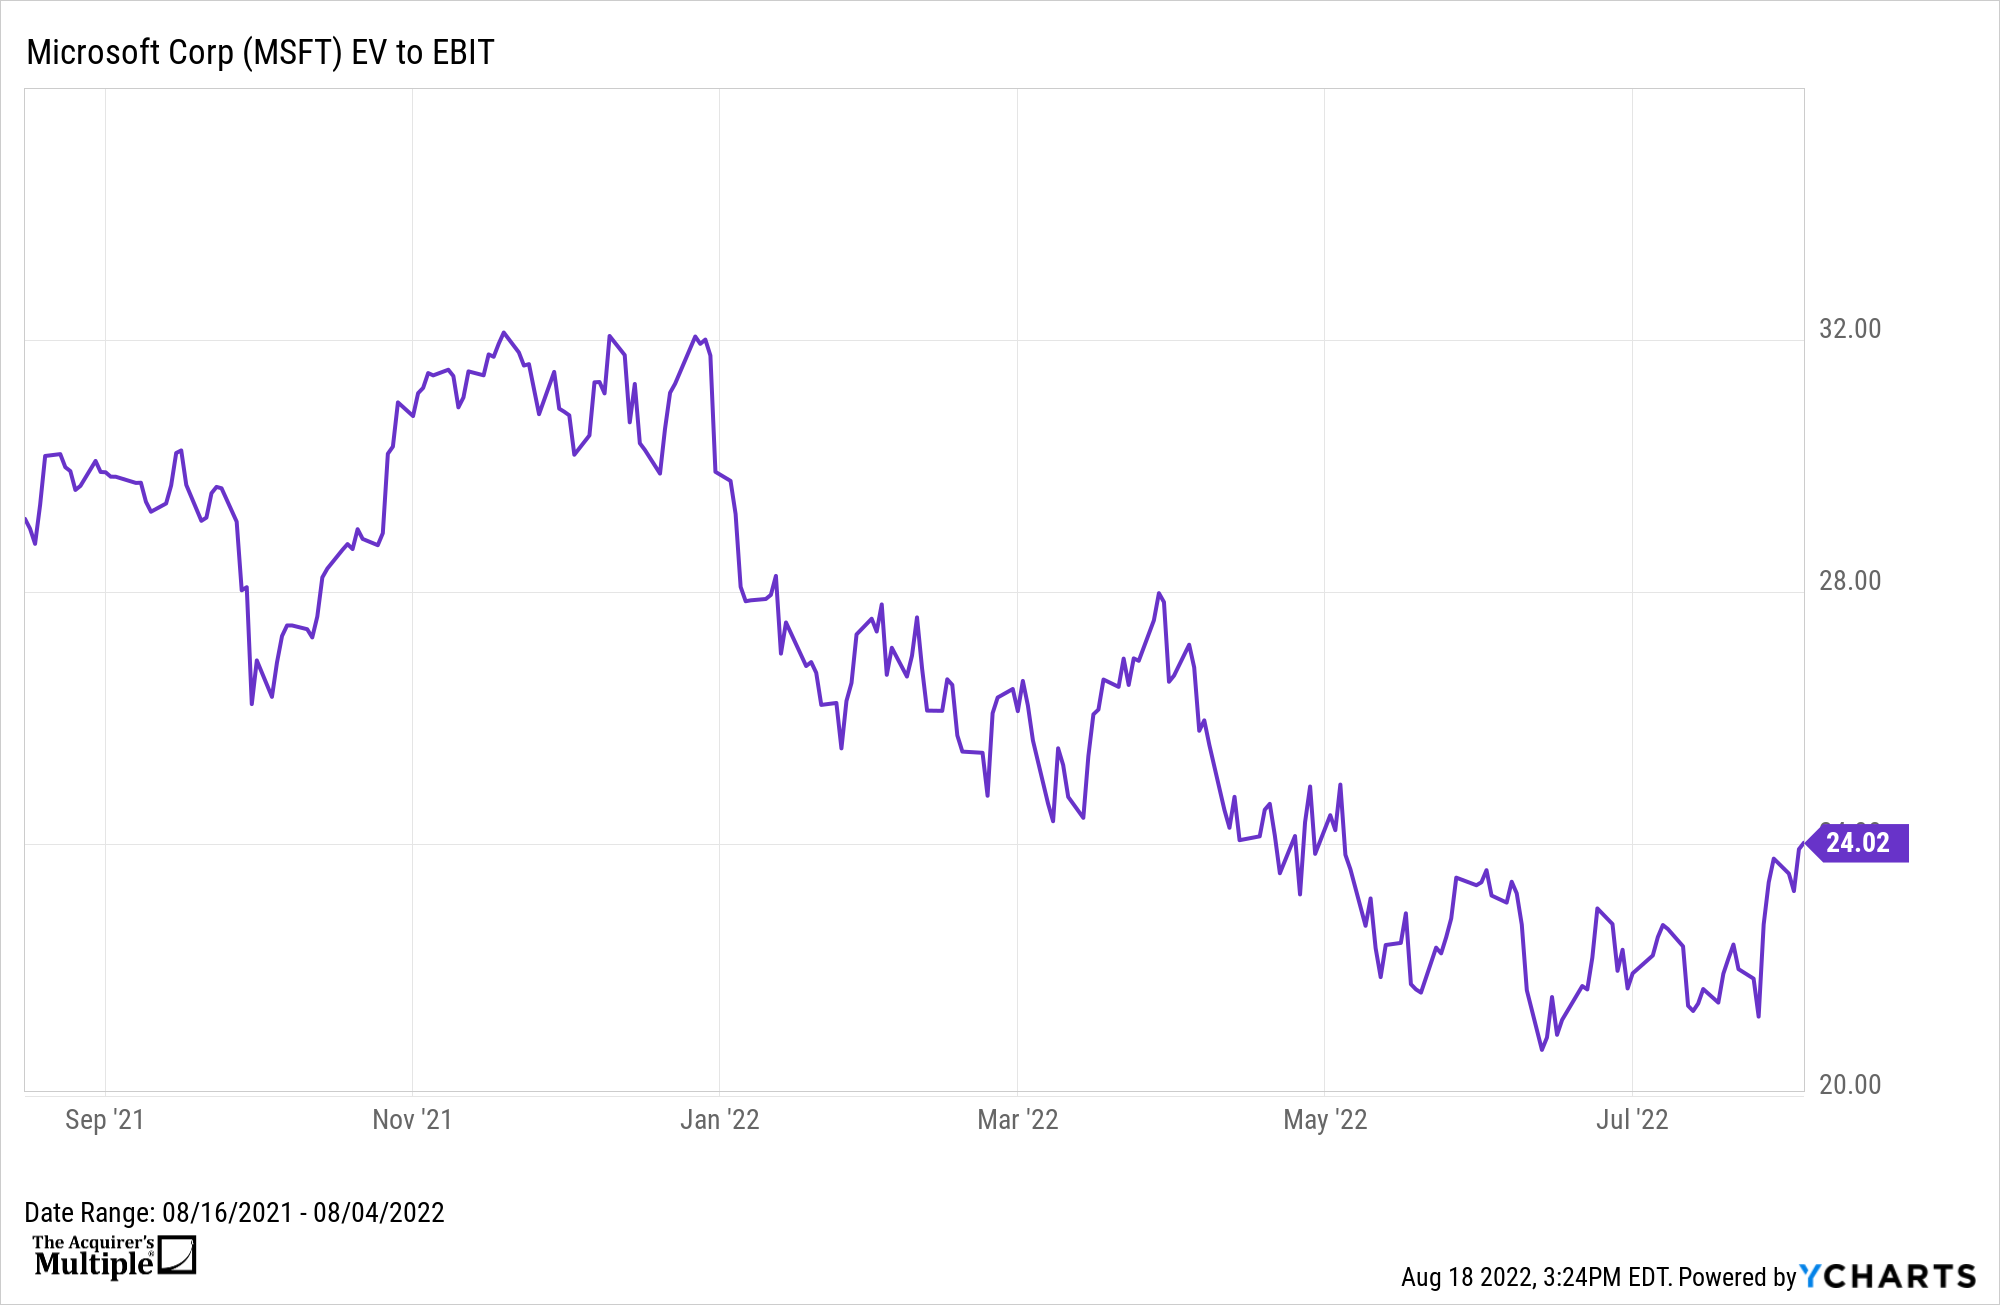
One of the valuation metrics we like to look at is (EV to EBIT) as a way of comparing companies before earnings and tax. Microsoft currently has an Enterprise Value of $2.060 Trillion and EBIT of $85.78 Billion (TTM), this equates to an (EV to EBIT) of 24.02. That suggests that the valuation remains expensive.
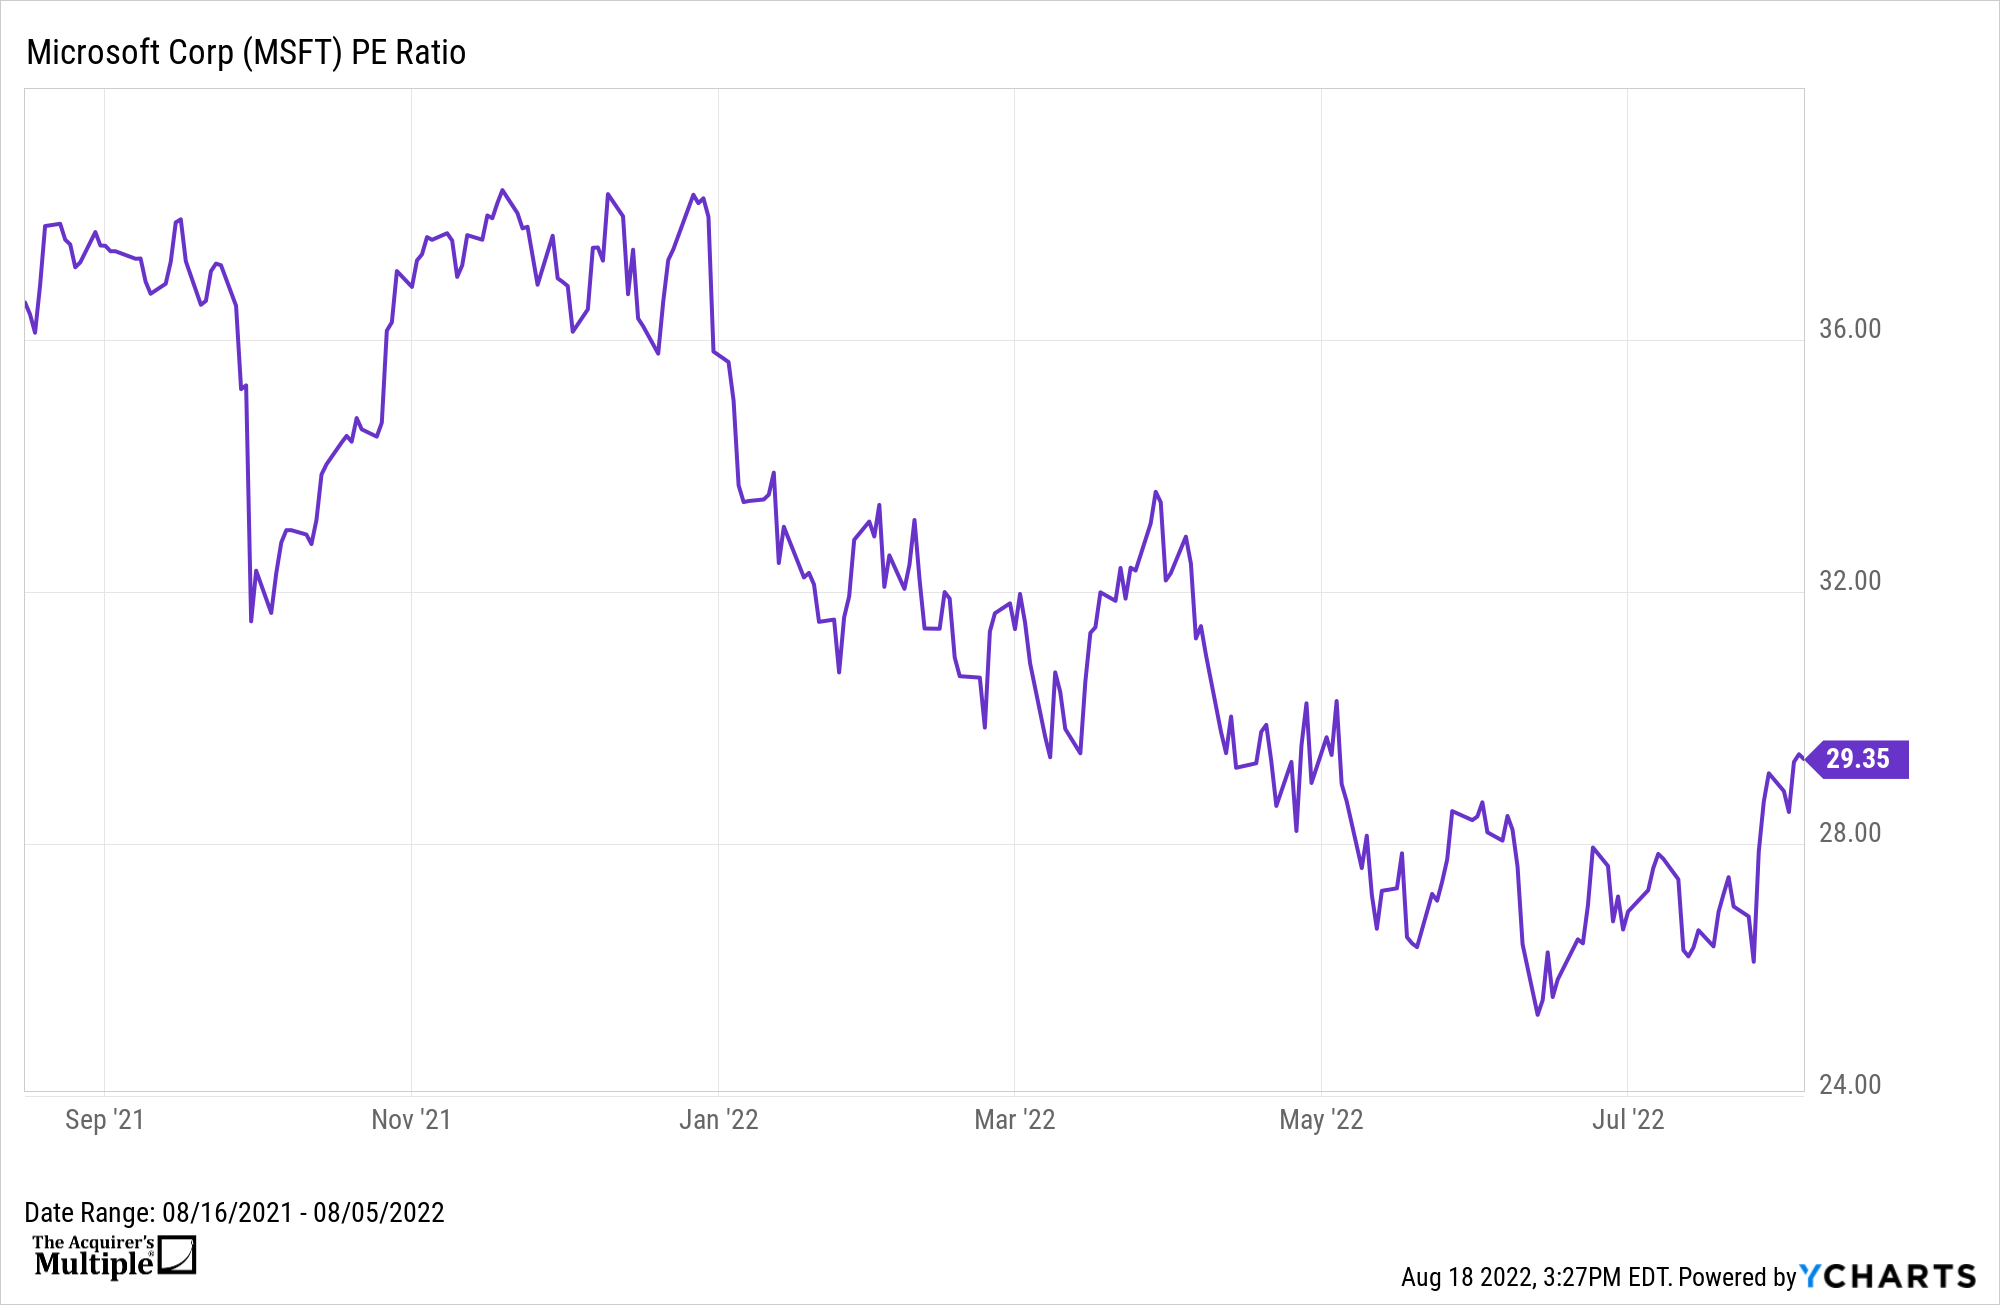
PE Ratio
Based on Microsoft’s current price of $282.91 and EPS of $9.70 the company has a (PE Ratio) of 29.35, which also suggests that the valuation is expensive.
Download Visual l Modify in YCharts
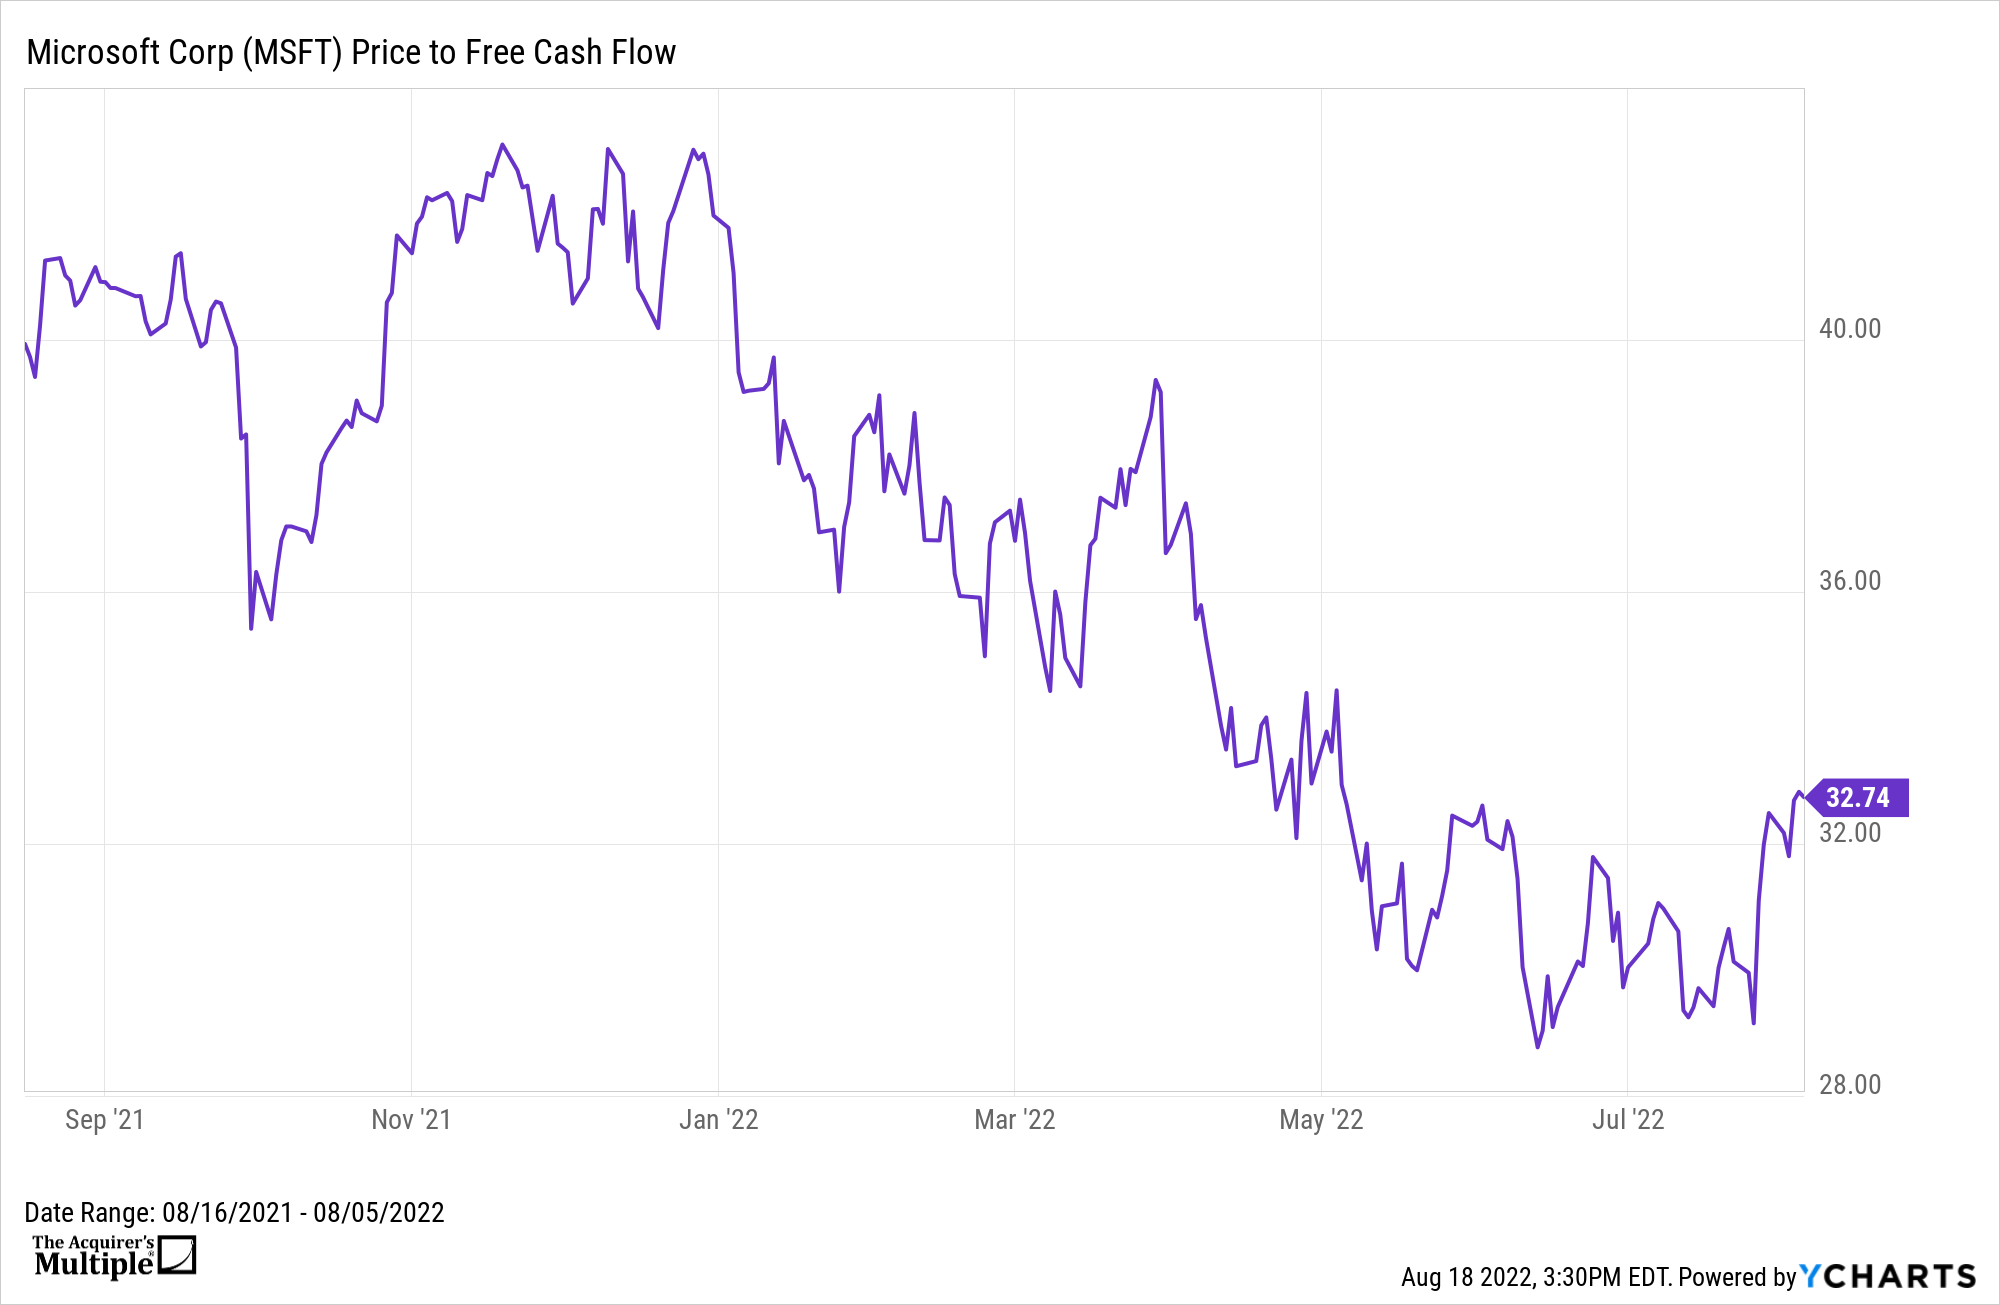
Price to Free Cash Flow
Finally, one other valuation metric that we like to look at is the (Price to Free Cash Flow). Based on Microsoft’s current market cap of $2.110 Trillion and Free Cash Flow of $65.15 Billion, that means Microsoft has a (Price to Free Cash Flow) of 32.74, which is also expensive.
Download Visual l Modify in YCharts
Summary
In summary, Microsoft is a company that has a growing demand for its cloud computing and Office products, and it generates significant free cash flow but, is also faced with ongoing FX headwinds, a deteriorating PC market, reductions in advertising spend, and a significant decrease in gaming revenue. This combined with diminishing margins and an expensive valuation may explain why super investors are selling the stock.
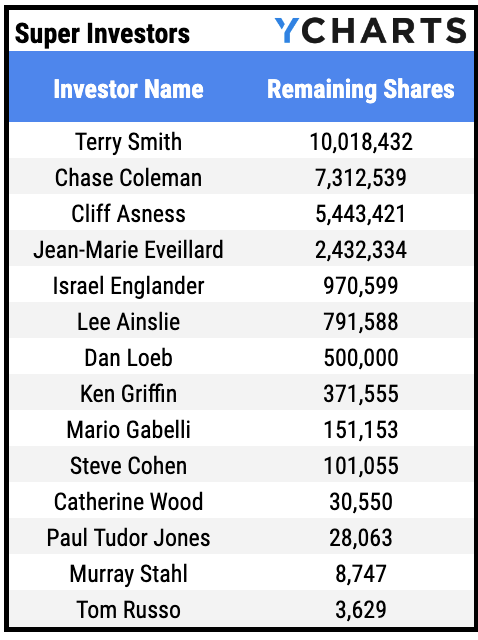
Here’s a list of super investors who reduced their positions in Microsoft, according to their latest 13Fs:
![]()
Johnny Hopkins is a financial analyst who specializes in deep value stocks, at The Acquirer’s Multiple. He’s a Deep Value investor, based in Melbourne, Australia.
The Acquirer’s Multiple takes a holistic approach to valuation, examining assets, earnings, and cash flows, to understand the economic reality of each company. An important part of this process is a forensic-accounting diligence of the financial statements, particularly the notes and management’s discussion and analysis, to find information that may impact investment decisions.
Connect With YCharts
To get in touch, contact YCharts via email at hello@ycharts.com or by phone at (866) 965-7552
Interested in adding YCharts to your technology stack? Sign up for a 7-Day Free Trial.
Disclaimer
©2022 YCharts, Inc. All Rights Reserved. YCharts, Inc. (“YCharts”) is not registered with the U.S. Securities and Exchange Commission (or with the securities regulatory authority or body of any state or any other jurisdiction) as an investment adviser, broker-dealer or in any other capacity, and does not purport to provide investment advice or make investment recommendations. This report has been generated through application of the analytical tools and data provided through ycharts.com and is intended solely to assist you or your investment or other adviser(s) in conducting investment research. You should not construe this report as an offer to buy or sell, as a solicitation of an offer to buy or sell, or as a recommendation to buy, sell, hold or trade, any security or other financial instrument. For further information regarding your use of this report, please go to: ycharts.com/about/disclosure.
Next Article
New on YCharts: ESG Visuals for Stocks, ETFs & Mutual FundsRead More →