
Alternative Investments Explained: Strategies, Structures, and Managers
In our latest alternative research, 95% of surveyed advisors reported that alternatives appear in client portfolios. Yet many still cite liquidity, complexity, and client education as barriers to implementation.
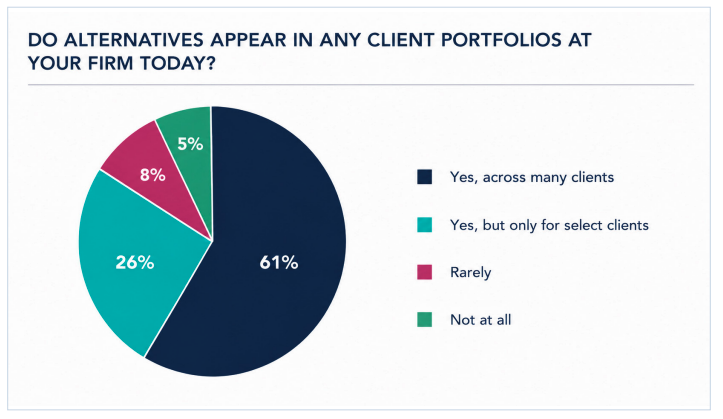
That creates a new challenge. Advisors no longer need to decide whether alternatives belong in portfolios. They need better ways to research, compare, and explain the specific alternatives their clients own.
This is where Alternatives Data in YCharts comes in.
What Are Alternative Investments?
Alternative investments are assets that fall outside traditional public stocks, bonds, and cash. Advisors often use alternatives to diversify, access specialized income, or gain exposure to investment opportunities that are less correlated with public markets.
Alternative investments generally fall into several categories:
- Private Equity: Ownership stakes in privately held businesses
- Venture Capital: Investments in early-stage companies
- Private Credit: Loans made directly to businesses outside traditional bank lending
- Real Assets: Investments in infrastructure, real estate, energy, and natural resources
- Hedge Funds: Strategies designed around specific market opportunities
- Semi-Liquid Alternatives: Vehicles such as business development companies (BDCs) and non-traded REITs
While alternatives are often discussed as a single asset class, the reality is far more complex. Different structures, managers, and vehicles can produce very different outcomes.
Table of Contents
Who Are the Major Alternatives Providers?
Many of the world’s largest investment firms manage alternative strategies across private equity, private credit, infrastructure, and real assets.
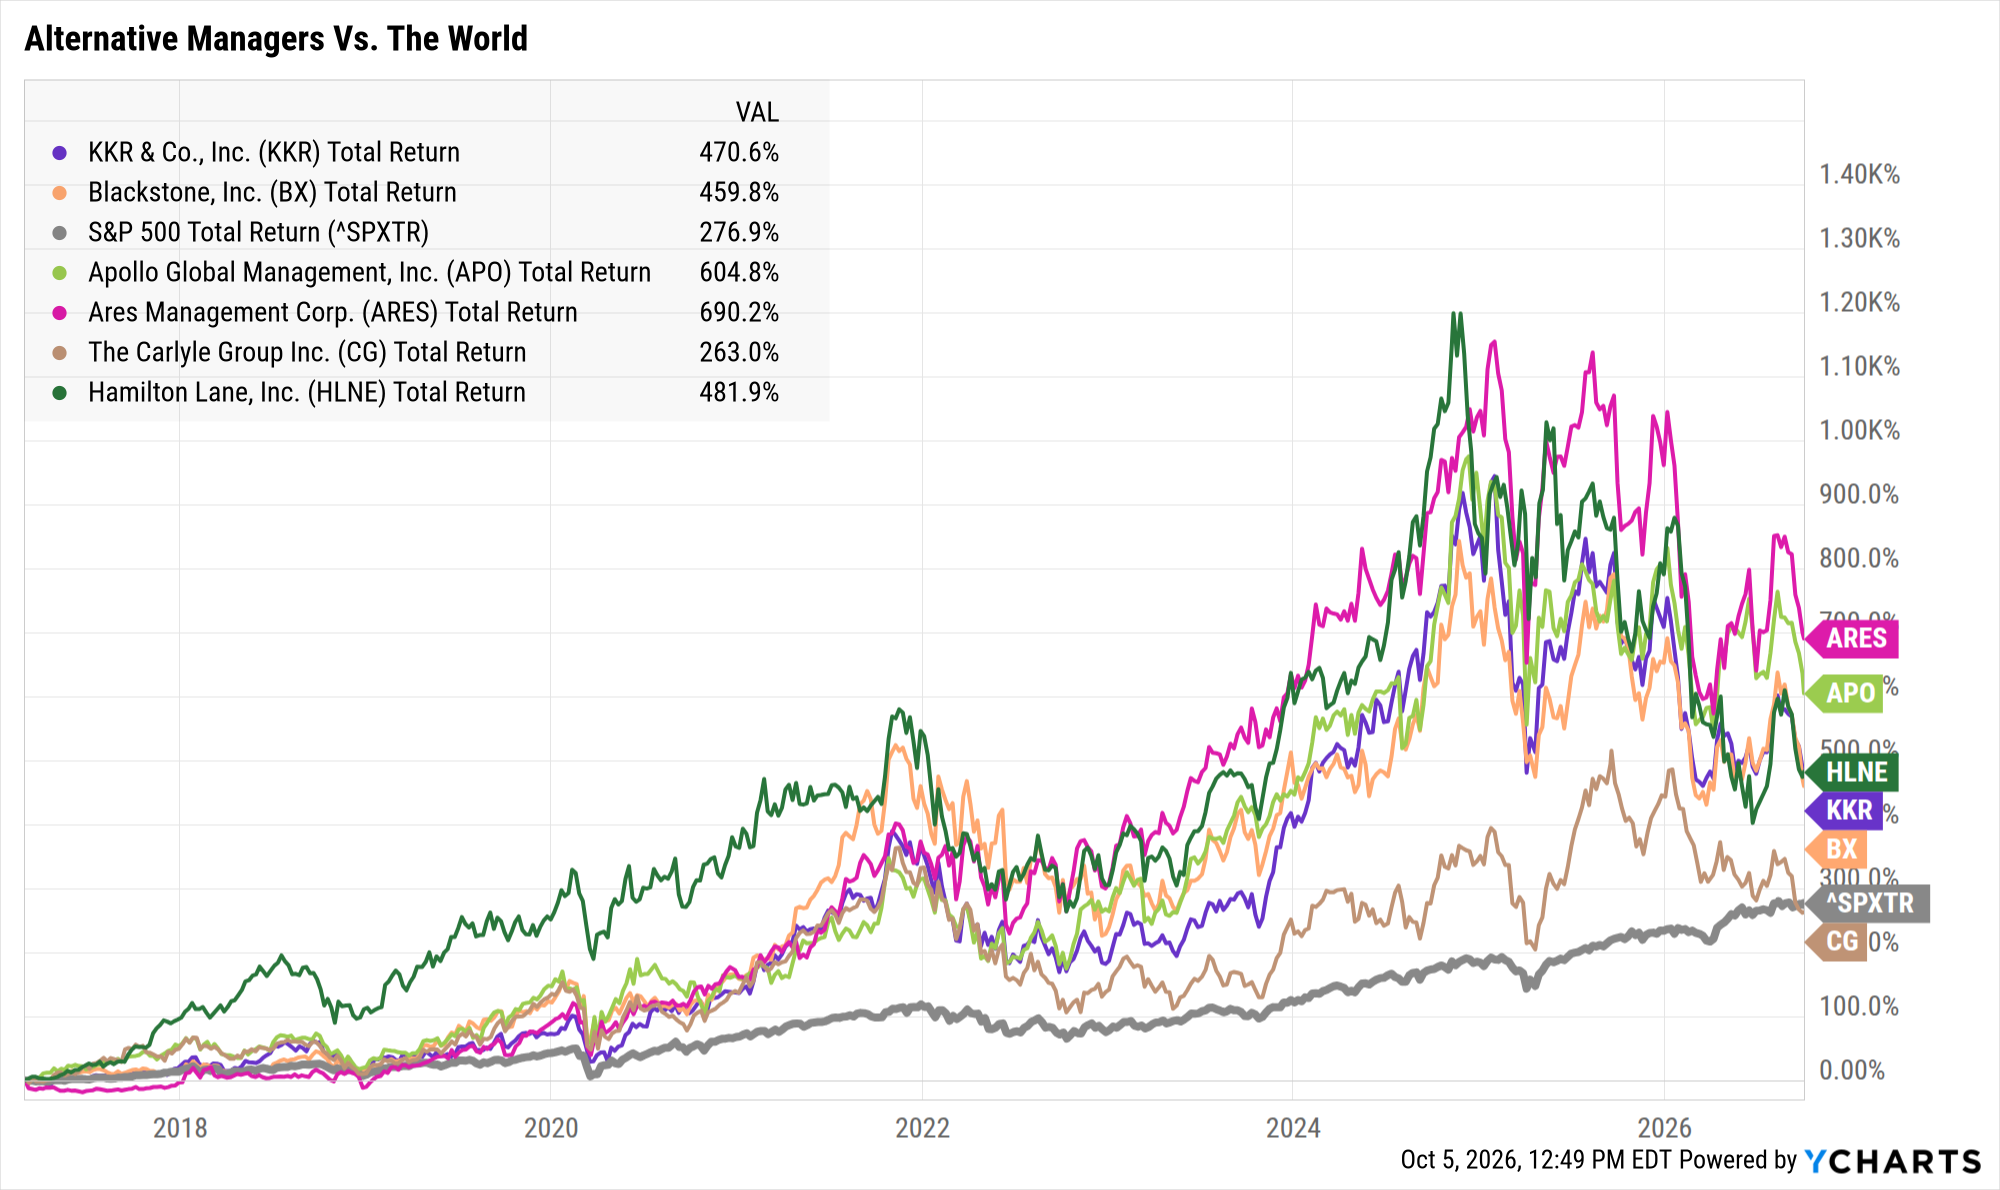
KKR Total Return Level data by YCharts
These firms collectively manage trillions of dollars in assets across private markets, and investors increasingly want exposure to those strategies.
Public Exposure Is Different from Private Exposure
Many investors gain exposure to alternative asset managers through publicly traded securities, such as shares of Blackstone and KKR, or through listed private equity funds and ETFs.
Alternative asset managers are different from most public companies because investors can have two distinct types of exposure: the publicly traded manager itself and the private funds or other investment vehicles it manages. Those exposures are not interchangeable.
A manager’s stock reflects factors including fee revenue, performance fee expectations, balance sheet investments, valuation multiples, and broader equity market conditions. Its funds reflect the performance of their underlying investments, liquidity structure, and valuation methodology.
The distinction matters when evaluating private markets exposure. A manager’s stock performance does not necessarily reflect the performance of the private funds it manages, and the reverse can also be true.
The Problem Is Proxy, Not Returns
Investors looking for private markets exposure may turn to publicly traded securities as a proxy for the underlying private market investments.
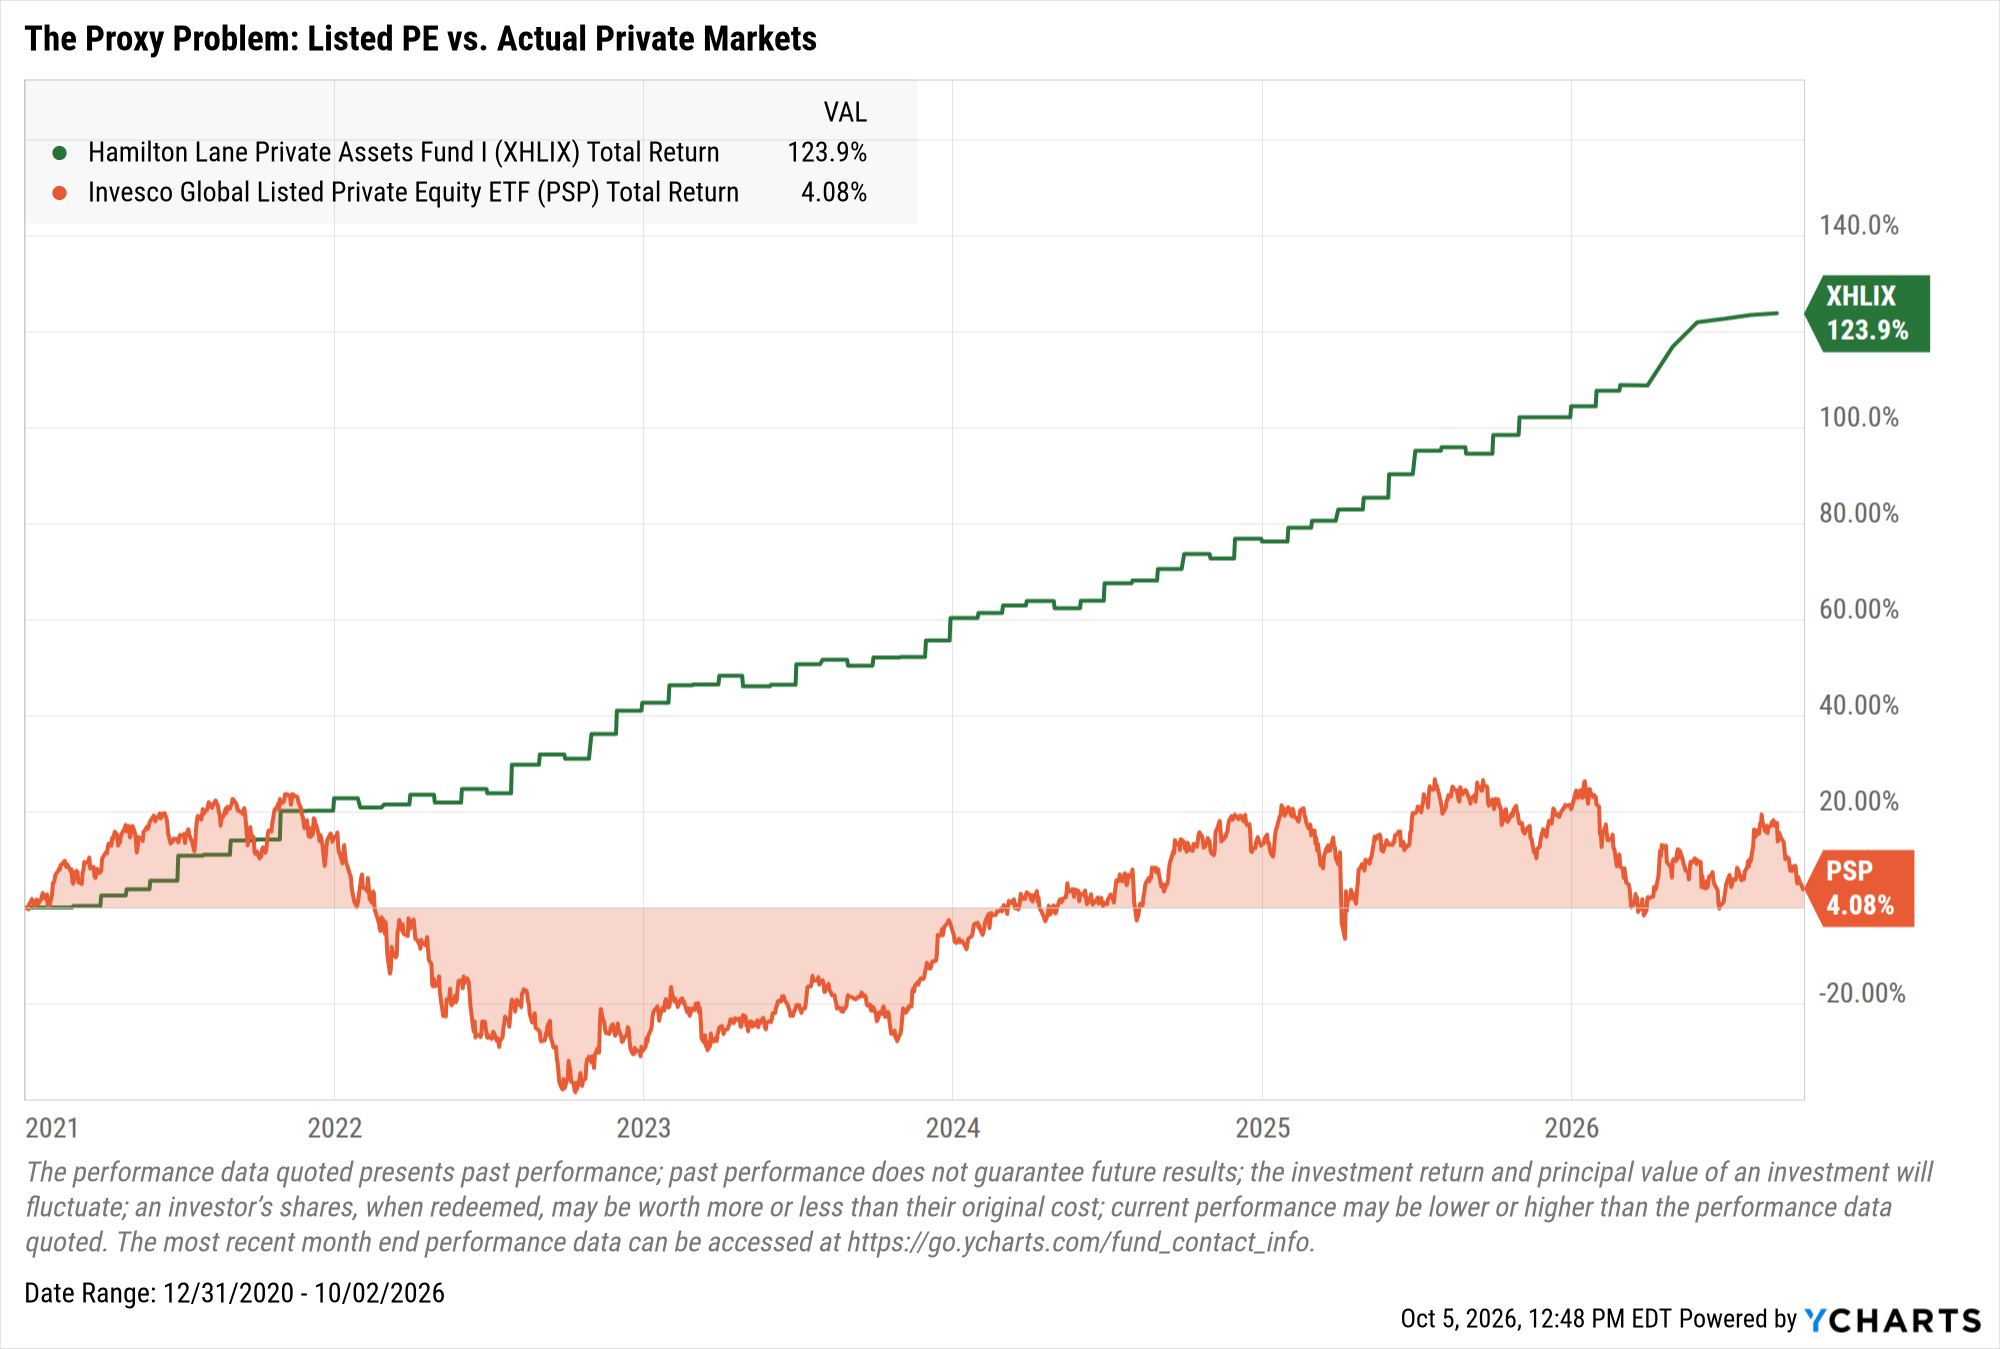
XHLIX Total Return Level data by YCharts
On the surface, it can seem like a reasonable shortcut. But the specific vehicle matters.
Public securities reprice every day based on market sentiment. Private funds are valued according to the underlying assets they own and report performance on a different schedule. These differences can lead to meaningfully different performance patterns even when the investments are connected to the same broader market.
If the goal is understanding what a client actually owns, the specific vehicle matters as much as the asset class itself.
Fund-Level Analysis Matters
Private markets are not a single investment category. Outcomes can vary significantly by manager, strategy, and vintage year.
That is why Alternatives Data brings fund-level coverage directly into YCharts.
Coverage includes:
• 3,000+ private capital funds
• 250+ share classes of semi-liquid funds
• 200+ iCapital share classes
Fund data includes:
• Vintage year
• IRR
• TVPI
• DPI
• RVPI
• Gross asset value
• Strategy classification
• Manager information
Comparing funds from the same vintage illustrates an important point: private market results can vary significantly even among managers operating in similar environments.
Analyze Alternatives Within the Portfolio
Researching a fund is only part of the process.
Advisors also need to understand how an alternative investment affects the broader portfolio.
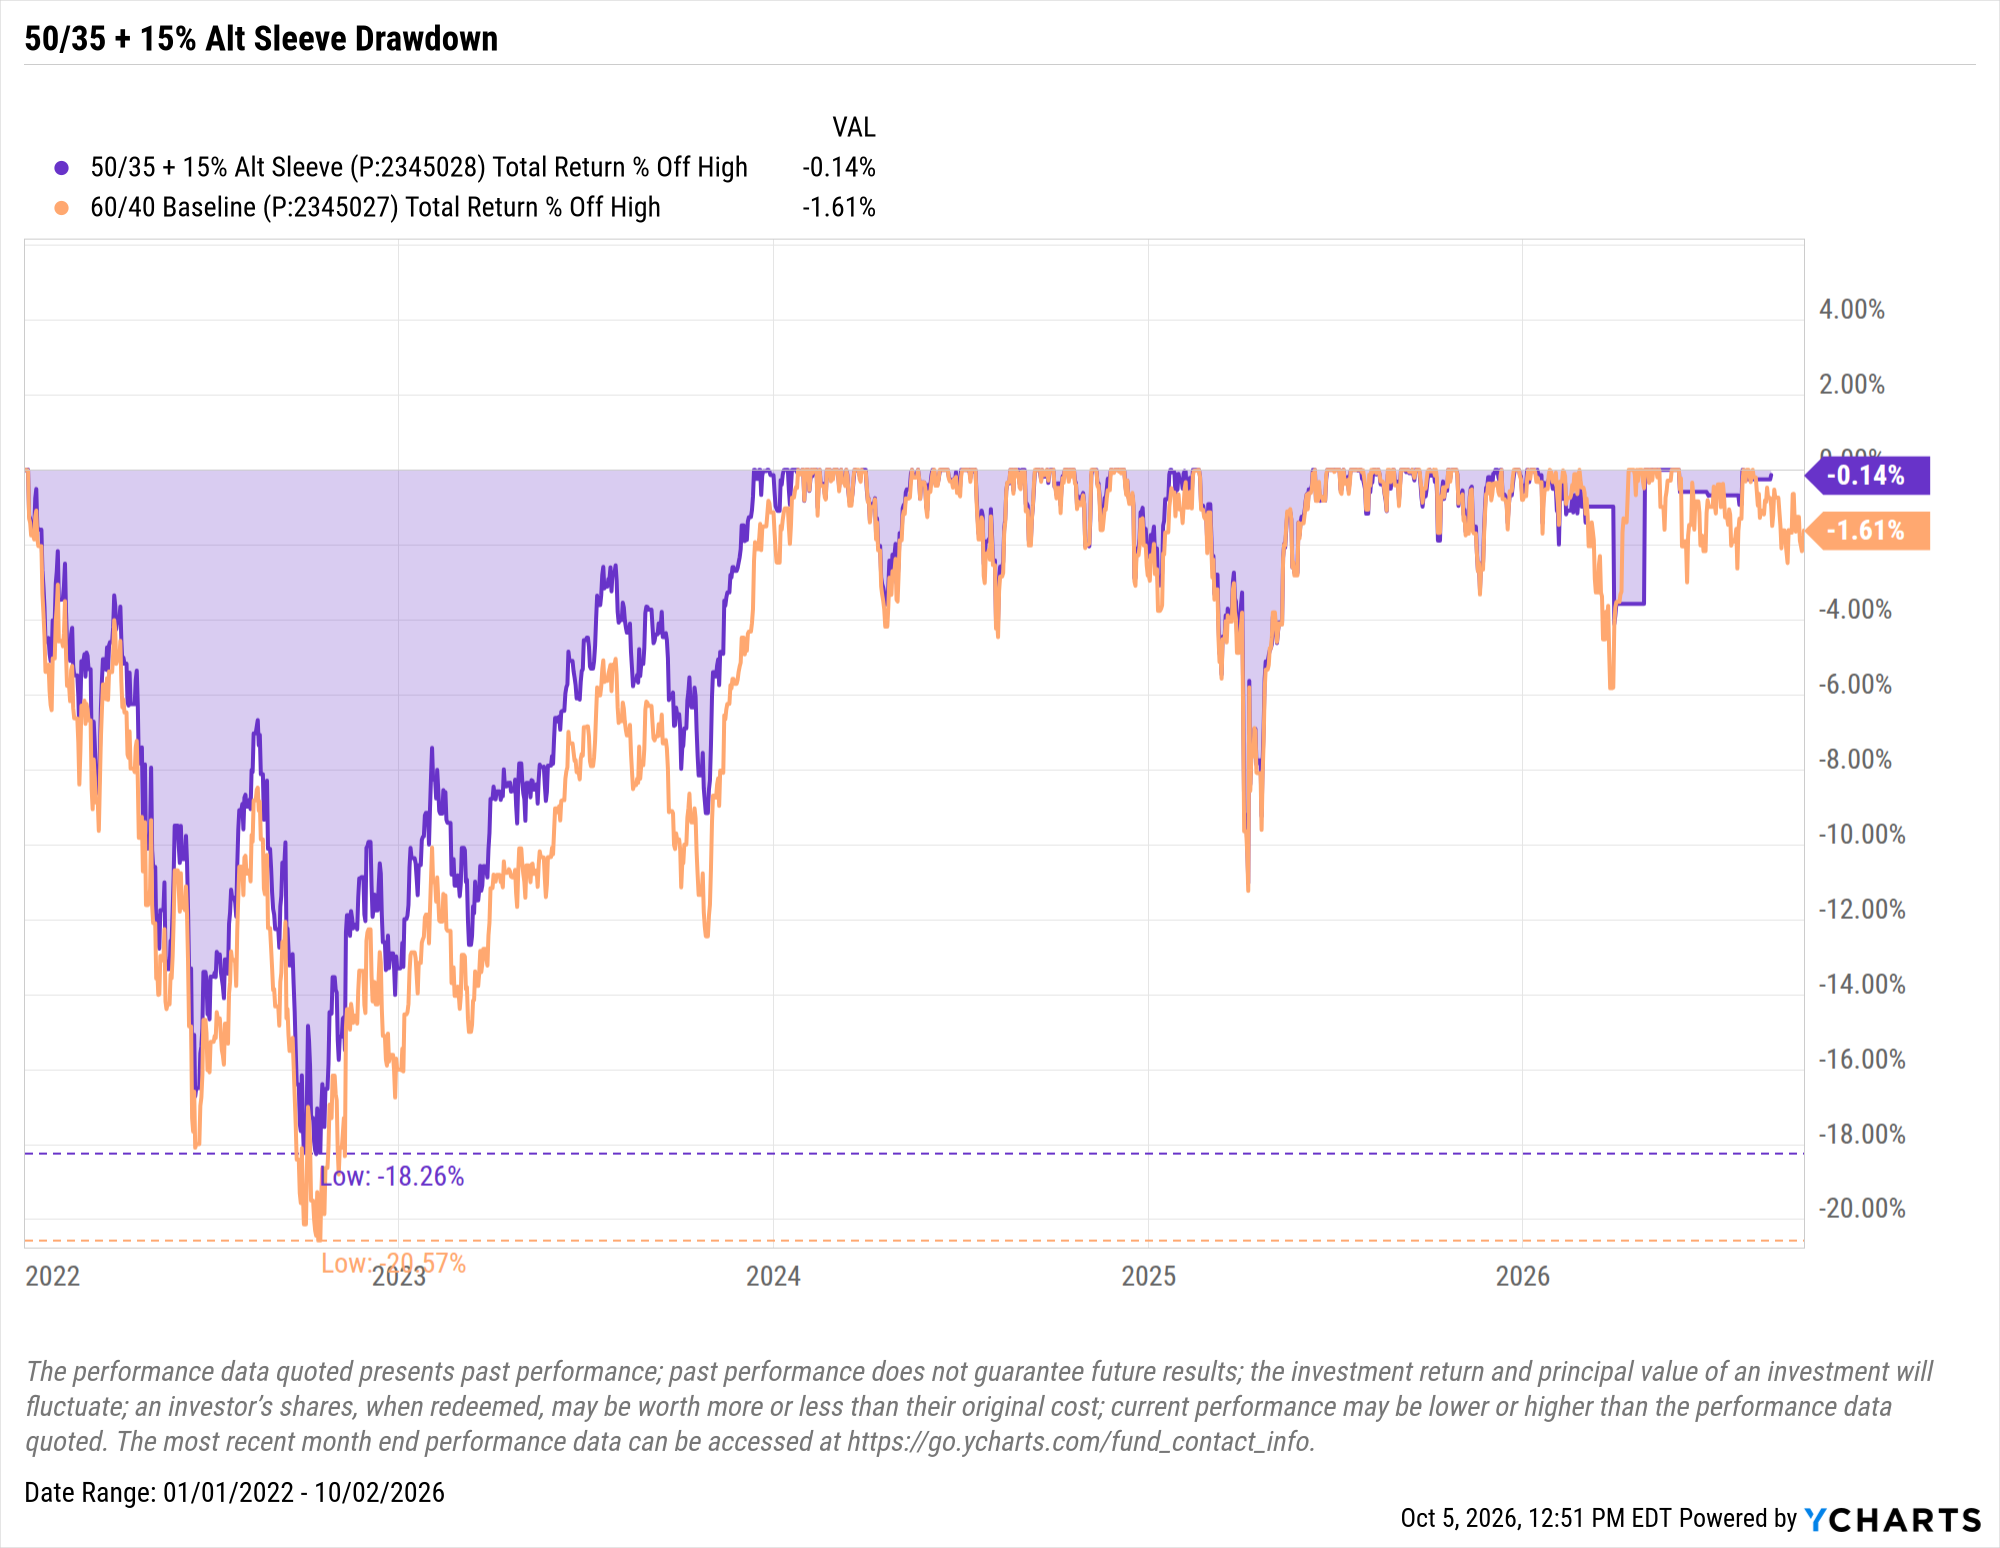
50/35 + 15% Alt Sleeve data by YCharts
Bringing Alternatives Into One Research Workflow
Alternatives Data extends YCharts beyond public markets by bringing private capital funds, semi-liquid investments, and iCapital funds into the same platform advisors already use for research, proposals, and client communication.
When alternatives become a meaningful part of client portfolios, they should be analyzed alongside everything else.
Because the most important question is not whether alternatives belong in portfolios.
It is whether advisors have the tools to evaluate the specific investments their clients actually own.
Whenever you’re ready, there are three ways YCharts can help you:
1. Looking for a tool to help you better communicate market events?
Email us at hello@ycharts.com or call (866) 965-7552. You’ll be directly in touch with one of our Chicago-based team members.
2. Want to test out YCharts for free?
Start a no-risk 7-Day Free Trial.
3. Download a copy of the Monthly Market Wrap slide deck:
Disclaimer
©2026 YCharts, Inc. All Rights Reserved. YCharts, Inc. (“YCharts”) is not registered with the U.S. Securities and Exchange Commission (or with the securities regulatory authority or body of any state or any other jurisdiction) as an investment adviser, broker-dealer or in any other capacity, and does not purport to provide investment advice or make investment recommendations. This report has been generated through application of the analytical tools and data provided through ycharts.com and is intended solely to assist you or your investment or other adviser(s) in conducting investment research. You should not construe this report as an offer to buy or sell, as a solicitation of an offer to buy or sell, or as a recommendation to buy, sell, hold or trade, any security or other financial instrument. For further information regarding your use of this report, please go to: ycharts.com/about/disclosure
Next Article
Monthly Market Wrap: September 2026Read More →