An Advisor’s Guide to Track, Analyze, and Act on Capital Gains
The S&P 500 climbed over 16% through November. Now, as we approach the end of the year, advisors and their clients are faced with a bittersweet scenario: capital gains tax.
Throughout the past few years, investors have watched their portfolios swell, and now, with the final quarter unfolding, it’s time for asset managers and advisors to review potential capital gains distributions from funds. (View the funds with the largest estimated capital gains distributions here.)
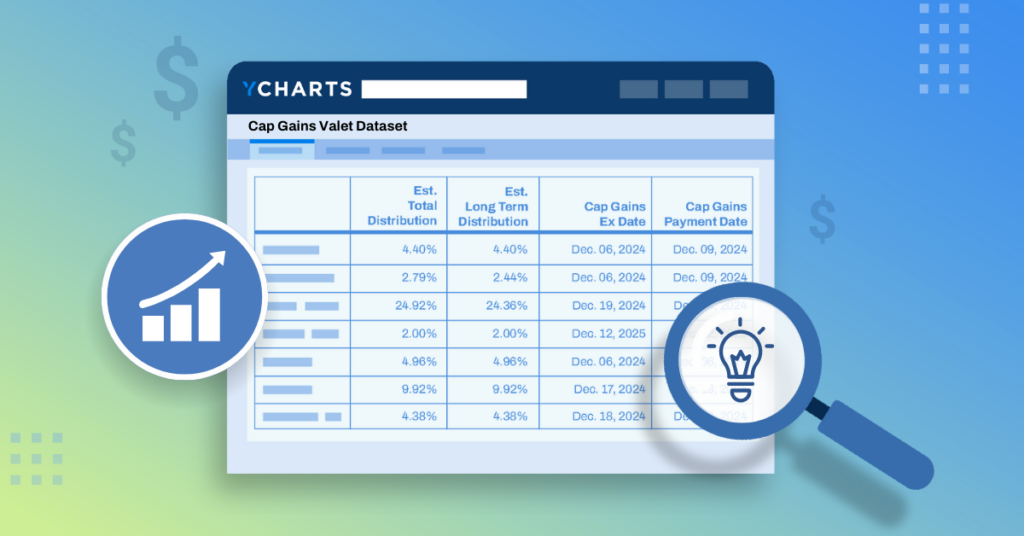
Through an added CapGainsValet dataset, you can analyze distributions by their source: income, short-term, or long-term capital gains. Additionally, these distributions can be quantified as a specific dollar amount or a percentage of the fund’s Net Asset Value (NAV).
View a Sample CapGainsValet Screen
Reach Out to Add Cap Gains Metrics to Your AccountYou can view important dates regarding these distributions in a Comp Table or Fund Screener, such as record, ex-, and payment dates, while also linking back to the fund’s site for easy validation.
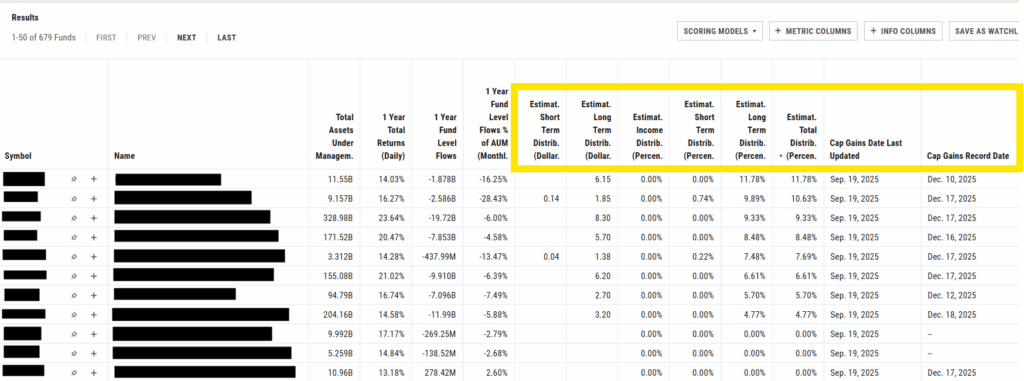
The full suite of metrics in this data set include:
- Estimated Income Distribution (Dollar/Percent)
- Estimated Short Term Distribution (Dollar/Percent)
- Estimated Long Term Distribution (Dollar/Percent)
- Estimated Total Distribution (Percent)
- Cap Gains Date Last Updated
- Cap Gains Ex Date
- Cap Gains Record Date
- Cap Gains Payment Date
- Link To Cap Gains Estimates
These metrics can be valuable to any investor on their own, but for YCharts users, you can seamlessly find out where capital gains are coming from in a model or client’s portfolio, identify potential replacements, and communicate your plan to a client all in one tool.
Table of Contents
Identifying High-Potential Capital Gains in a Client Portfolio
The expanded dataset enables advisors to not only grow their business but also enhance client trust by proactively managing and illustrating potential capital gains from saved portfolios in YCharts.
Whether you Quick Extract a portfolio or manually upload the holdings, employ the “Holdings Cap Gains” quickflow from the portfolio page to pinpoint the origins of capital gains within a model or a client’s portfolio.
Once you’ve identified a fund with a hefty tax bill, whether you plan to rebalance the portfolio at the end of the year or explore tax loss harvesting opportunities to offset the gains, you can find potential replacement funds quickly with the “Cap Gains Analysis for Similar funds” quickflow.
This feature is not only vital for portfolio management but also serves as a powerful tool in new client acquisition, demonstrating how you can reduce their capital gains tax burden for the year, ultimately leading to more comprehensive asset management.
This workflow can also be used to help you generate new business.
You can show a prospect how you can help reduce their capital gains tax burden by replacing their high tax-cost funds, to illustrate a very practical way you can provide value managing their assets.
After using Quick Extract to get your prospect’s portfolio into YCharts in seconds, use the Transition Analysis feature to assess the costs of implementing the changes and chart the most cost-effective route for transitioning a client—or a prospect—into a more tax-efficient account or integrating them into one of your existing models.
Communicating the Capital Gains Strategy to a Client
After identifying where a client’s tax burden will come from and figuring out a plan to soften it, YCharts client communication tools make it easy to outline your plan to a client or prospect.
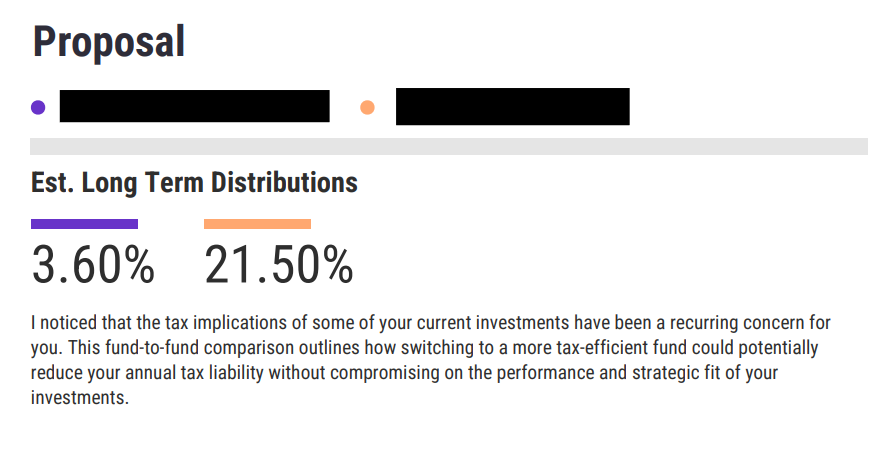
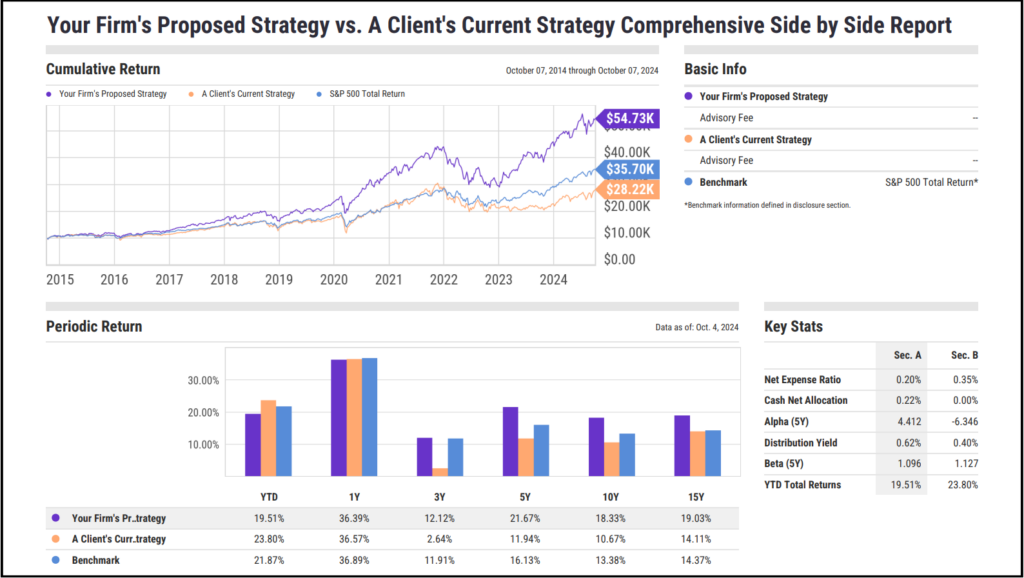
If a client is consistently unhappy with the tax bill issued by certain managers and you are considering rebalancing the portfolio, you can create a fund-to-fund comparison report. The report can be tailored with a personalized proposal that demonstrates how a different investment vehicle could improve tax efficiency in line with the client’s financial goals.
If you plan on selling certain shares for tax loss harvesting purposes, you can present the client with their new portfolio in an overview report. Or run a comparison report to highlight how tax cost harvesting will potentially save them some money or their tax bill at the end of the year.
Incorporating the Cap Gains Valet add-on into your YCharts account can streamline the process of managing capital gains. You can offer comprehensive, customized insights that directly align with your clients’ needs. By facilitating detailed analyses and enabling efficient scenario planning, the Cap Gains Valet add-on saves time and elevates the accuracy and effectiveness of your tax management strategies, demonstrating your commitment to maximizing your clients’ financial outcomes.
Whenever you’re ready, there are 3 ways YCharts can help you:
1. Looking to get deeper insights into how capital gains will impact your clients this year?
Send us an email at hello@ycharts.com or call (866) 965-7552. You’ll be directly in touch with one of our Chicago-based team members.
2. Want to test out YCharts for free?
Start a no-risk 7-Day Free Trial.
3. Get the CapGainsValet dataset added to your YCharts account:
Reach Out to Add Cap Gains Metrics to Your AccountDisclaimer
©2025 YCharts, Inc. All Rights Reserved. YCharts, Inc. (“YCharts”) is not registered with the U.S. Securities and Exchange Commission (or with the securities regulatory authority or body of any state or any other jurisdiction) as an investment adviser, broker-dealer or in any other capacity, and does not purport to provide investment advice or make investment recommendations. This report has been generated through application of the analytical tools and data provided through ycharts.com and is intended solely to assist you or your investment or other adviser(s) in conducting investment research. You should not construe this report as an offer to buy or sell, as a solicitation of an offer to buy or sell, or as a recommendation to buy, sell, hold or trade, any security or other financial instrument. For further information regarding your use of this report, please go to: ycharts.com/about/disclosure
Next Article
Where the ETF Wrapper Is Winning in Canada: 2025 Mutual Fund vs. ETF DivergenceRead More →