
August 2026 Fund Flows: Why Are Investors Turning to Floating Coupons?
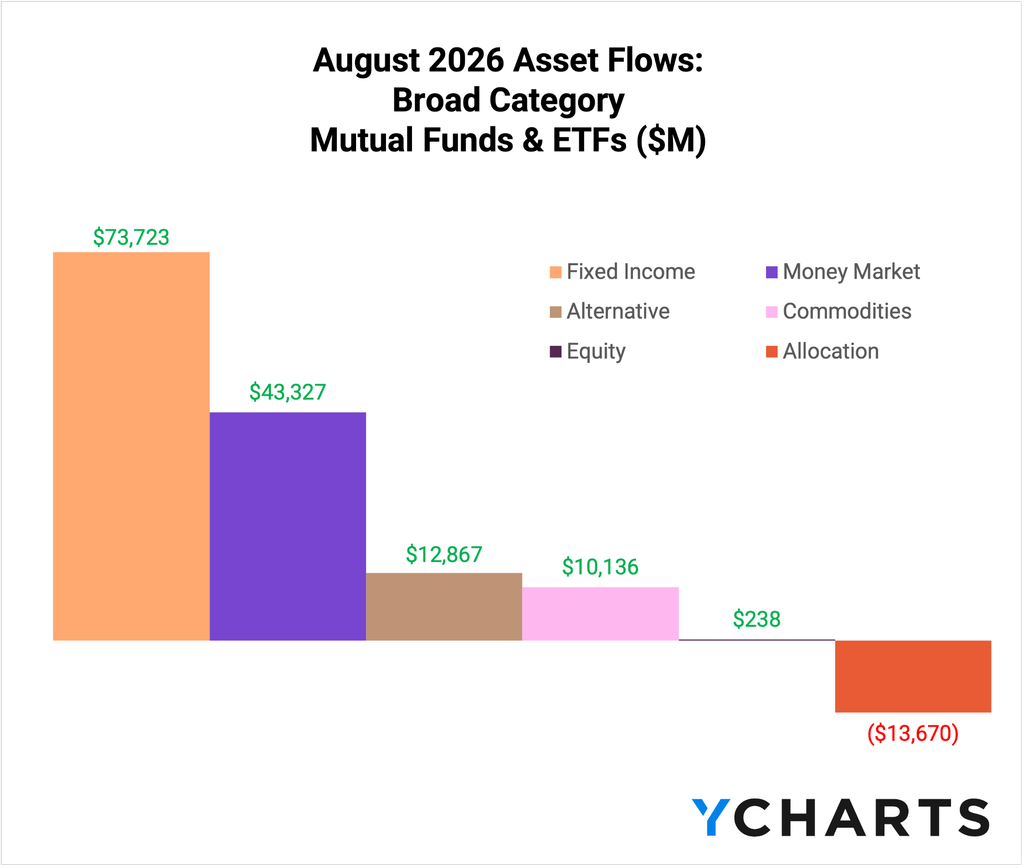
Investors were defensive in August, with fixed income and money market strategies attracting over $117 billion in combined inflows across mutual funds and ETFs. Equities were virtually flat, attracting just $238 million, while allocation funds shed $13.7 billion for the month.
Subscribe to the Fund Flow Report →
Within fixed income ETFs, which generated nearly $50 billion in inflows, allocations concentrated at the front end of the curve. Short U.S. Treasury and Short U.S. Government ETFs pulled in $10.7 billion and $4.5 billion, respectively, while Intermediate U.S. Government ETFs saw $2.4 billion in outflows.
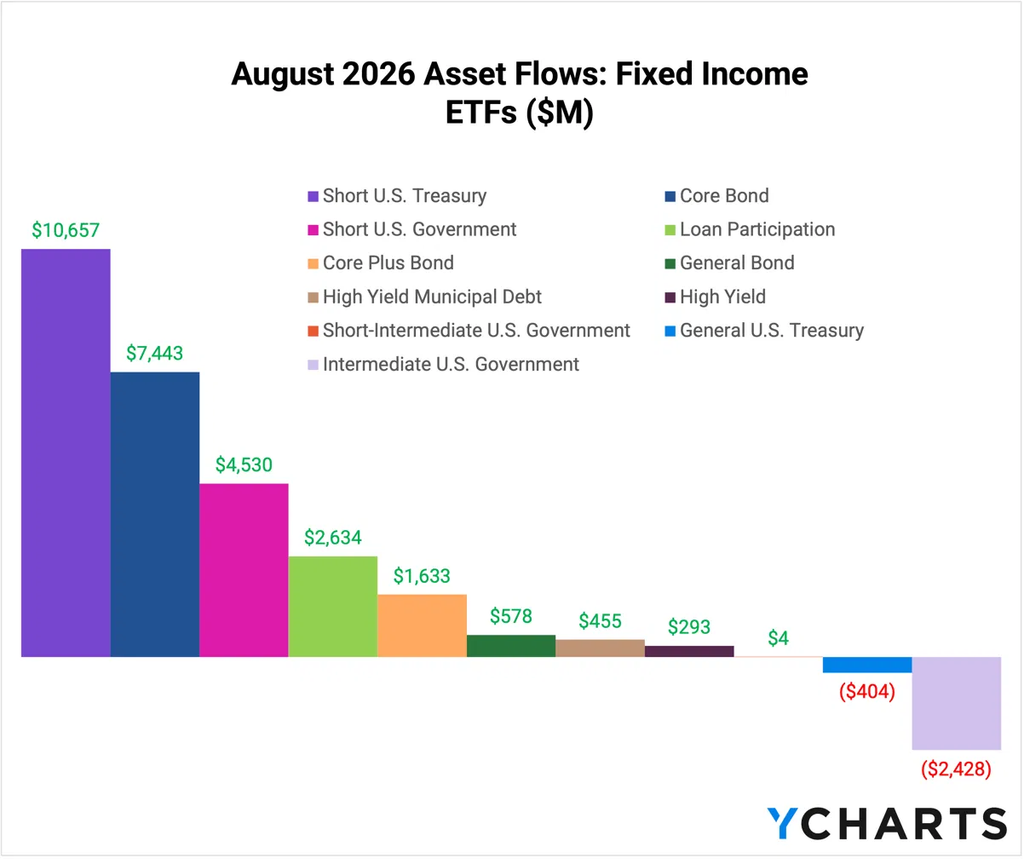
Beyond the front end, loan participation ETFs pulled in $2.6 billion in August as asset managers look to floating-rate strategies amid a less explicit Federal Reserve that appears to be the new normal.
Sign up for our free monthly Fund Flow Report to stay updated on how assets are moving in and out of these strategies:Table of Contents
Less Guidance, More Rate Volatility
Across the industry, asset managers are adapting to the idea of less forward guidance from the Fed and rate expectations that have swung sharply. Fed Chair Kevin Warsh reinforced the former at his Jackson Hole address in August, stating, “You can call it an outline…you can call it a trail map…just don’t call it forward guidance.”
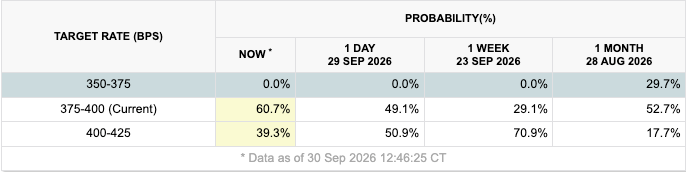
In response, managers are leaning into income that doesn’t depend on calling the next rate decision correctly, opting for floating coupons that instead reset with SOFR as policy shifts. YCharts’ latest Fund Flow Report highlights the CLO and loan participation ETFs advisors are putting money behind in 2026.
Loan Participation ETFs Leading in 2026
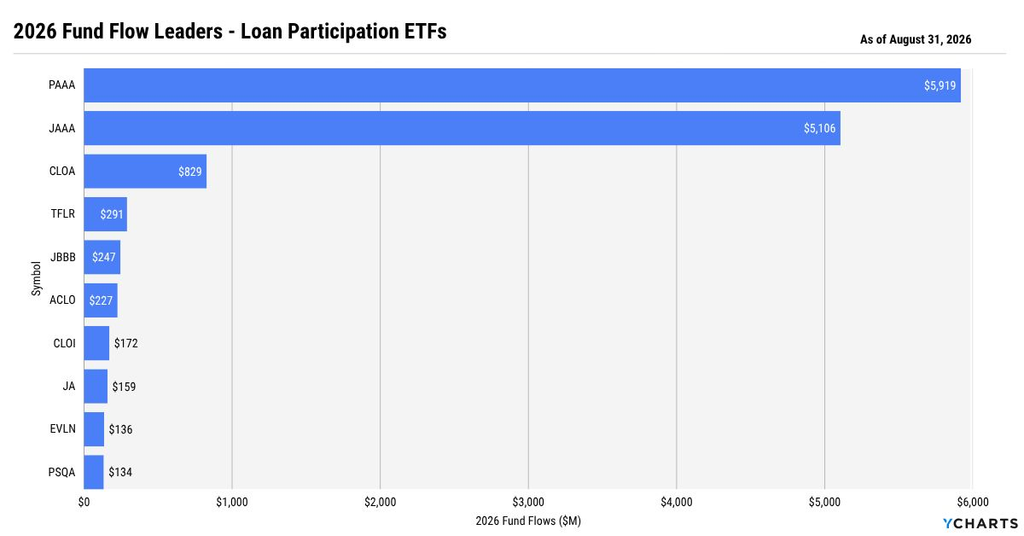
Year-to-date through August, the ten largest loan participation ETFs by inflows have collectively pulled in $13.2 billion. PGIM’s PAAA and Janus Henderson’s JAAA account for the majority of this capital, though others are growing as the category continues its momentum.
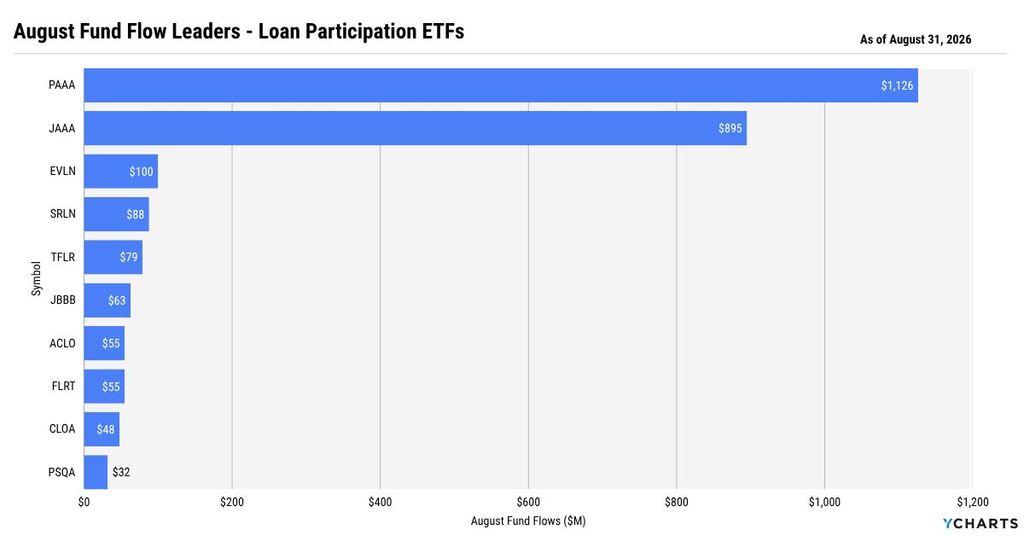
The concentration held in August, with the two accounting for roughly 77% of the category’s $2.6 billion in monthly inflows.
Yield Without the Duration
The trade-off is clearest when comparing yield against rate sensitivity within these funds. The three AAA CLO ETFs drawing the most capital year to date — PAAA, JAAA, and CLOA — offer yields roughly in line with AGG, at a fraction of its 5.75-year duration.
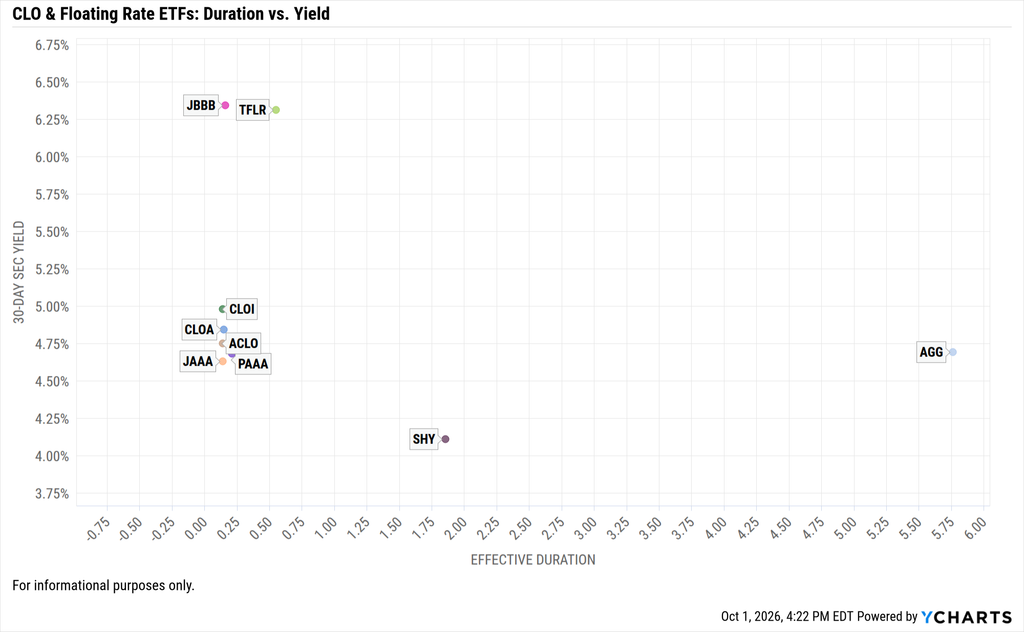
JBBB and TFLR, for those willing to take on greater credit risk, push yields above 6% while keeping duration low. SHY, a proxy for the Short U.S. Treasury category that led August flows, yields the least of the group while carrying more than nine times the duration of the aforementioned funds.
PGIM AAA CLO ETF (PAAA)
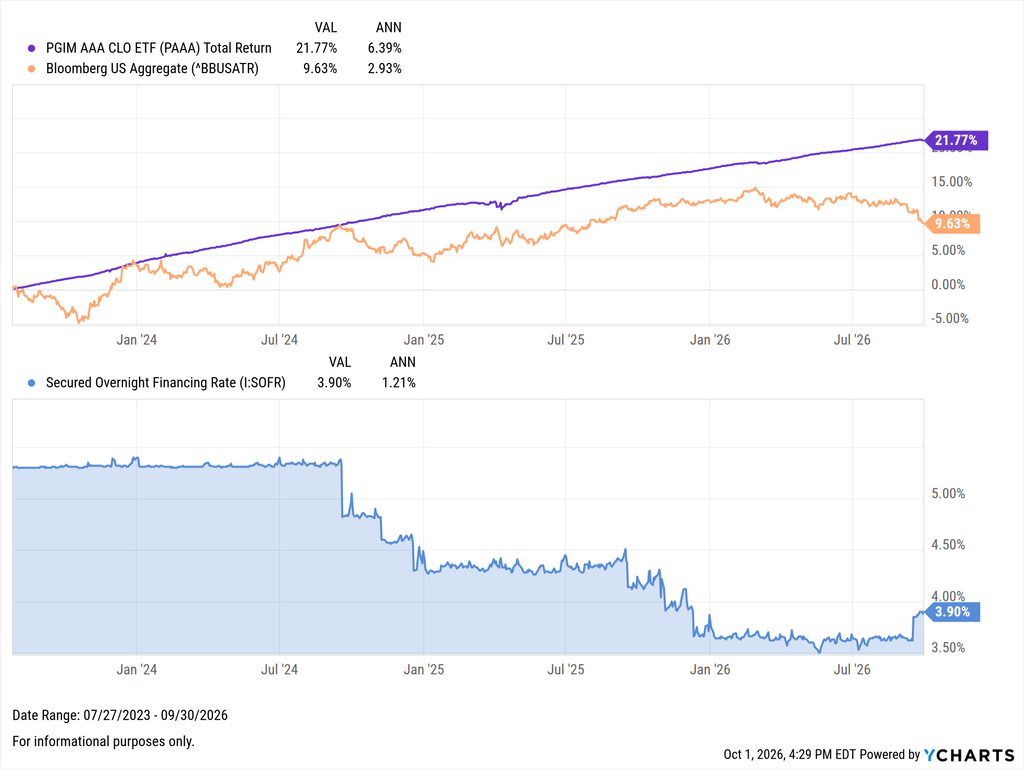
The breakout player with a category-leading $5.9 billion in inflows YTD, ahead of JAAA, which holds more than twice the AUM. PAAA has grown to $13.8 billion in AUM, more than 500 times larger than when it launched in July 2023, at which time PGIM described high-quality CLOs as a category that “represents an enormous, relatively untapped opportunity.”
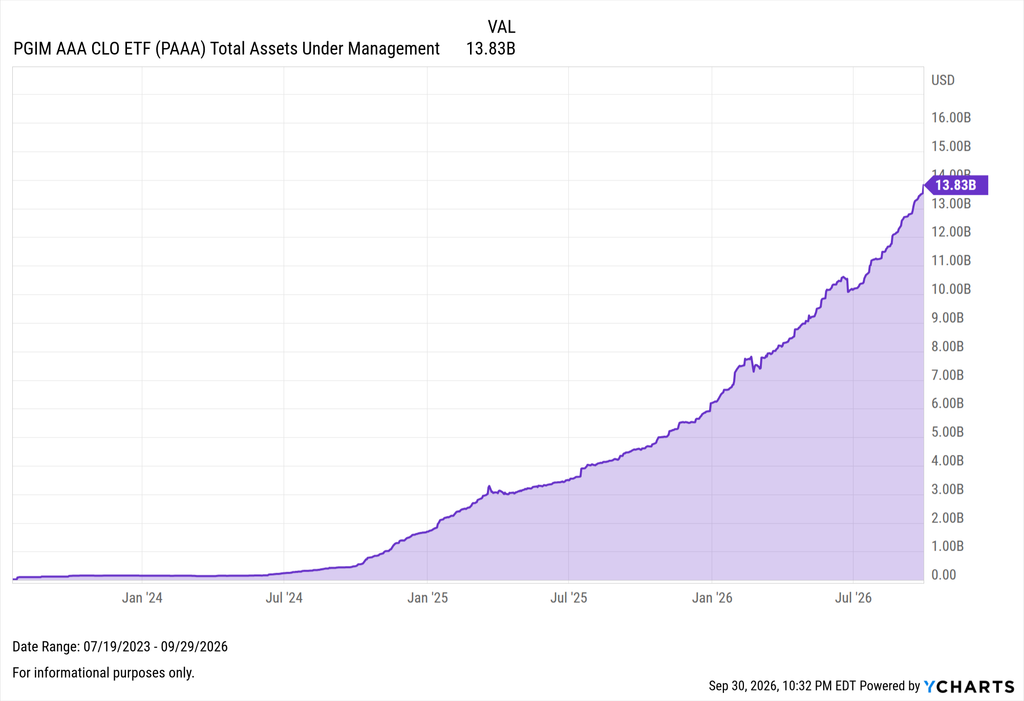
The fund concentrates in AAA-rated CLO tranches, and with an effective duration of 0.21 years and a 4.68% SEC yield, PAAA offers investors the income profile of AGG with almost none of the rate sensitivity.
Janus Henderson AAA CLO ETF (JAAA)
JAAA, one of the category’s first ETFs and the world’s largest CLO ETF by AUM, surpassed $30 billion in assets for the first time in August. Upon reaching the milestone, Janus Henderson pointed to AAA CLOs’ “potential to provide attractive income, low volatility, and diversification benefits.”
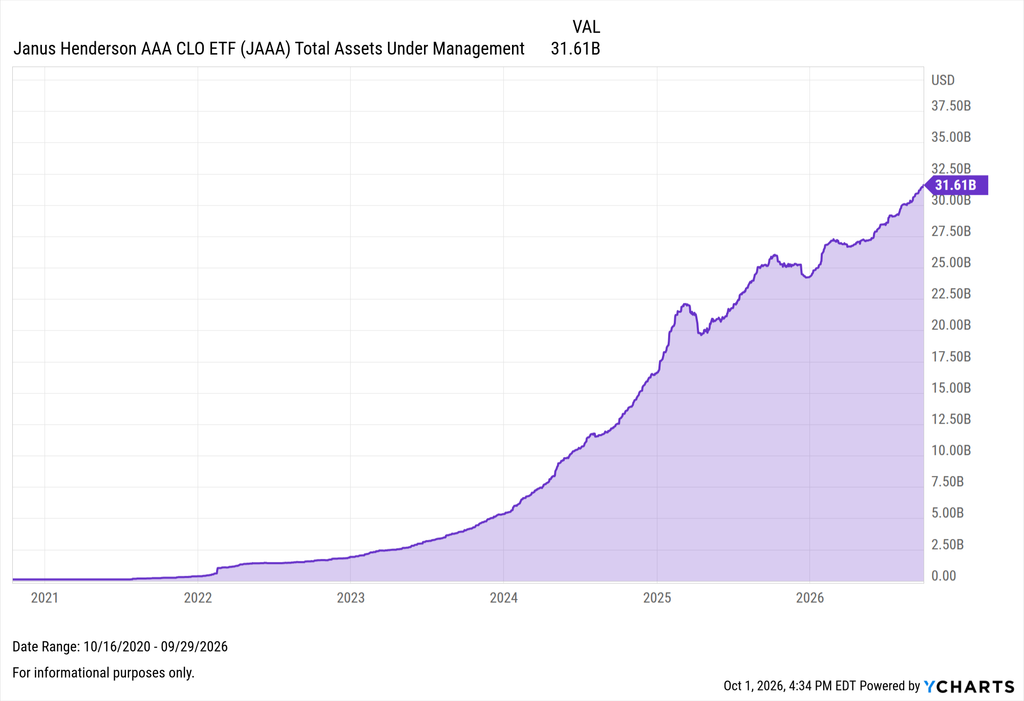
Like PAAA, JAAA concentrates in AAA-rated CLO tranches, with a slightly lower effective duration of 0.14 years and an SEC yield of 4.63%.
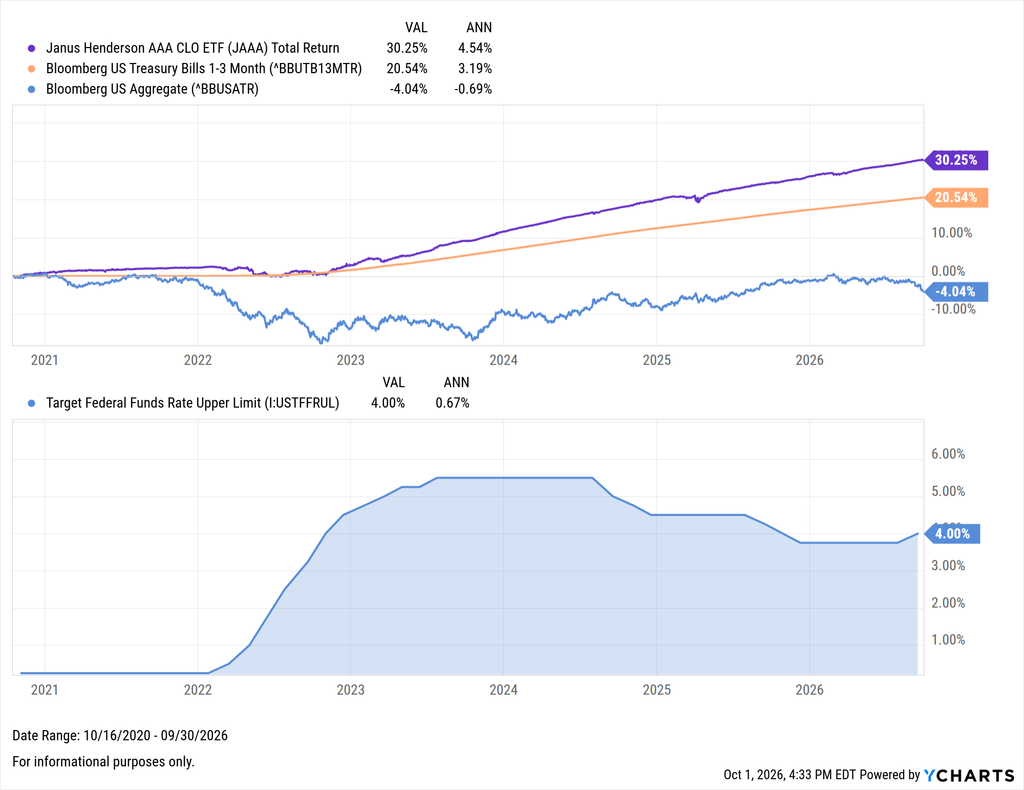
Since launching in October 2020, the fund has returned an annualized 4.55%, 136 basis points greater than 1-3 month Treasury bills. It outearned bills both when rates were 0% and as its floating coupons reset through the most aggressive hiking cycle in 40 years.
T. Rowe Price Floating Rate ETF (TFLR)
Rather than buying CLO tranches, TFLR invests at least 80% of its net assets directly in floating rate loans and debt securities, the same kind of leveraged loans CLOs pool and tranche. Owning the loans directly earns a higher 30-day SEC yield of 6.31% with a still-short effective duration of 0.55 years, but the average credit rating drops to B.
Over the past year, returns across TFLR and the largest AAA CLO ETFs have been nearly identical, though the path has looked very different for the floating rate ETF, with roughly four times as much volatility (see the scatter plot here).
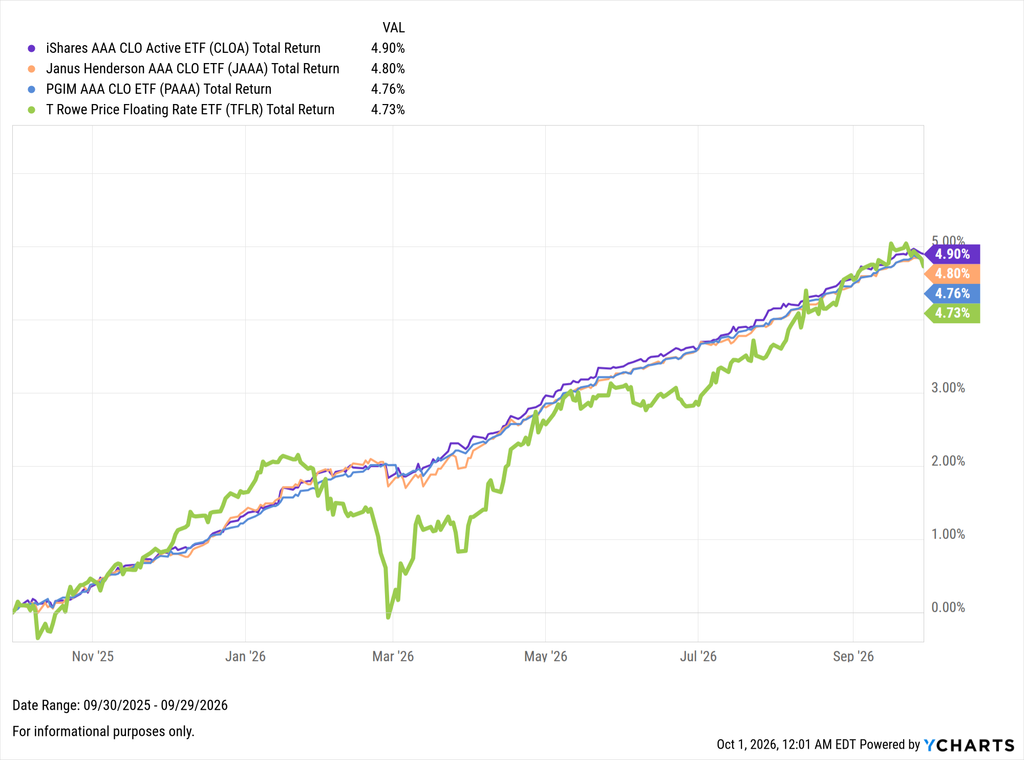
Since launching in November 2022, the ETF has grown 40-fold in AUM and attracted $291 million in net inflows year-to-date.
What the Flows Signal
With more than $2.6 billion flowing into CLO and loan participation ETFs in August, the message is clear: with less guidance from the Fed, investors are favoring income that resets with the rate environment over income that depends on predicting it.
To stay current on how advisor allocations continue to evolve, subscribe to the YCharts Fund Flow Report.
Ready to Move On From Your Investment Research and Analytics Platform?
Follow YCharts Social Media to Unlock More Content!
Next Article
What Do 7% Mortgage Rates Mean for the Housing Market?Read More →