
What Do 7% Mortgage Rates Mean for the Housing Market?
Interested in testing out YCharts for free?
Start 7-Day Free TrialThe 30-year mortgage rate is back above 7% for the first time since January of 2025, climbing sharply in September as Treasury yields rise to their highest levels in over 20 years. For most clients, purchasing a home is the single most impactful financial decision they can ever make, and mortgage rates are central to that equation.
Mortgage rates determine the overall cost of a purchase for years after closing and influence decisions for clients looking to sell or refinance. With rates once again elevated, the ramifications could extend to a housing market that had already struggled to find any sign of momentum.
Table of Contents
A Brief Window, Quickly Shut
For a brief period at the beginning of 2026, it looked as if the housing market might be breaking in the right direction, for the first time in a long time.
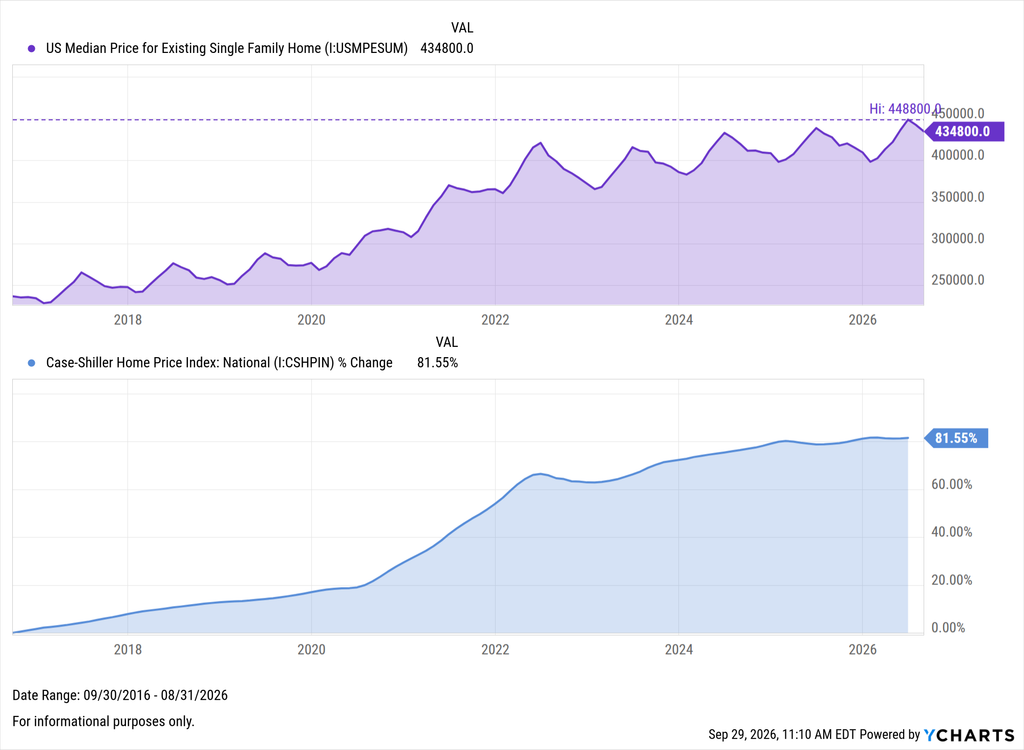
In February, the 30-year mortgage rate dipped below 6% for the first time since September 2022, while the Median Sales Price of Existing Homes fell below $400,000. Existing home sales and inventory showed promise as well.
That window didn’t remain open for long, however. Over the following months, geopolitical tensions and various macro conditions drove inflation higher, pushing the 10-year over 5% and dragging mortgage rates up with it.
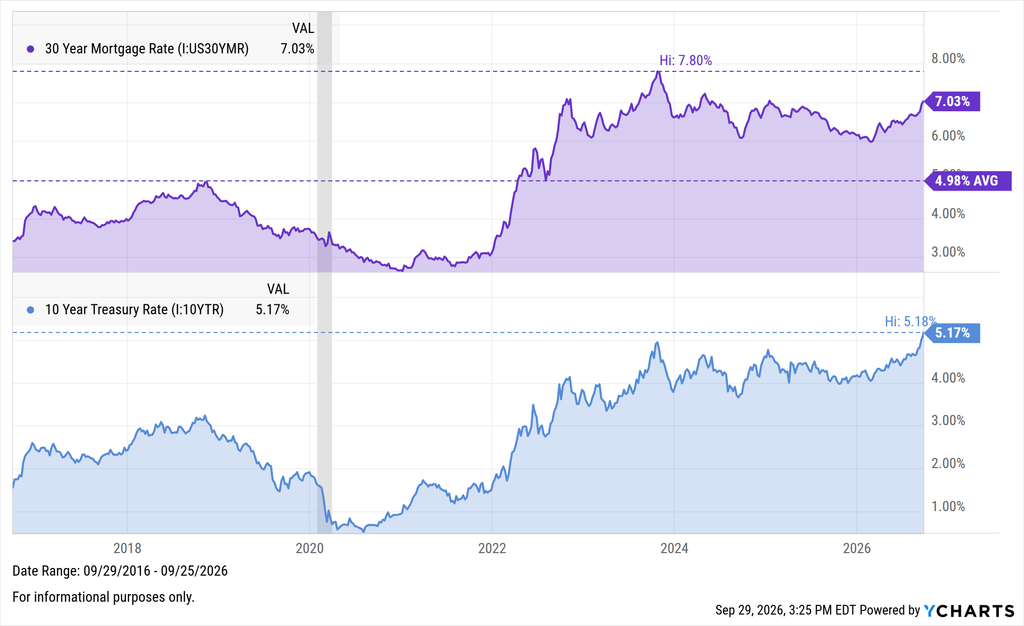
Now, with the first Fed rate hike in three years, the housing market looks to be in a familiar, difficult spot. Markets are pricing in the likelihood of an additional 50 basis points of tightening by the end of 2026, keeping pressure on the 10-year and, in turn, on borrowing costs for buyers already facing elevated prices.
No Relief in Sight
Over the past 10 years, the Case-Shiller National Home Price Index has risen 82%, and the median existing single-family home now costs $197,900 more than it did in 2016. Prospective buyers who waited through 2022 for a price correction that never materialized are not catching any breaks from current rate conditions.
Sales activity has also failed to rebound following the pandemic-driven surge, currently sitting at just 3.98 million in August. Builder confidence remains low and declining, just 2 points above the decade-low of 30 and well below the neutral threshold of 50.
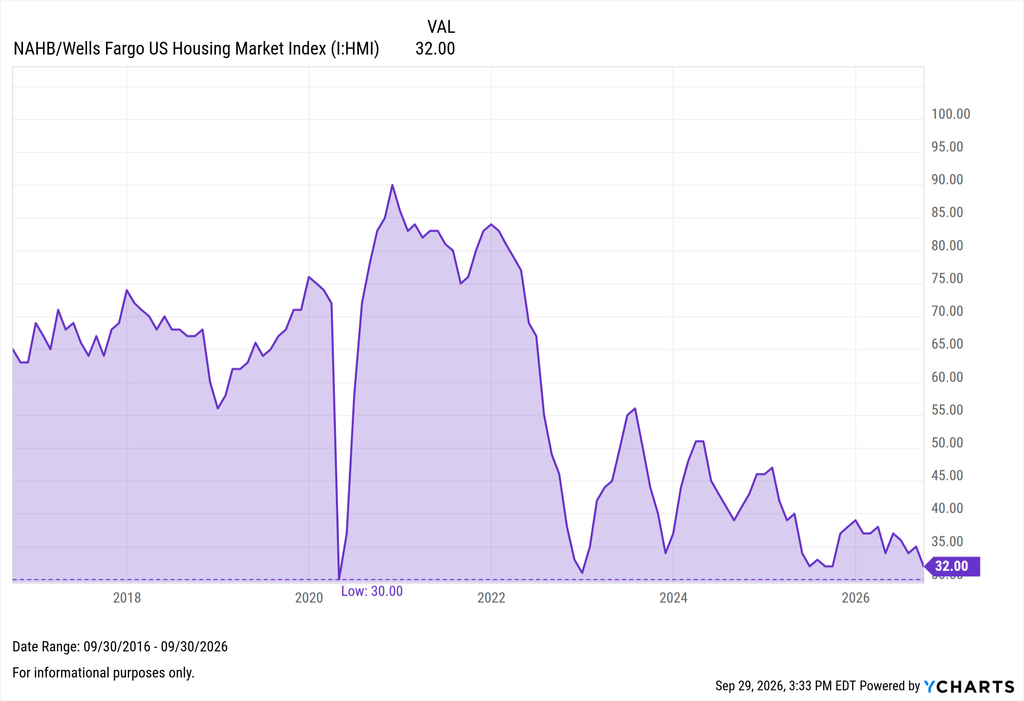
The latest HMI survey found that 38% of builders cut prices in September, while 66% reported using sales incentives to move inventory. Taken together, conditions do not suggest any immediate thawing of the frozen market that so many have been hoping for.
More Homes, Fewer Buyers
Paradoxically, one figure tells a story of surface-level stimulation. The US Existing Home Inventory has climbed 32% year to date, reaching 1.62 million units in August and representing 4.9 months of supply at the current sales pace, the highest reading in over a decade.
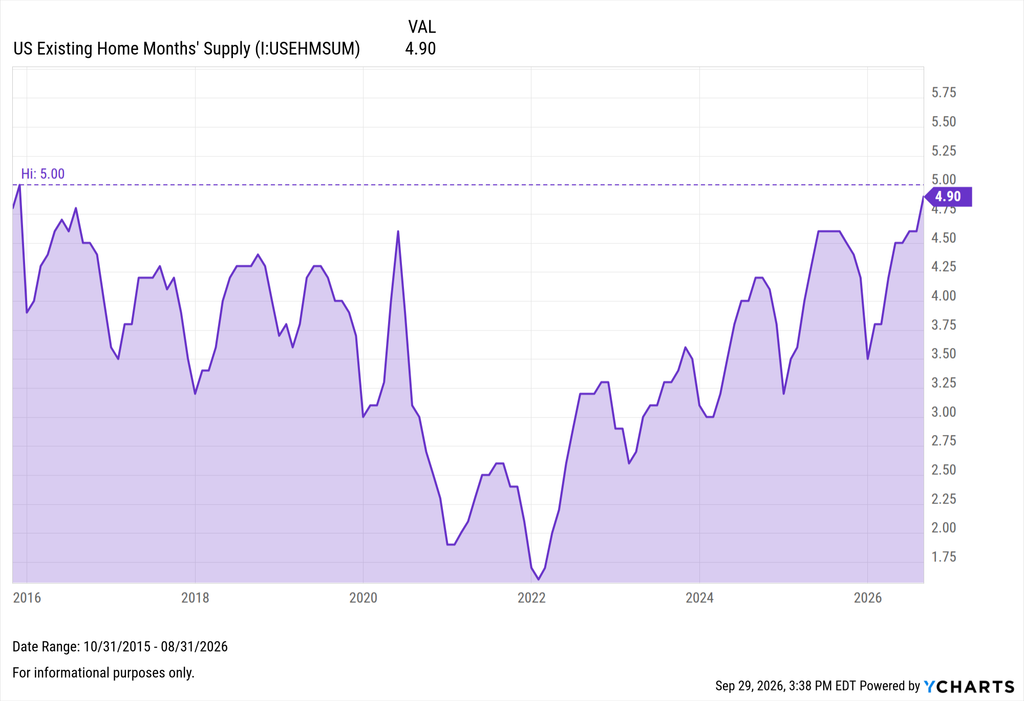
The problem, however, is that this growing inventory is not the result of a healthy market with high turnover. Houses are sitting on the market at historically high prices, and without enough buyers to step in, inventory is naturally accumulating.
Locked In for Longer
Any assessment of the housing market must account for the “lock-in effect” established during the COVID-19 pandemic rate environment. Nearly 20% of all US outstanding mortgages carry these ultralow rates of 3% or below, while half of all mortgages are at 4% or below.
The millions of homeowners who purchased or refinanced during this period have virtually no incentive to sell and take on today’s much higher rates, effectively keeping them on the sidelines until conditions meaningfully improve.
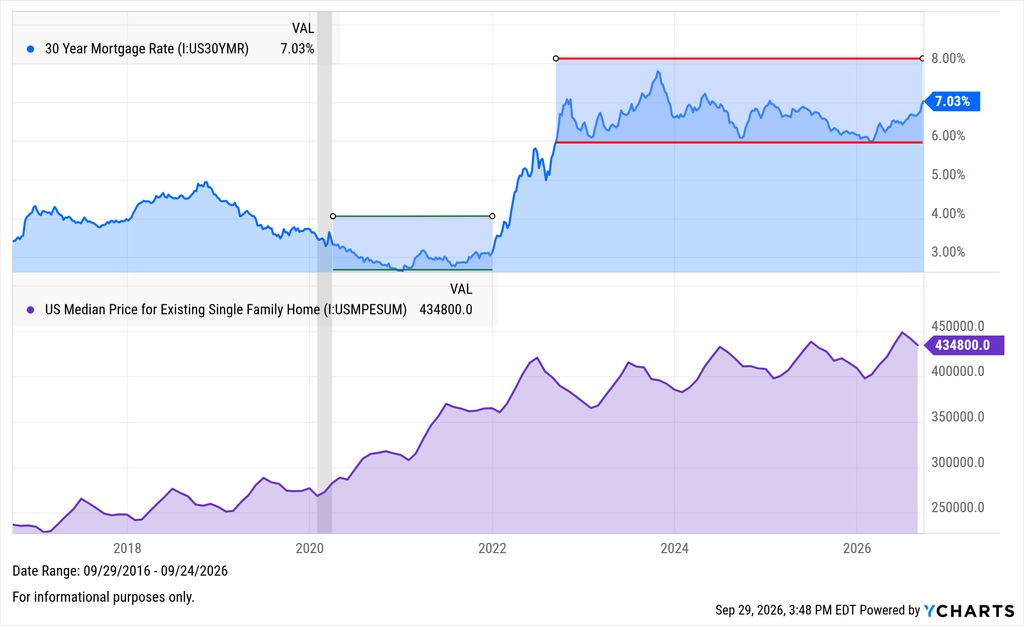
The difference between a loan taken in 2020 and one taken today hits harder when broken down by real outcomes. On the same $400,000, 30-year mortgage:
- At 2.75%, the monthly payment is $1,633
- At 7%, the monthly payment is $2,661
That is a difference of $1,028 per month, and more than $370,000 in total payments, on a loan of the exact same amount. The higher today’s rates climb, without a structural repricing of homes, the longer this stalemate is likely to continue.
What Happens Next?
The National Association of Realtors’ Housing Affordability Index sits at 104.7, meaning a median-income family earns just enough to qualify for a median-priced home, based on August’s rates in the mid-6% range. With rates now above 7%, that margin is narrowing.
No one can claim to know when mortgage rates or housing prices will come down, or how any other housing metrics will stabilize. What advisors can do is offer clients a clear read on the signals to monitor from here:
- Mortgage spreads: Narrower spreads would soften borrowing costs, while further widening would push mortgage rates higher even if the 10-year holds steady.
- Affordability metrics: A move decisively below 100 on the Housing Affordability Index would be a clear signal that housing has become more unattainable.
- Sales volumes: A rebound in existing home sales could suggest that the lock-in effect is easing and that buyers are reentering the market.
For clients weighing a purchase or sale, the most useful perspective is how the decision looks under different outcomes and the ramifications for their long-term financial plan. YCharts’ Scenarios lets advisors model various situations for clients, turning an open-ended question about rates into a visual understanding of the trade-offs.
Ready to Move On From Your Investment Research and Analytics Platform?
Follow YCharts Social Media to Unlock More Content!
Next Article
The 10 Best Performing Stocks in the Last 25 YearsRead More →