Auto-Benchmarking in Model Portfolios: Accurate Benchmarks Without the Manual Work
Putting client portfolios in context is essential, but manual benchmarking takes up valuable time for advisors, and default benchmarks are rarely specific enough to be meaningful for review. With YCharts’ Auto-Benchmarking in Portfolios, advisors can create tailored, blended benchmarks automatically built from a portfolio’s holdings, providing relevant comparisons without any manual effort.
The Problem With Existing Benchmarking
When setting up a benchmark, advisors have either had to manually build a custom benchmark by selecting indices and determining weights, or rely on a static default previously created by them or a home office.
The first approach is time-consuming and requires constant revisiting whenever allocations shift, while static set-and-forget benchmarks are often too broad to provide effective portfolio insights. Whichever method is preferred, advisors have been left to choose between suboptimal benchmarking or countless hours spent refining them.
What Auto-Benchmarking Solves
Auto-benchmarks automatically create and assign a benchmark to your portfolio based on its underlying holdings, removing the need to manually construct a benchmark for each individual portfolio.
In addition, whenever you update a portfolio’s holdings, the associated auto-benchmark will adjust accordingly so that it continues to reflect the portfolio’s current asset allocation. For advisors, this means no more time spent adjusting manual benchmarks or having to settle for ineffective ones.
Our auto-benchmark works by:
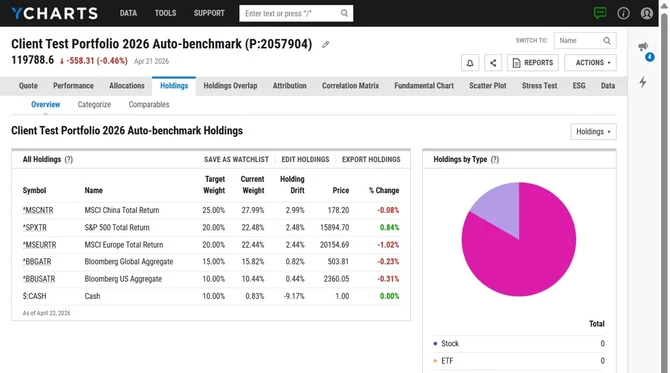
- Analyzing the portfolio’s current holdings and determining its asset allocation.
- Identifying the appropriate benchmark indices tied to those holdings using YCharts Benchmarks and ETF exposure proxies. Learn more about that mapping here.
- Building a blended benchmark portfolio by calculating a weighted average of the selected indices.
- Automatically assigns this new blended benchmark to the portfolio.
Effective Benchmarking with YCharts
Portfolio performance without context is difficult to present and even harder for clients to interpret. Benchmarks provide advisors with a meaningful reference point to support these conversations by objectively reviewing a portfolio’s performance.
This review is only effective, though, when the strategy is being evaluated against something that actually reflects a portfolio’s holdings.
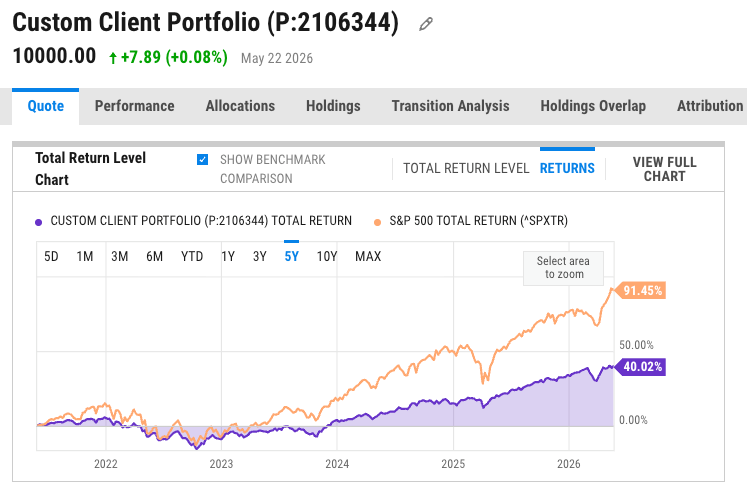
Benchmarking a diversified multi-asset portfolio against a broad equity index like the S&P 500 produces a comparison that lacks any meaningful relationship to the portfolio strategy. A portfolio with fixed income, international equity, and alternative exposure will behave differently than a pure U.S. large-cap index by design.
The gap in returns is not a representation of underperformance, it is an indication that the benchmark was never the right reference point to begin with.
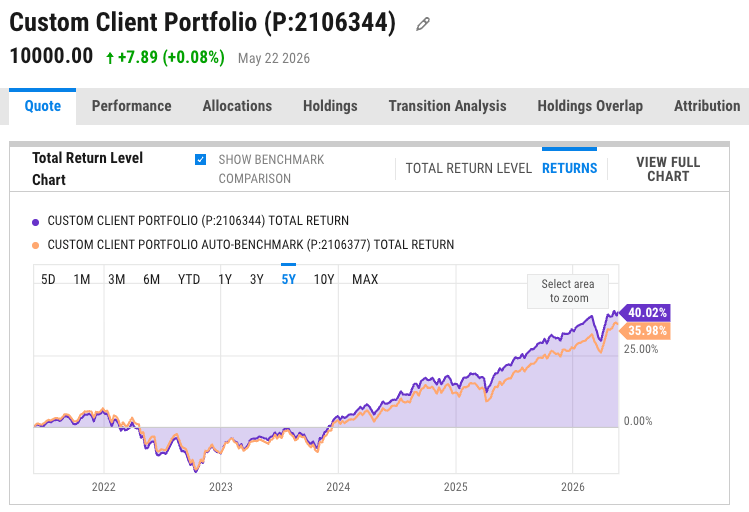
When benchmarked properly, the outcome looks entirely different. A blended auto-benchmark built from the portfolio’s actual allocation tracks closely over the same period, producing a comparison that is relevant, defensible, and useful in a client conversation.
For advisors managing multiple models, the ability to build accurate benchmarks and scale them across an entire portfolio lineup is invaluable. Auto-Benchmarking ensures every portfolio has a relevant, up-to-date benchmark that adjusts as holdings change, with no manual effort required.
Whenever you’re ready, here’s how YCharts can help you:
1. Looking to Move On From Your Investment Research and Analytics Platform?
2. Want to test out YCharts for free?
Start a no-risk 7-Day Free Trial.
Disclaimer
©2026 YCharts, Inc. All Rights Reserved. YCharts, Inc. (“YCharts”) is not registered with the U.S. Securities and Exchange Commission (or with the securities regulatory authority or body of any state or any other jurisdiction) as an investment adviser, broker-dealer or in any other capacity, and does not purport to provide investment advice or make investment recommendations. This report has been generated through application of the analytical tools and data provided through ycharts.com and is intended solely to assist you or your investment or other adviser(s) in conducting investment research. You should not construe this report as an offer to buy or sell, as a solicitation of an offer to buy or sell, or as a recommendation to buy, sell, hold or trade, any security or other financial instrument. For further information regarding your use of this report, please go to: ycharts.com/about/disclosure
Next Article
The 10 Best Performing Stocks in the Last 25 YearsRead More →