Best Performing Equity ETFs of 2024: Total & Risk-Adjusted Returns

For the second consecutive year, the S&P 500 delivered returns of over 20%, finishing 2024 with a 25% gain. With the broader equity market delivering such strong performance, it’s no surprise that ETFs—highly accessible investment vehicles offering a wide range of strategies—achieved a record-breaking $1 trillion in inflows in 2024.
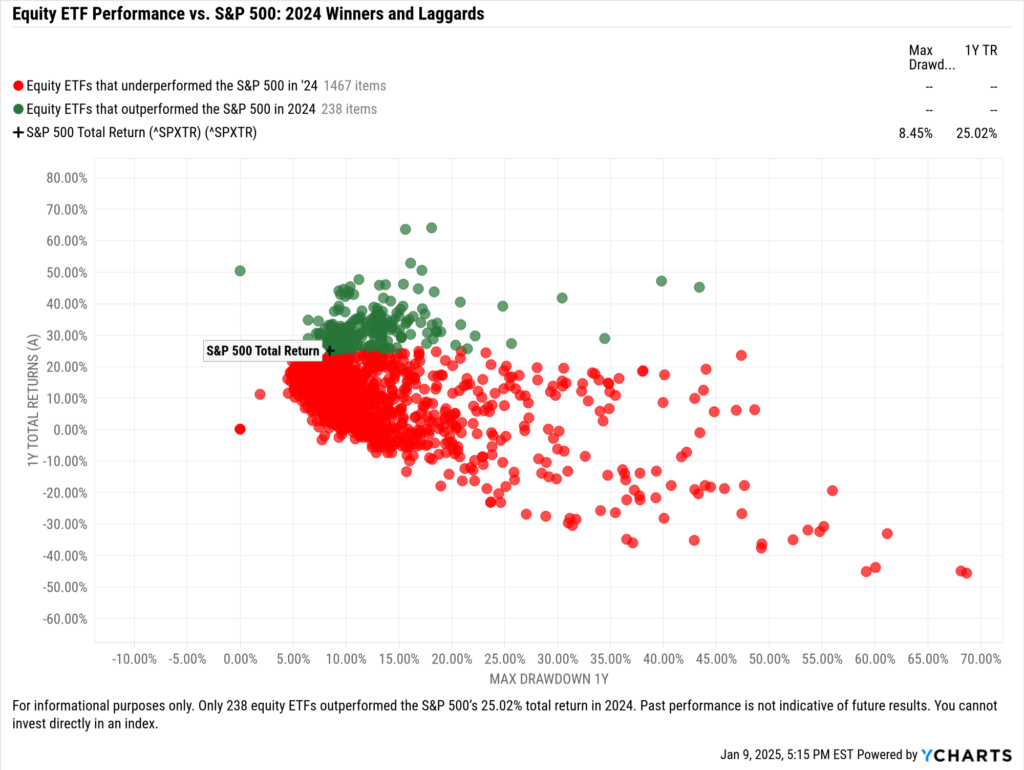
Despite the broader equity market performing in this manner, of the U.S.-domiciled equity ETFs with at least a 1-year track record (excluding S&P 500, leveraged, inverse, and options-based strategies), only 238, or 13.8%, managed to outperform the S&P 500.

While some strategies underperformed the S&P 500—either by design (prospectus objective) or due to lackluster results—this doesn’t necessarily mean they were poor investment choices. Many delivered solid returns relative to their peer group benchmarks.
Below, we examined the best-performing equity ETFs of 2024 based on total returns in those peer groups. We also evaluated their risk-adjusted returns using the Sharpe ratio, offering financial advisors a clearer view of how these funds balanced risk and reward to achieve their performance.
If you’re intrigued by this data and these visuals but are more interested in fixed-income strategies, we conducted the same exercise for fixed-income ETFs here.
Best Performing Equity ETFs of 2024
The Roundhill Magnificent Seven ETF (MAGS) emerged as the top performer of 2024, delivering a total return of 64%. The Global X MSCI Argentina ETF (ARGT) was close behind, achieving a 63.5% return, while the AXS Esoterica NextG Economy ETF (WUGI) posted a 52.7% return. Review and modify the full top ten screen here.

Download Visual | View & Modify in YCharts
For financial advisors focused on funds that can deliver substantial returns while keeping risk in check, MAGS not only delivered the highest total return but also demonstrated exceptional risk-adjusted performance with a Sharpe ratio of 2.94 despite having the second-highest maximum drawdown of the group at 18.1%.
The American Century Focused Dynamic Growth ETF (FDG) offered a strong balance of risk and return, achieving a Sharpe ratio of 2.57, a total return of 45.9%, and a lower maximum drawdown of 13.8%. Similarly, the Invesco S&P 500 Momentum ETF (SPMO) impressed with a Sharpe ratio of 2.45, a total return of 45.8%, and a drawdown of just 13.2%.

Download Visual | View & Modify in YCharts
Best Performing US Equity ETFs of 2024
The Alger 35 ETF (ATFV) emerged as the best-performing US equity ETF of 2024, with a total return of 46.2%. Following closely, FDG achieved a 45.9% return, while SPMO recorded a strong 45.8% gain. Review and modify the full top ten screen here.

Download Visual | View & Modify in YCharts
While the risk-adjusted performance of SPMO and FDG was highlighted earlier, ATFV delivered a Sharpe ratio of 2.11, complementing its broad asset class-leading total return. ATFV achieved these strong results despite recording the second-highest maximum drawdown among the top performers at 15.43%.
The SEI Enhanced US Large Cap Momentum Factor ETF (SEIM) stood out with the third-highest Sharpe ratio in this group at 2.39. This was paired with a solid total return of 39.1% and the lowest maximum drawdown (9.3%) among this group’s top performers.

Download Visual | View & Modify in YCharts
Best Performing Active Equity ETFs of 2024
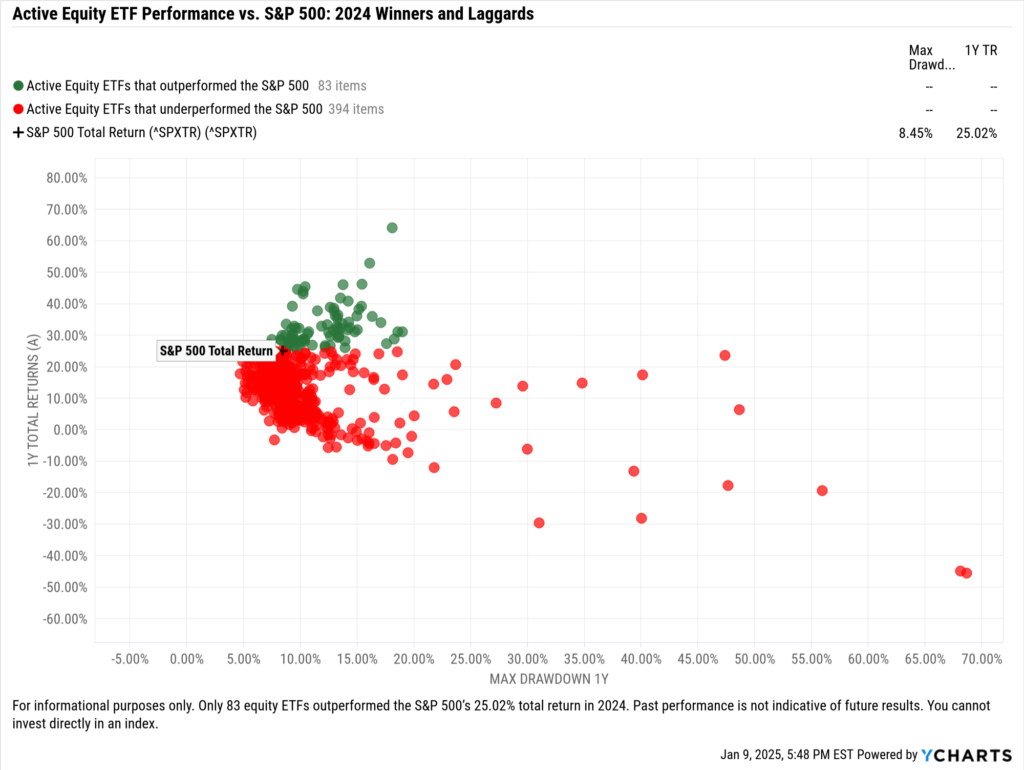
Active ETFs gained significant popularity in 2024, becoming one of the year’s biggest stories. Among the 490 active U.S.-domiciled equity ETFs with at least a 1-year track record (excluding leveraged, inverse, and options-based approaches to focus on stock-picking strategies), only 83, or 16.9%, outperformed the S&P 500’s 25.02% total return.

The top-performing active equity ETFs of 2024 were MAGS, WUGI, and ATFV, delivering returns of 64%, 52.7%, and 46.2%, respectively. Review and modify the full top ten screen here.

Download Visual | View & Modify in YCharts
From a risk-adjusted perspective, GABF and MAGS achieved Sharpe ratios of 2.98 and 2.94, respectively, as covered in earlier sections. The USCF Midstream Energy Income Fund (UMI) also stood out among active ETFs, delivering a Sharpe ratio of 2.83 alongside its 43% total return.

Download Visual | View & Modify in YCharts
Best Performing Sector Equity ETFs of 2024
MAGS led all sector equity ETFs, delivering a 64% total return in 2024. WUGI followed with a 52.7% gain, and rounding out the top three, the Defiance Quantum ETF (QTUM) achieved a 50.5% return. Review and modify the full top ten screen here.

Download Visual | View & Modify in YCharts
While MAGS’ risk-adjusted performance was already highlighted, other sector-focused funds also delivered impressive results. The Gabelli Financial Services Opportunities ETF (GABF) posted a Sharpe ratio of 2.98, alongside a total return of 44.5% and a maximum drawdown of 9.8%.
The Pacer American Energy Independence ETF (USAI) achieved a Sharpe ratio of 2.87—the second highest in the group—paired with a total return of 44% and a maximum drawdown of just 9.3%. The VanEck Video Gaming and eSports ETF (ESPO) posted a Sharpe ratio of 2.36, a total return of 47.6%, and a drawdown of 11.2%.

Download Visual | View & Modify in YCharts
Best Performing International Equity ETFs of 2024
ARGT emerged as the top-performing international equity ETF in 2024, delivering a total return of 63.5%. Following ARGT, the iShares MSCI Russia ETF (ERUS) posted a 50.3% return. In third place, the iShares MSCI Israel ETF (EIS) achieved a 34.5% return. Review and modify the full top ten screen here.

Download Visual | View & Modify in YCharts
The Rayliant Quantitative Developed Market Equity ETF (RAYD) led the group with the strongest risk-adjusted performance, achieving a Sharpe ratio of 2.39. This was paired with a total return of 28.6% and a maximum drawdown of just 8.2%.
ARGT also stood out with a Sharpe ratio of 2.36 alongside its total return of 63.5%. Additionally, the iShares Global 100 ETF (IOO) produced a Sharpe ratio of 1.93, with a 26.5% return and a drawdown of 11.1%.

Download Visual | View & Modify in YCharts
Best Performing Growth ETFs of 2024
The best-performing growth ETFs of 2024, spanning various market cap focuses, were ATFV, FDG, and the SoFi Social 50 ETF (SFYF), delivering returns of 46.2%, 45.9%, and 44.6%, respectively. Review and modify the full top ten screen here. You can also view the list with an exclusive look at large-, mid-, small-, and multi-cap strategies.*

Download Visual | View & Modify in YCharts
As highlighted earlier, from a risk-adjusted perspective, FDG achieved a Sharpe ratio of 2.56. The Gabelli Growth Innovators ETF (GGRW) followed with a Sharpe ratio of 2.23, paired with a 41.8% total return and a 13.5% maximum drawdown in 2024. The Natixis Loomis Sayles Focused Growth ETF (LSGR) delivered the third-highest Sharpe ratio among growth ETFs at 2.18, complemented by a 38.5% total return and a 13% maximum drawdown.

Download Visual | View & Modify in YCharts
Best Performing Core ETFs of 2024
The top-performing core equity ETFs of 2024, spanning various market cap focuses, were SPMO, the Adaptiv Select ETF (ADPV), and SEIM, with returns of 45.8%, 43.9%, and 39.1%, respectively. Review and modify the full top ten screen here. You can also view the list with an exclusive look at large-, mid-, small-, and multi-cap strategies.*

Download Visual | View & Modify in YCharts
From a risk-adjusted perspective, the iShares S&P 100 ETF (OEF) delivered the highest Sharpe ratio among core ETFs at 2.49, paired with a 30.7% total return and a 9.7% maximum drawdown. As highlighted earlier, SPMO and SEIM followed closely, with Sharpe ratios of 2.45 and 2.39, respectively.

Download Visual | View & Modify in YCharts
Best Performing Value ETFs of 2024
The best-performing value ETFs of 2024, spanning various market cap focuses, were the WHITEWOLF Publicly Listed Private Equity ETF (LBO), the Vesper US Large Cap Short-Term Reversal Strategy (UTRN), and the Fidelity Fundamental Large Cap Core ETF (FFLC), delivering returns of 30.9%, 28.8%, and 27.9%, respectively. Review and modify the full top ten screen here. You can also view the list with an exclusive look at large-, mid-, small-, and multi-cap strategies.*

Download Visual | View & Modify in YCharts
From a risk-adjusted perspective, the ETC 6 Meridian Mega Cap Equity ETF (SIXA) delivered the highest Sharpe ratio among value ETFs at 2.35, complemented by a 22.7% total return and a 5.4% maximum drawdown. LBO followed closely with a Sharpe ratio of 2.31, a peer group-leading total return of 30.9%, and a 10.7% maximum drawdown. Rounding out the top three, UTRN posted a Sharpe ratio of 2.27, alongside a 28.8% total return and a 6.5% maximum drawdown.

Download Visual | View & Modify in YCharts
As 2024 proved to be another standout year for equity markets, this analysis offered insights into the ETFs that produced stellar total and risk-adjusted returns across various peer groups. If you are interested in seeing if there were significant inflows into these ETFs or other strategies, subscribe to our fund flow report here.
Whenever you’re ready, there are three ways YCharts can help you:
Have questions about how YCharts can help you grow AUM and prepare for meetings?
Email us at hello@ycharts.com or call (866) 965-7552. You’ll get a response from one of our Chicago-based team members.
Unlock access to our Fund Flows Report and Visual Deck by becoming a client.
Dive into YCharts with a no-obligation 7-Day Free Trial now.
Sign up for a copy of our Fund Flows Report and Visual Deck:
Disclaimer
©2024 YCharts, Inc. All Rights Reserved. YCharts, Inc. (“YCharts”) is not registered with the U.S. Securities and Exchange Commission (or with the securities regulatory authority or body of any state or any other jurisdiction) as an investment adviser, broker-dealer or in any other capacity, and does not purport to provide investment advice or make investment recommendations. This report has been generated through application of the analytical tools and data provided through ycharts.com and is intended solely to assist you or your investment or other adviser(s) in conducting investment research. You should not construe this report as an offer to buy or sell, as a solicitation of an offer to buy or sell, or as a recommendation to buy, sell, hold or trade, any security or other financial instrument. For further information regarding your use of this report, please go to: ycharts.com/about/disclosure
Next Article
YCharts for Asset Management: Boosting Fund Sales and Strengthening Advisor RelationshipsRead More →
