Breaking Down the January 2025 CPI Report: Inflation Trends & Investment Implications

Introduction: Why the January 2025 CPI Report Matters
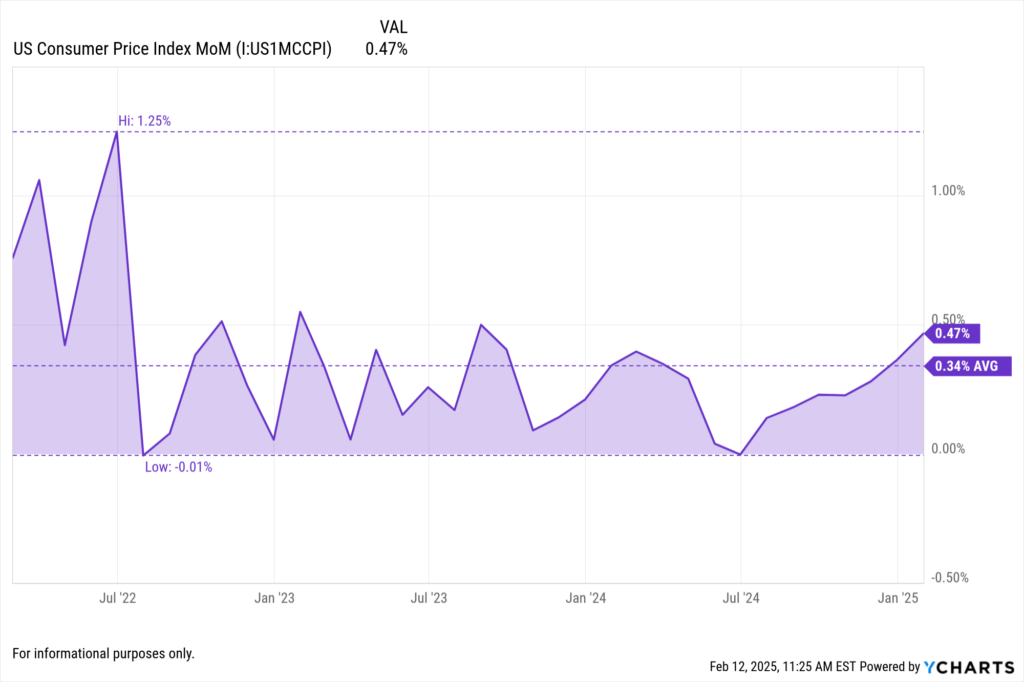
The January 2025 Consumer Price Index (CPI) report, released on February 12, 2025, presented inflation figures that surpassed market expectations. With a 0.5% month-over-month increase and a 3.0% annual rise, the report signals that inflation remains a key concern for investors, asset managers, and institutions.
These figures not only affect Federal Reserve policy decisions but also shape asset allocation strategies, bond market expectations, and equity sector performance. In this post, we’ll break down the latest CPI trends and discuss how advisors and asset managers can adjust portfolios accordingly using YCharts’ powerful data tools.
January 2025 CPI Report: Key Takeaways
CPI Surprises to the Upside
- Monthly Inflation: CPI increased 0.5% in January, exceeding the 0.3% consensus forecast.
- Annual Inflation: Up 3.0% YoY, compared to 2.9% in December 2024.
- Core CPI (Excluding Food & Energy): Increased 0.4% MoM, pushing the annual rate to 3.3%.

Inflation Drivers: What’s Fueling Price Increases?
Certain sectors contributed disproportionately to the rise in inflation:
- Housing & Shelter Costs: Up 0.6% MoM, continuing as the dominant inflationary force.
- Energy Prices: Increased 1.2% MoM, driven by higher crude oil and natural gas prices.
- Services Inflation: Up 0.5%, indicating price stickiness in non-goods sectors.
- New Import Tariffs: A 10% tariff on Chinese goods enacted this month may have caused businesses to front-load price increases.
Fed Policy Implications: What’s Next for Interest Rates?
The Federal Reserve has emphasized a data-dependent approach to rate cuts, but this CPI print suggests that the Fed may remain hawkish for longer. Fed Chair Jerome Powell has reiterated that inflation must return sustainably to 2% before considering any policy easing.
- Market Expectations: Bond markets initially priced in a rate cut by June 2025, but this CPI report reduces the probability of early easing.
- 10-Year Treasury Yields: Increased 10 bps to 4.61%, reflecting shifting rate expectations.
- Equities Reaction: The S&P 500 and Nasdaq declined 1.1% and 1.2%, respectively, as higher inflation could weigh on corporate margins.
Investment Implications for Advisors & Asset Managers
1. Inflation Hedges: Which Assets Benefit?
With inflation persisting, certain asset classes tend to outperform:
- Commodities: Gold, energy stocks, and TIPS (Treasury Inflation-Protected Securities).
- Real Assets: REITs and infrastructure investments historically serve as inflation hedges.
- Dividend-Paying Stocks: Defensive sectors like utilities and consumer staples.
2. Fixed Income Strategy: What’s the Outlook?
- Short-duration bonds remain attractive in a higher-for-longer rate environment.
- TIPS and floating-rate securities may help mitigate inflation risk.
- High-yield corporate bonds may face pressure due to rising borrowing costs.
3. Equity Market Rotation: What to Watch?
- Cyclical sectors (Financials, Industrials, Energy) tend to perform well in moderate inflationary periods.
- Growth stocks (Technology, Consumer Discretionary) may face headwinds from higher rates.
- Companies with strong pricing power (e.g., health care and luxury brands) may navigate inflationary pressures better.
How YCharts Can Help: Measuring Inflation Trends & Investment Impact
Advisors and asset managers need real-time, data-driven insights to adjust portfolios in response to inflation. YCharts offers powerful tools to track, analyze, and visualize CPI trends, interest rates, and asset performance.
Track Inflation & Macro Trends
- Use the YCharts Economic Indicators feature to monitor CPI, Core CPI, and PCE (Personal Consumption Expenditures).
- Compare inflation data against key macroeconomic indicators like GDP growth, employment reports, and consumer sentiment.
Analyze Sector & Asset Class Performance
- Utilize YCharts Fundamental Charts to compare sector performance before, during, and after inflation spikes.
- Compare real vs. nominal returns for stocks, bonds, and alternative assets.
- Identify inflation-resistant sectors using performance heatmaps.
Optimize Fixed Income Allocations
- Evaluate Treasury yield curve movements to determine optimal bond duration.
- Screen for inflation-protected securities (TIPS) and high-yield corporate bonds.
- Use scenario analysis tools to assess rate sensitivity of fixed income portfolios.
Build Data-Driven Client Reports
- Generate custom reports that visually demonstrate inflation’s impact on portfolios.
- Provide historical inflation-adjusted performance comparisons to guide client conversations.
- Use Holdings Overlap Tools to identify unintended portfolio inflation exposure.
Conclusion: Preparing for Inflation’s Next Move
The January 2025 CPI report reinforces the need for advisors, asset managers, and institutions to stay ahead of inflation risks. While inflation has moderated from its 2022 highs, persistent price pressures indicate a longer road ahead before the Fed considers rate cuts.
By leveraging YCharts’ analytical tools, investors can make data-backed decisions to navigate inflation’s impact, optimize portfolios, and ensure clients are positioned for long-term success.
Whenever you’re ready, there are 3 ways YCharts can help you:
1. Looking for a tool to help you better communicate market events?
Send us an email at hello@ycharts.com or call (866) 965-7552. You’ll be directly in touch with one of our Chicago-based team members.
2. Want to test out YCharts for free?
Start a no-risk 7-Day Free Trial.
3. Download a copy of the Monthly Market Wrap slide deck:
Disclaimer
©2025 YCharts, Inc. All Rights Reserved. YCharts, Inc. (“YCharts”) is not registered with the U.S. Securities and Exchange Commission (or with the securities regulatory authority or body of any state or any other jurisdiction) as an investment adviser, broker-dealer or in any other capacity, and does not purport to provide investment advice or make investment recommendations. This report has been generated through application of the analytical tools and data provided through ycharts.com and is intended solely to assist you or your investment or other adviser(s) in conducting investment research. You should not construe this report as an offer to buy or sell, as a solicitation of an offer to buy or sell, or as a recommendation to buy, sell, hold or trade, any security or other financial instrument. For further information regarding your use of this report, please go to: ycharts.com/about/disclosure
Next Article
Monthly Market Wrap: January 2025Read More →
