Can the S&P 500’s CAPE Ratio Predict a Market Crash?
The S&P 500 Shiller CAPE Ratio, also known as the Cyclically Adjusted Price-Earnings Ratio, measures the S&P 500’s current price compared to the 10-year moving average of companies’ inflation-adjusted earnings. Invented by economist Robert Shiller, the metric is popular for understanding long-term stock market valuations. A higher CAPE ratio could signal lower returns in the future whereas a lower CAPE ratio could signal higher returns, as the ratio reverts back to its mean.
“The stock market is not the economy,” but worries of a recession have been weighing heavily on investors’ minds. So what is the CAPE ratio saying after the S&P’s hot start in 2023?
In our white paper, Which Leading Indicators Best Predict Market Declines?, we analyzed the S&P 500 Shiller CAPE Ratio and five other leading indicators which are commonly used to predict market crashes. Over 21 major market declines since 1950, each indicator’s accuracy and consistency were varied.
Download the free White Paper to see our full findings:
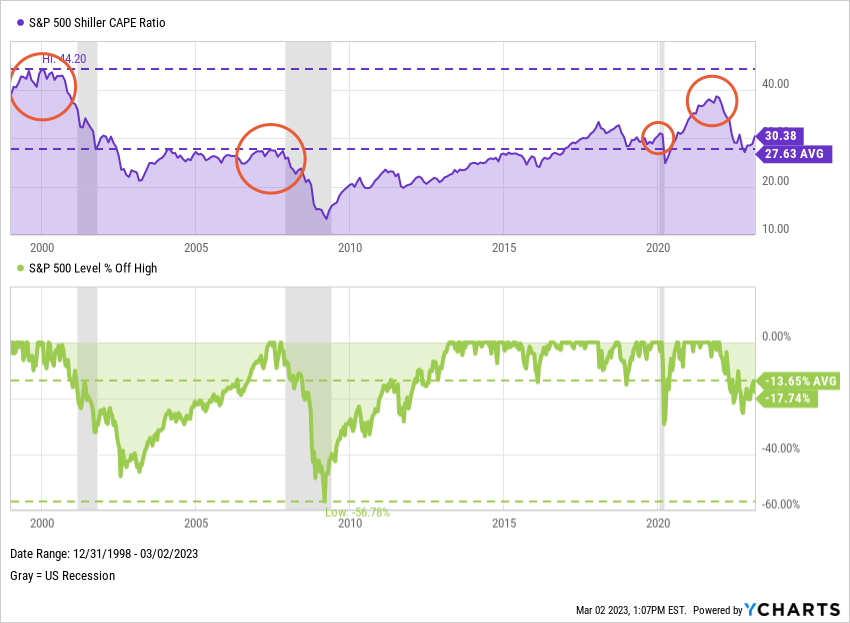
Can the S&P 500 CAPE Ratio help predict a market crash?
The S&P 500 Shiller CAPE Ratio has a strong track record of predicting market declines. Out of 21 major market declines (defined as a 10% or greater drawdown in our white paper) since 1950, the CAPE Ratio has provided warnings for 10 of them by breaching its long-term average.
The chart below shows that relative peaks in the CAPE Ratio coincide with drawdowns for the S&P 500. Knowing the ratio is directly affected by declining equity prices, the question becomes: are we seeing a relative peak in valuations to start 2023?
Download Visual | Modify in YCharts
Our white paper also examines leading indicators like Tobin’s Q, year-over-year earnings growth, the 10-2 Year and 10 Year-3 Month Yield Spreads, the “Buffett Indicator”, and a simple PE Ratio for the S&P 500. Download the free resource to see their effectiveness for signaling major market declines.
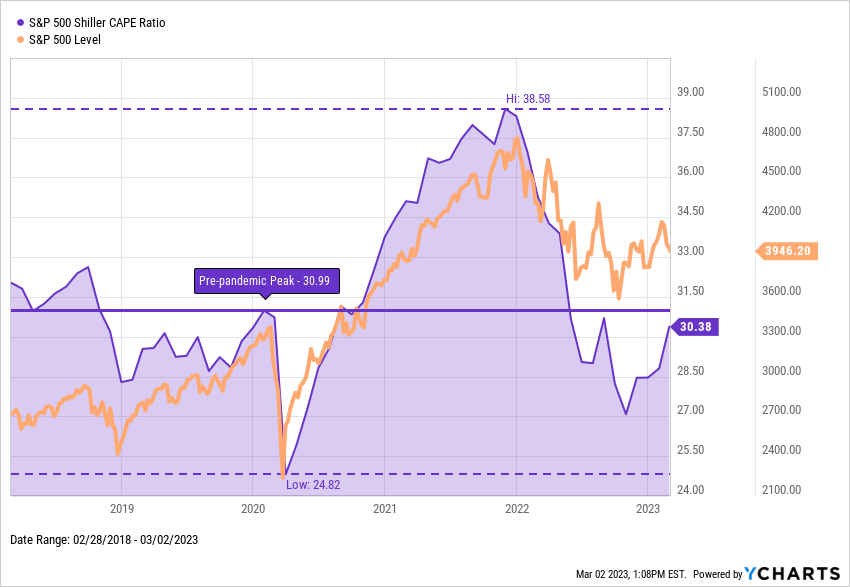
Stocks are relatively expensive in 2023, depending on your lookback
The CAPE Ratio reached a relative peak of 30.99 just before the pandemic selloff, then climbed to 38.58, its second-highest value ever, near the end of 2021. With stocks rallying to start 2023 the CAPE has climbed to around 30.38, meaning prices for stocks in the S&P 500 are nearly par with their February 2020 levels.
That might give investors confidence since valuations have been much higher in recent memory, but interpreting the CAPE’s relative level is not a straightforward exercise—the indicator is still much higher than its long-term historical average.
Download Visual | Modify in YCharts
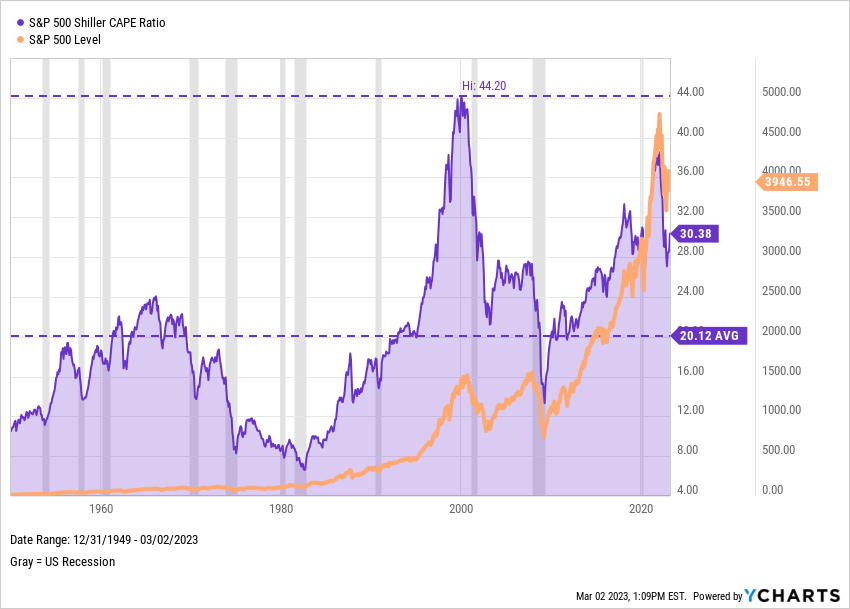
A longer-term lookback shows the degree to which valuations have risen over recent years:
Download Visual | Modify in YCharts
Download the free White Paper to see our full findings:
Connect with YCharts
To get in touch, contact YCharts via email at hello@ycharts.com or by phone at (866) 965-7552
Interested in adding YCharts to your technology stack? Sign up for a 7-Day Free Trial.
Disclaimer
©2023 YCharts, Inc. All Rights Reserved. YCharts, Inc. (“YCharts”) is not registered with the U.S. Securities and Exchange Commission (or with the securities regulatory authority or body of any state or any other jurisdiction) as an investment adviser, broker-dealer, or in any other capacity, and does not purport to provide investment advice or make investment recommendations. This report has been generated through application of the analytical tools and data provided through ycharts.com and is intended solely to assist you or your investment or other adviser(s) in conducting investment research. You should not construe this report as an offer to buy or sell, as a solicitation of an offer to buy or sell, or as a recommendation to buy, sell, hold or trade, any security or other financial instrument. For further information regarding your use of this report, please go to: ycharts.com/about/disclosure