Monthly Market Wrap: February 2023
Welcome back to the Monthly Market Wrap from YCharts, where we break down the most important trends for advisors and their clients in this monthly market review. As always, feel free to download and share any visuals with clients and colleagues, or on social media.
Speaking of visuals: be sure to download our free Monthly Market Wrap slide deck, containing all charts featured in the Market Wrap + more.
Get the Monthly Market Wrap slide deck sent straight to your inbox. Download Here:February 2023 Market Summary
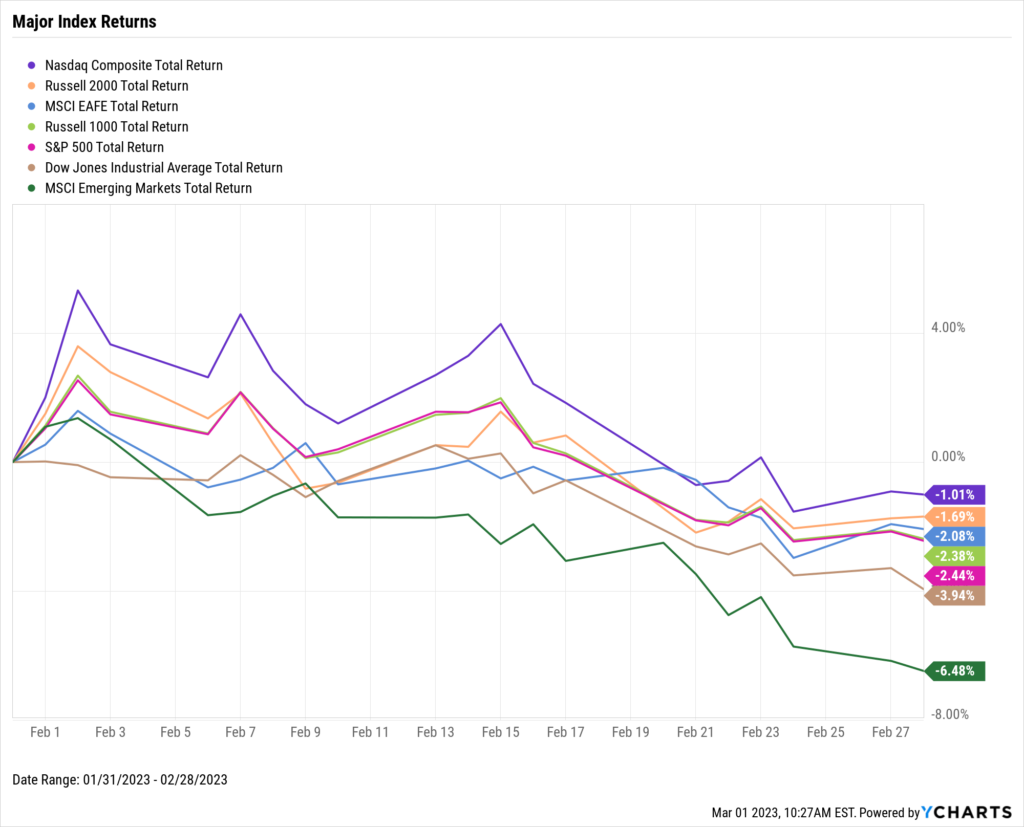
Stocks took a breather in February after a strong start to the year. The NASDAQ dipped 1%, the S&P 500 fell 2.4%, and the Dow Jones Industrial Average sank 3.9% following the conclusion of Q4 2022 earnings season. February was the second straight month in which the NASDAQ outperformed other major US indices, signaling renewed strength in growth stocks. The small-cap Russell 2000 index fell 1.7%, also outperforming the large-cap S&P 500 and blue-chip Dow Jones indices for the second month in a row.
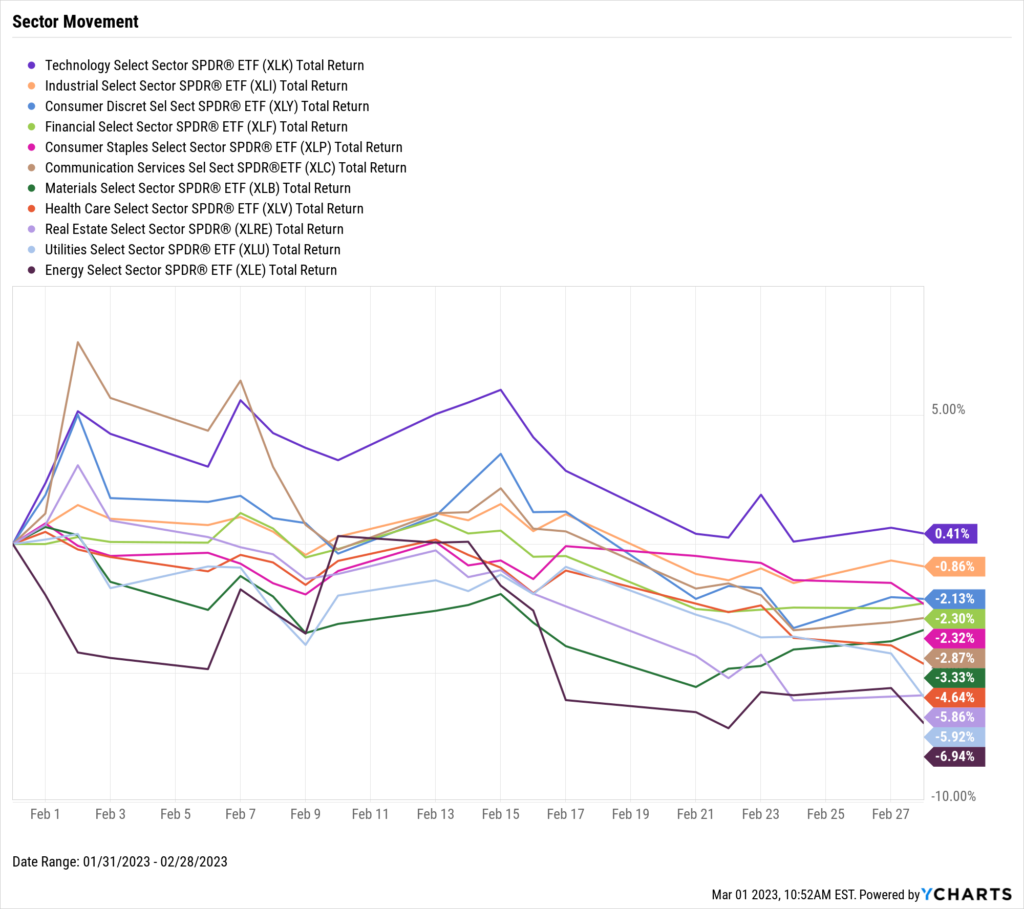
Technology was the only positive sector in February, rising 0.4%. Energy was at the bottom of the pack with a 6.9% decline as oil prices fell in February. Utilities had the second-worst performance in February, falling 5.9% as many utility stocks, often regarded as bond substitutes, face growing competition from US treasury yields.
US Unemployment fell to its lowest level in over 50 years and labor force participation increased month-over-month. Inflation came in about flat at 6.41% while the Consumer Price Index and Personal Spending logged their highest monthly advances in several months. The US ISM Manufacturing PMI also bucked eight straight monthly declines in February. Lastly, the housing market continued its cooldown, as MoM US Existing Home Sales fell for the 12th-straight month and the US median existing home price dipped another 2%.
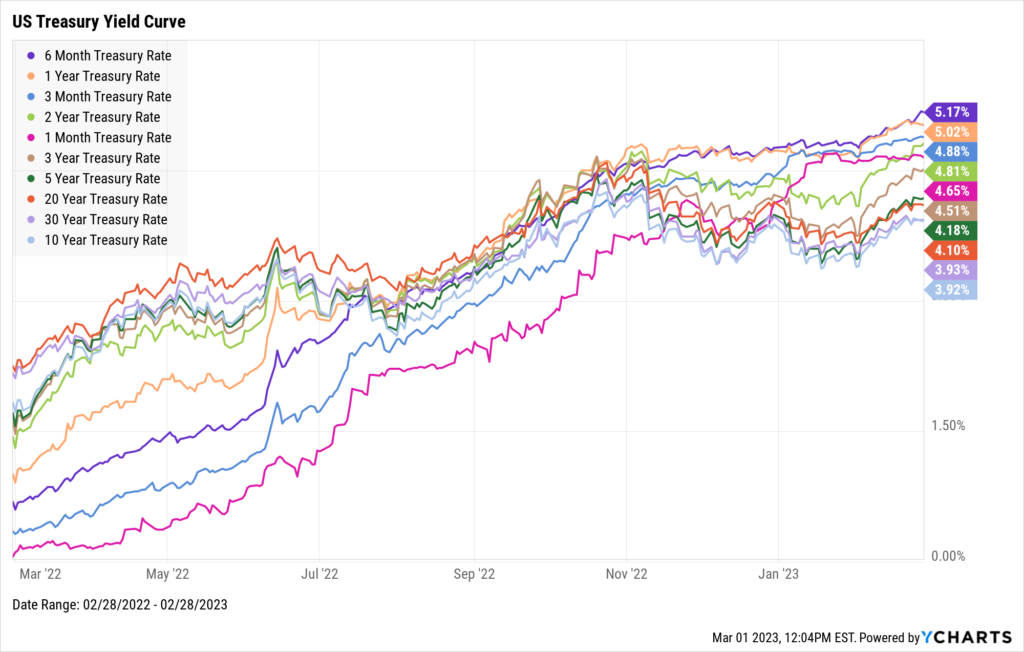
US Treasury yields eclipsed 5% for the first time since July 2007. Rates on the 6-Month and 1-Year Treasury Bills at the end of February were 5.17% and 5.02%, respectively. The 10-Year Rate was the lowest on the yield curve for the second straight month, but its 3.92% yield as of February’s end represents an 11.4% month-over-month increase.
Jump to Fixed Income Performance
Want access to full-year charts and data as well? Download our Monthly Market Wrap Slide Deck for more:Off the YCharts! Warren Buffett’s Berkshire vs. the S&P 500
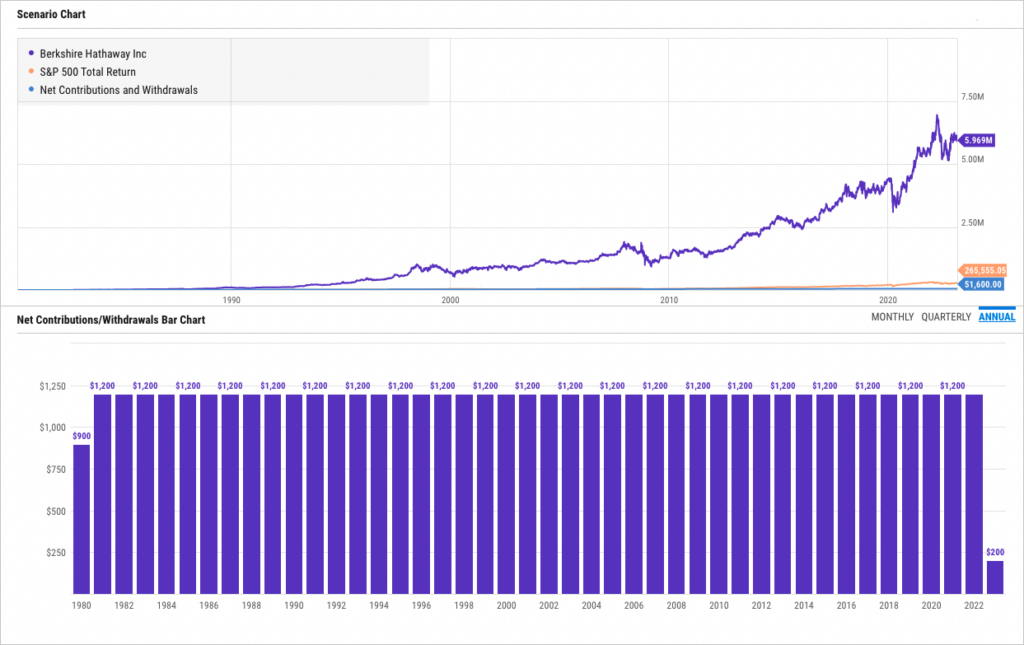
Last month, Berkshire Hathaway chairman Warren Buffett penned his much-anticipated annual letter to shareholders. In each letter, Berkshire investors are updated on the company’s overall gain vs. the S&P 500 since 1965, which through 2022 was a whopping 3,787,464% for Berkshire vs. 24,708% for the S&P 500.
What would such an investment look like in terms of real dollars?
Starting from March 1980 through February 2023, monthly investments of $100 in the S&P 500 would be worth around $265,000 today. If that money was instead bet on Berkshire (BRK.A), the cash contributions totaling $51,600 would’ve reached almost $6 million in value. No wonder why Buffett is called the “Oracle of Omaha”!
Download Visual | Modify in YCharts
Equity Performance
Major Indexes
Download Visual | Modify in YCharts | View Below Table in YCharts
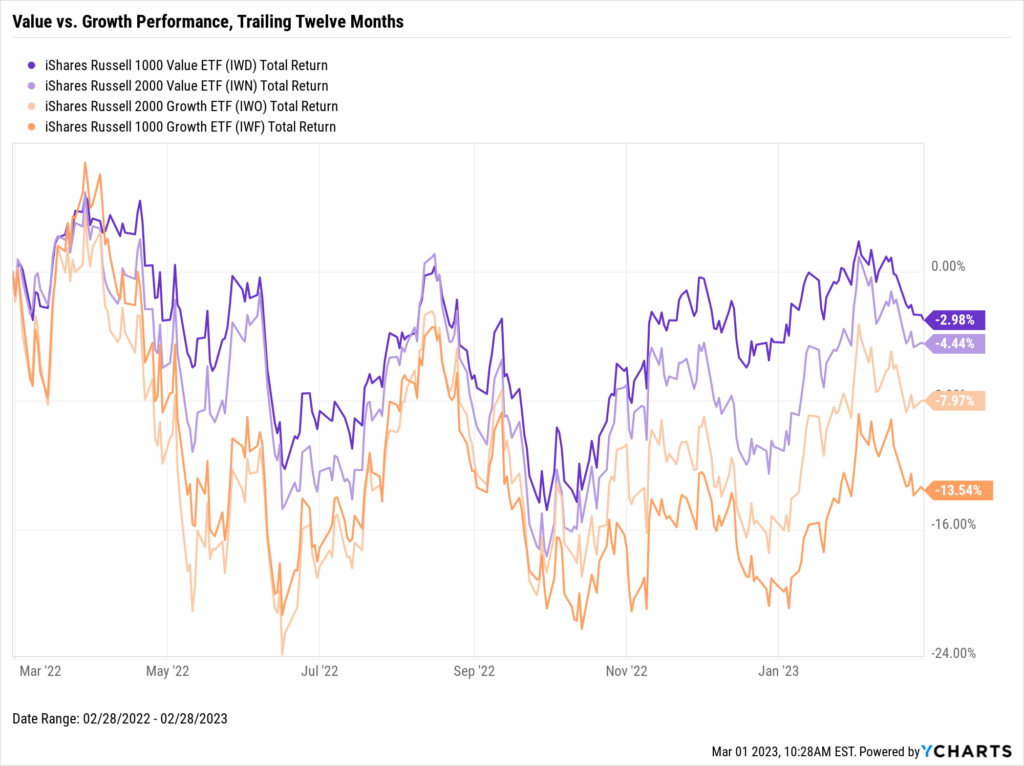
Value vs. Growth Performance, Trailing Twelve Months
Large-cap value stocks, represented by the iShares Russell 1000 Value ETF (IWD), had the worst February among the four equity styles, falling 3.5%. Growth stocks, both small-cap (IWO) and large-cap (IWF), slipped 1.2% in February, while small-cap value (IWN) ended the month off by 2.3%.
Zooming out to a trailing-twelve month view, large and small-cap value stocks briefly entered positive territory in February, though all four styles suffered most of their February losses in the back half of the month. Large and small-cap value stocks were within 1% of even as of January (also on a TTM basis), but are now down 3% and 4.4%, respectively. Small-cap growth is 8.0% lower in the last 12 months, and large-cap growth is in the red by 13.5%.
Download Visual | Modify in YCharts
US Sector Movement
Download Visual | Modify in YCharts | View Below Table in YCharts
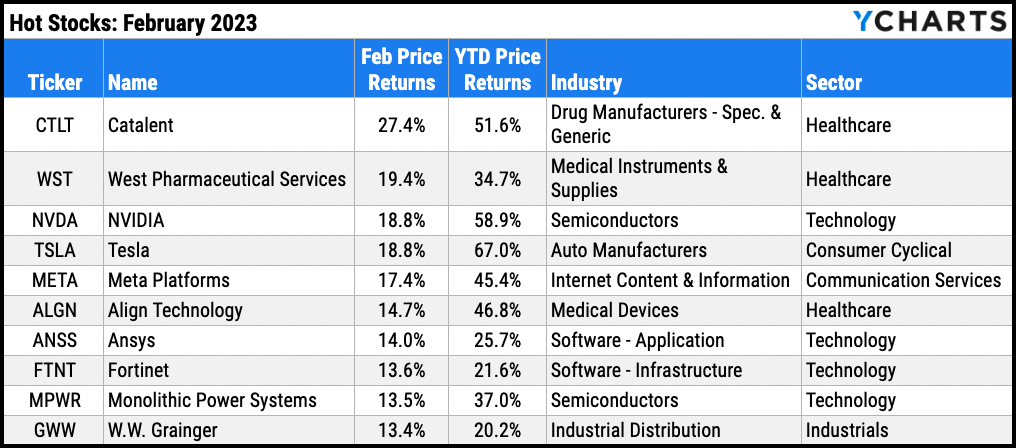
Hot Stocks: Top 10 S&P 500 Performers of February 2023
- Catalent (CTLT): 27.4% gain in February
- West Pharmaceutical Services (WST): 19.4%
- NVIDIA (NVDA): 18.8%
- Tesla (TSLA): 18.8%
- Meta Platforms (META): 17.4%
- Align Technology (ALGN): 14.7%
- Ansys (ANSS): 14.0%
- Fortinet (FTNT): 13.6%
- Monolithic Power Systems (MPWR): 13.5%
- W.W. Grainger (GWW): 13.4%
Download Visual | Modify in YCharts
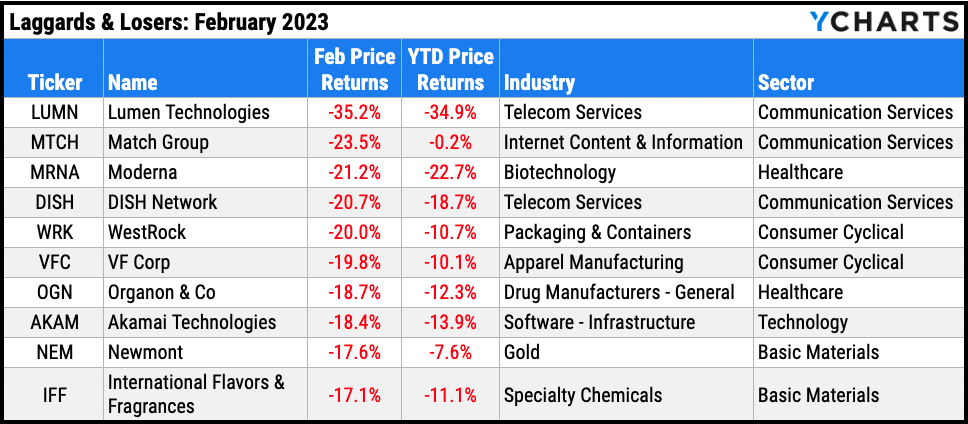
Laggards & Losers: 10 Worst S&P 500 Performers of February 2023
- Lumen Technologies (LUMN): -35.2% decline in February
- Match Group (MTCH): -23.5%
- Moderna (MRNA): -21.2%
- DISH Network (DISH): -20.7%
- WestRock (WRK): -20.0%
- VF Corp (VFC): -19.8%
- Organon & Co (OGN): -18.7%
- Akamai Technologies (AKAM): -18.4%
- Newmont (NEM): -17.6%
- International Flavors & Fragrances (IFF): -17.1%
Download Visual | Modify in YCharts
Featured Market & Advisor News
More Home Buyers Paying In Cash, Sweeping Majority Of Sales In Some Markets (FA-Mag)
Your Complete Guide to Sector Rotation (YCharts)
Retirement experts advise staying nimble regarding 4% rule (InvestmentNews)
New on YCharts: Report Builder (YCharts)
A Quarter of RIAs May Add a New Custodian in Next Year (WealthManagement.com)
Are Virtual Meetings Here to Stay? See What Advisors’ Clients Said (YCharts)
Economic Data
Employment
January’s unemployment rate fell to 3.4%, marking the lowest US unemployment level since May of 1969. The labor force participation rate went up 0.1 percentage point to 62.4%, though labor force participation is still a full percentage point below its February 2020 high. 517,000 jobs were added in the first month of 2023, far surpassing January nonfarm payroll expectations of 187,000.
Consumers and Inflation
YoY US Inflation was about flat between December and January, coming in at 6.41%. YoY US Core Inflation decreased one-tenth of a percentage point to 5.58%. The US Consumer Price Index rose 0.5% MoM, marking the largest monthly increase since last June. At the same time, MoM US Personal Spending surged 1.76%, the highest monthly increase in nearly two years. The Upper Limit Target Federal Funds Rate remains at 4.75% as of the Fed’s February 1st meeting, with the next Fed Funds Rate decision scheduled for the March 22 FOMC meeting.
Production and Sales
Logging a slight increase of 0.3 points, US ISM Manufacturing PMI put an end to eight consecutive monthly declines. At 47.7, however, the Manufacturing PMI continues to indicate the manufacturing economy is shrinking. On the other hand, US Retail and Food Services Sales logged its highest monthly increase since March 2021, jumping 3%. The US Retail Trade Inventory/Sales Ratio inched closer to its 30-year average of 1.50, rising two one-hundredths to 1.26 as of December 2022.
Housing
MoM US New Single-Family Home Sales surged 7.2% in January, matching December’s revised value exactly. Existing housing data continues to trend in the opposite direction, as US Existing Home Sales’ MoM decline of 0.7% in January marked 12 consecutive monthly declines for existing home sales. The Median Sales Price of Existing Homes cooled off for a seventh straight month, falling 2% to $359,000. In further unwelcome news for potential homebuyers, 15-Year and 30-Year Mortgage Rates went back on the rise in February, to 5.76% and 6.50% respectively.
Commodities
After Gold’s strong start, a 6.0% gain in January, its price per ounce declined by 5.9% to $1,811 as of February 24th. Oil prices were also down in February—the price of WTI per barrel fell 4.3% to $75.57 while Brent dipped 1.3% to $82.31. Both types of crude oil are down over 38% from their highs set in March of last year, and the average price of regular gas fell by a dime to $3.45 per gallon at the end of February.
Cryptocurrencies
Following a 2022 where the prices of both Bitcoin and Ethereum plummeted by two-thirds, Bitcoin is up 41.3%, and Ethereum has risen 36%, so far in 2023. Though the price of Bitcoin increased just 3% in February, and Ethereum by 4.2%, could the worst be over for crypto?
Fixed Income
US Treasury Yield Curve
1 Month Treasury Rate: 4.65%
3 Month Treasury Rate: 4.88%
6 Month Treasury Rate: 5.17%
1 Year Treasury Rate: 5.02%
2 Year Treasury Rate: 4.81%
3 Year Treasury Rate: 4.51%
5 Year Treasury Rate: 4.18%
10 Year Treasury Rate: 3.92%
20 Year Treasury Rate: 4.10%
30 Year Treasury Rate: 3.93%
Download Visual | Modify in YCharts
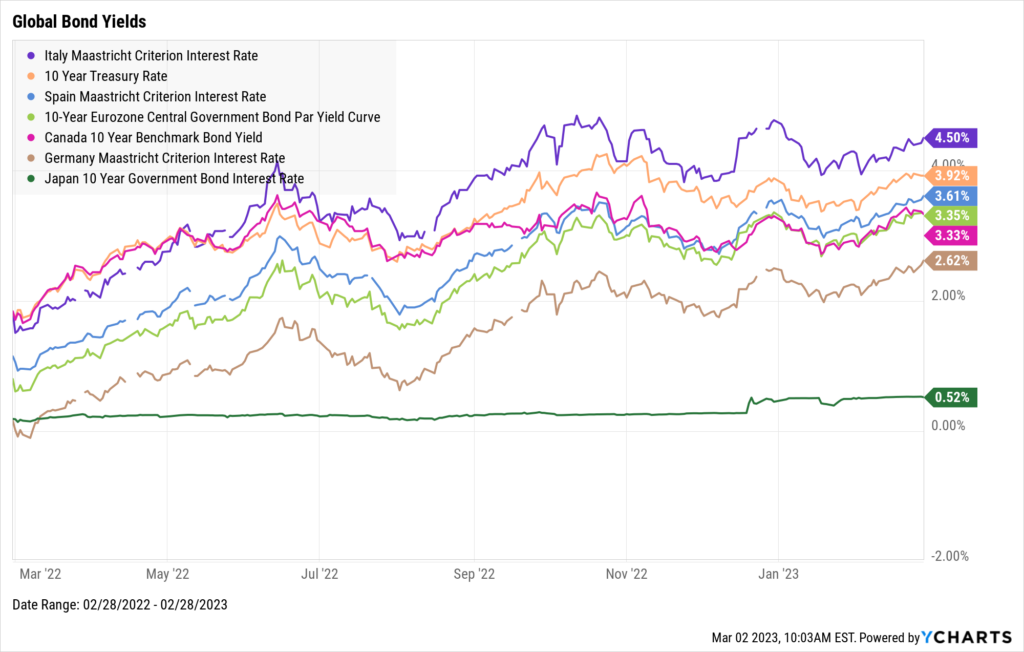
Global Bonds
Italy Long Term Bond Interest Rate: 4.50%
10 Year Treasury Rate: 3.92%
Spain Long Term Bond Interest Rate: 3.61%
10-Year Eurozone Central Government Bond Par Yield: 3.35%
Canada 10 Year Benchmark Bond Yield: 3.33%
Germany Long Term Bond Interest Rate: 2.62%
Japan 10 Year Government Bond Interest Rate: 0.52%
Download Visual | Modify in YCharts
Have a great March! 📈
Get the Monthly Market Wrap slide deck sent straight to your inbox. Download Here:Next Article
ICYMI: Brian Portnoy Decodes the Psychology of Client WealthRead More →