Your Complete Guide to Sector Rotation
As the economy expands and contracts, so do companies’ financial performances across the 11 stock sectors. When the outlook is positive, economically sensitive companies perform better, prompting investors to buy their shares. If the outlook turns sour, investors may sell out of those companies and swap into investments that can better weather economic downturns. This practice is known as sector rotation.
Sector rotation is evidenced in a basic form by comparing the long and short-term performance of sensitive, cyclical, and defensive companies. Sensitive and cyclical stocks, more reactive to interest rates and other economic factors, have taken advantage of favorable conditions for most of the last decade.
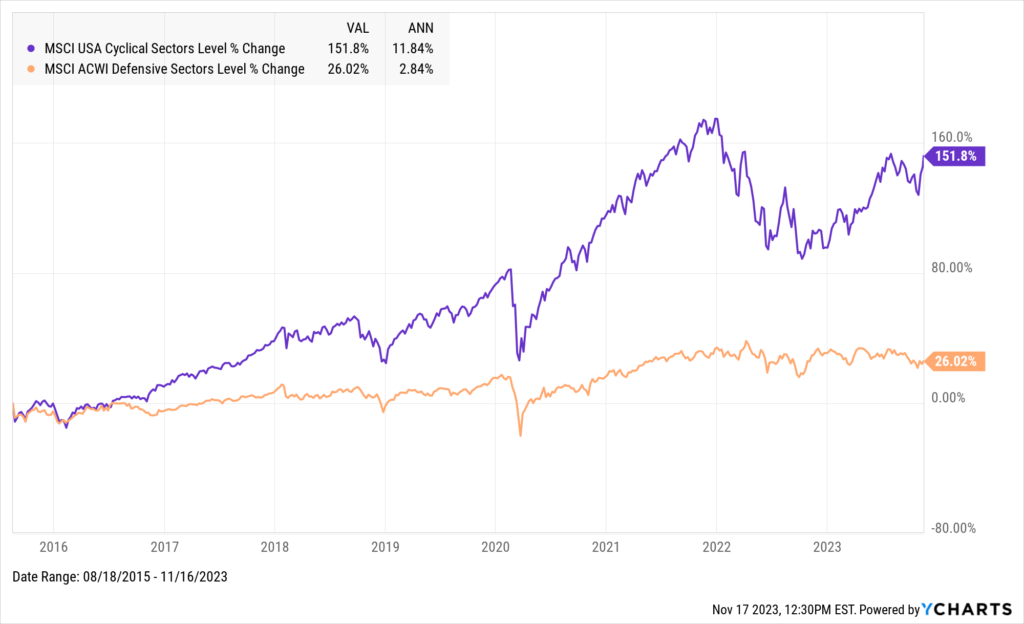
Download Visual | Modify in YCharts
In the three years since the start of the COVID-19 pandemic, however, spiking treasury rates, inflation, and a slew of Fed rate hikes have caused investors to rotate out of cyclical stocks. Large amounts of money flowed out of equities in general since the start of 2022, and though growth stocks are rebounding in 2023, they were more acutely affected last year. Value stocks, typically established companies with steadier business models, were investor safe havens.
Investors are actively rotating back into cyclical stocks, helped by a pause in Fed Rate Hikes and slowing inflation, as illustrated by the recent push toward a new all-time high in the chart below:
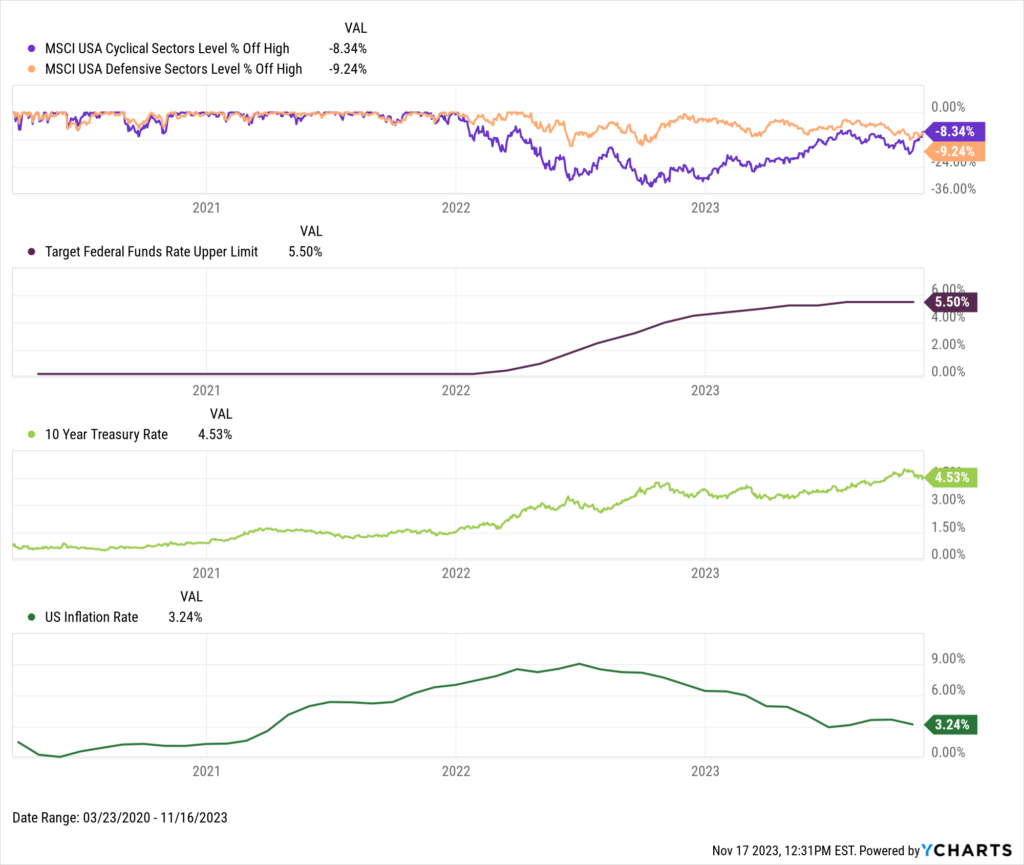
Download Visual | Modify in YCharts
Cycles that Trigger Sector Rotations
The economy goes through cycles, and sector rotations occur at each stage. The most common cycles that investors follow are:
• Changes in the Market Cycle
• Changes in the Economic Cycle
• Overbought vs. Oversold Cycles
The Market Cycle
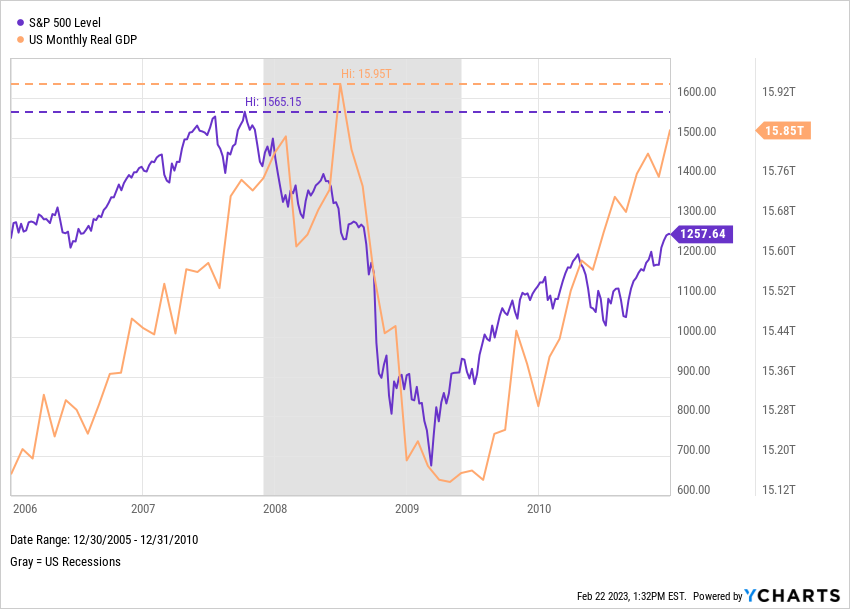
The market cycle typically moves ahead of the economic cycle since investors make decisions in anticipation of the future. As such, the current market cycle stage can indicate which sectors will soon become market leaders:
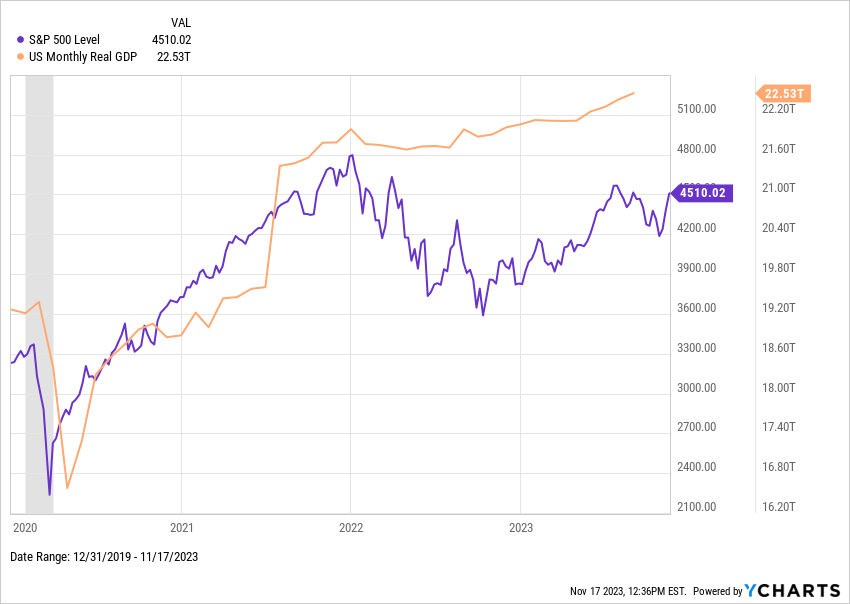
This dynamic, in which the market cycle leads the economic cycle, came to fruition during the 2008 and 2020 recessions. In 2008, the S&P 500 peaked months ahead of US Monthly Real GDP’s top–stocks sold off in anticipation of a worsening economy.
Download Visual | Modify in YCharts
When the COVID-19 pandemic struck in early 2020, the stock market was ahead of the 8-ball once again. Such is the nature of stock prices that discount future cash flows and investors who always want to be one step ahead.
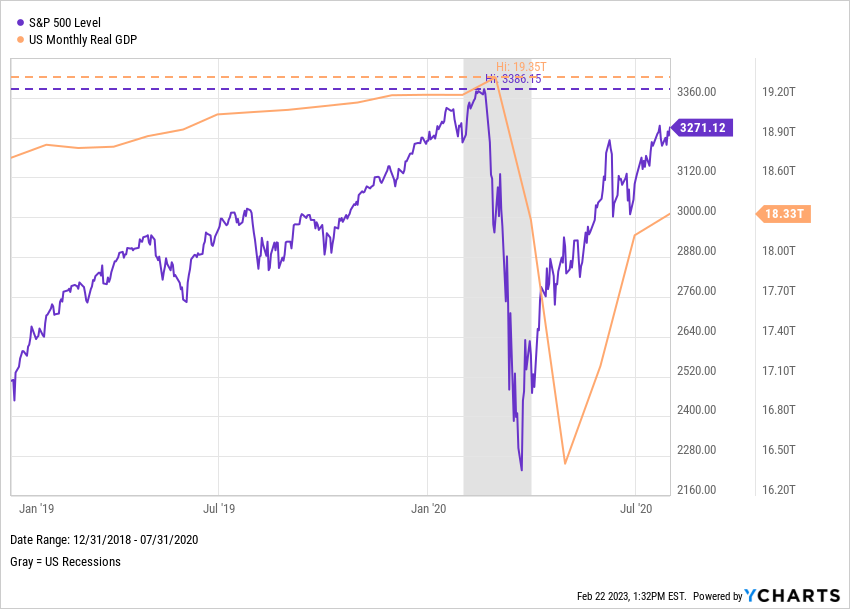
Download Visual | Modify in YCharts
More recently, equities began an extended downtrend at the very start of 2022, along with slightly negative GDP growth in the first half of the year. No official recession occurred in 2022, but as the probability of one remains heightened, investors will be watching for equity declines as warnings of a possible economic contraction grow, even as stocks trend higher.
Download Visual | Modify in YCharts
The Economic Cycle
Layered underneath the market cycle is the economic cycle. Because economic data is released more infrequently, and investors price in estimates beforehand, the economic cycle lags behind market movements. That said, it can provide solid confirmation of prevailing market trends. Sectors tend to perform differently based on the current economic cycle stage:
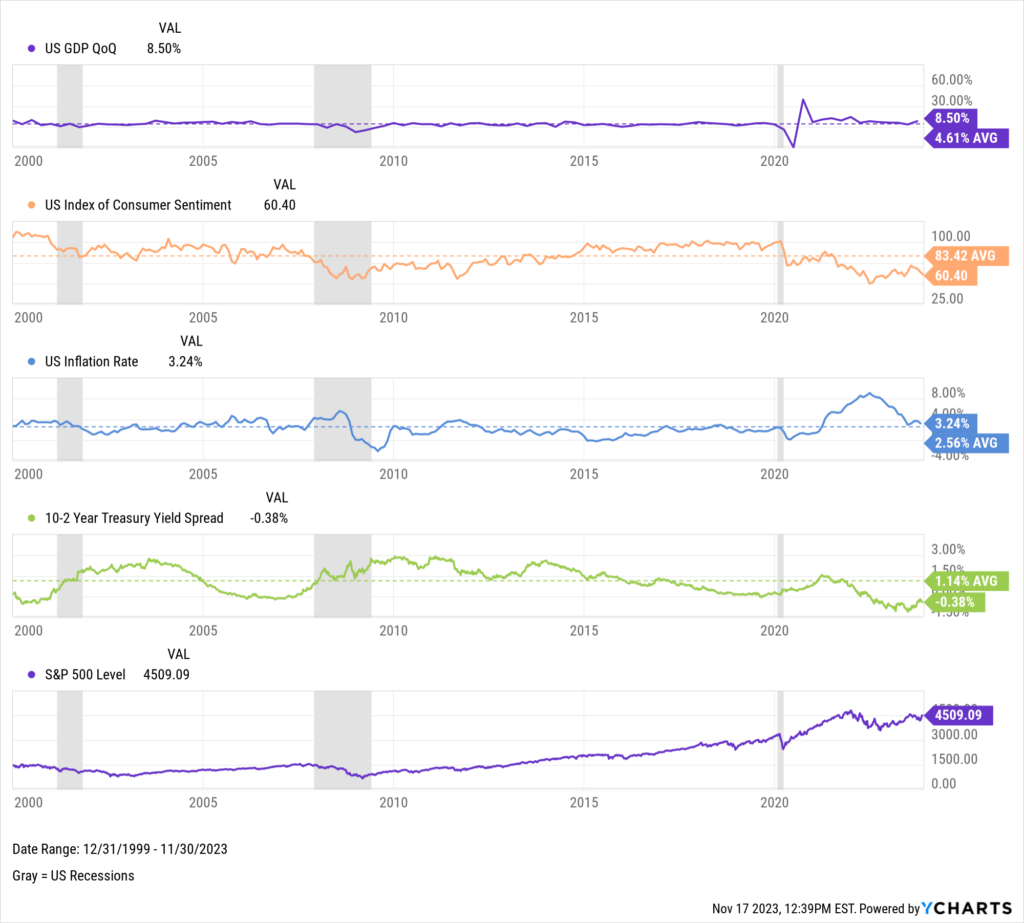
Here’s how a few of those relevant economic indicators have been trending compared to market performance, including US GDP, Consumer Sentiment, Inflation Rate, and the 10-2 Year Treasury Yield Spread:
Download Visual | Modify in YCharts
Overbought and Oversold Cycles
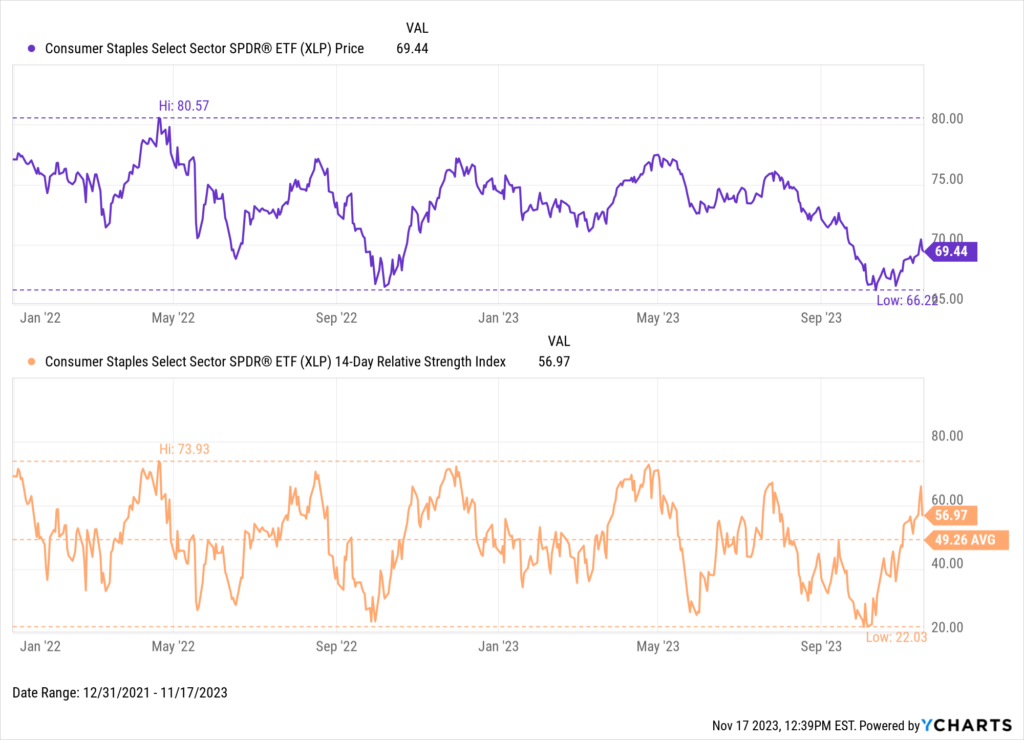
Overbought and oversold indicators can help complement investment decisions. A relative strength index (RSI) reading of 70 or higher indicates that a security is overbought, and a value below 30 is oversold. In April 2022, the value-focused Consumer Staples Select Sector SPDR ETF (XLP) triggered a common overbought signal when its RSI reached nearly 74. The ETF slid 12.3% in the one month following April 20th. Conversely, XLP rallied 15.7% within 60 days after the RSI hit 23.7 on September 30th.
XLP’s RSI dove into oversold territory two months ago, bottoming at 22 on October 3rd, 2023. Does XLP have more room to run beyond its 2.4% rise since October 3rd?
Download Visual | Modify in YCharts
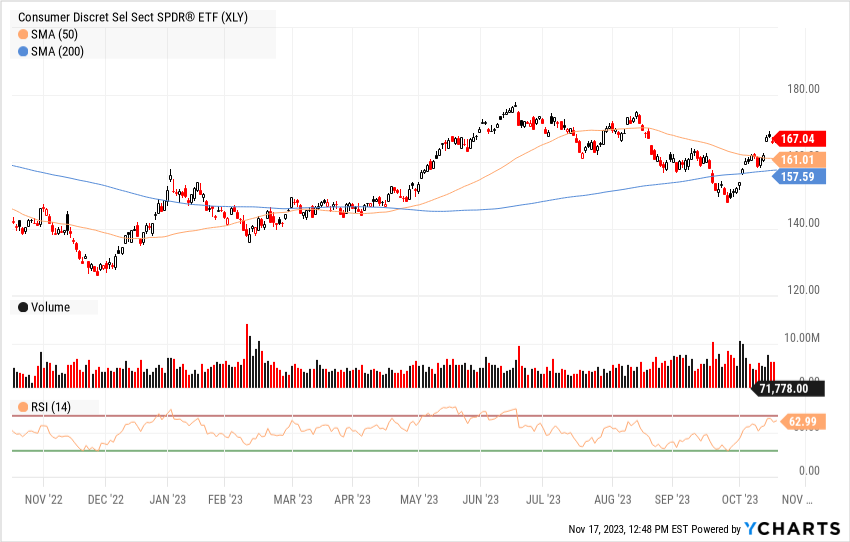
RSI readings coupled with 50-day or 200-day simple moving average (SMA) encounters can provide additional signals that a sector is overbought or oversold. For instance, the growth-focused Consumer Discretionary Select Sector SPDR ETF (XLY) entered a consolidation pattern in March 2023 when its 50-day and 200-day SMAs converged. After forming a “golden cross” in May, where the 50-day SMA crossed above the 200-day, XLY broke out to the upside. However, as the 200-day SMA converges closer to the 50-day, is bearish activity around the corner?
Download Visual | Modify in YCharts
Sector Rotation in Practice
One argument for using a sector rotation strategy is that companies’ share prices in each sector tend to move in the same direction. This is a natural effect of sector classification, whereby companies with similar business models are grouped together. At a minimum, investors can gain baseline exposure to a given sector’s sensitivities using individual stocks. Or, broader exposure can be secured using sector ETFs.
An example is the relationship of crude oil prices with major airliners American Airlines (AAL), Delta Airlines (DAL), Southwest Airlines (LUV), and United Airlines (UAL), as well as United Parcel Service (UPS) and FedEx (FDX). Despite operating in different industries, these industrial sector companies benefit from lower oil prices, causing share prices to increase when fuel costs decline.
Investors use a top-down approach and look to macroeconomic indicators to assess the current economic cycle stage. Rotations are made from unfavorable sectors and into favorable ones poised to grow.
Other Factors to Consider
Sector rotation involves active management, which requires frequently monitoring market and economic events to capture opportunities. As explained earlier, the economic cycle takes longer to catch up to the market cycle—and markets could also fail to digest economic news efficiently. Mistiming the market cycle could cause alpha or returns to be left on the table.
Remember: rotating out of a given sector involves selling shares, and each profitable sale triggers a knock on the door from Uncle Sam to collect capital gains tax. Tax events can diminish overall returns, which is why the level of active portfolio management should be considered in order to avoid unnecessary capital gains tax.
An additional note to keep in mind is industries aren’t as homogenous as broader sectors, and a deviation can throw off a rotation strategy. Using the relationship between crude oil and airliners as an example, low oil prices are a significant tailwind for major airlines. However, other Industrials, like railroads, might suffer as crude oil shipments decline. It might be thought that a rising tide lifts all boats, but there could be outlying industries that fail to swim, reinforcing the need for thorough investment research such as a top-down approach.
Finally, past performance isn’t always indicative of future results. Even if a chart historically shows declines after a security’s peak and growth following a trough, economic and market events could alter those trajectories.
Using YCharts to Plan Your Sector Rotation Strategy
Report Builder
Create custom presentation-view reports using Report Builder. Use the drag-and-drop tool to fill a presentation-style slide deck with Fundamental Charts, Comp Tables, and more to illustrate sector rotation trends. All assets automatically update with the latest data, making for effortless creation of communication collateral.
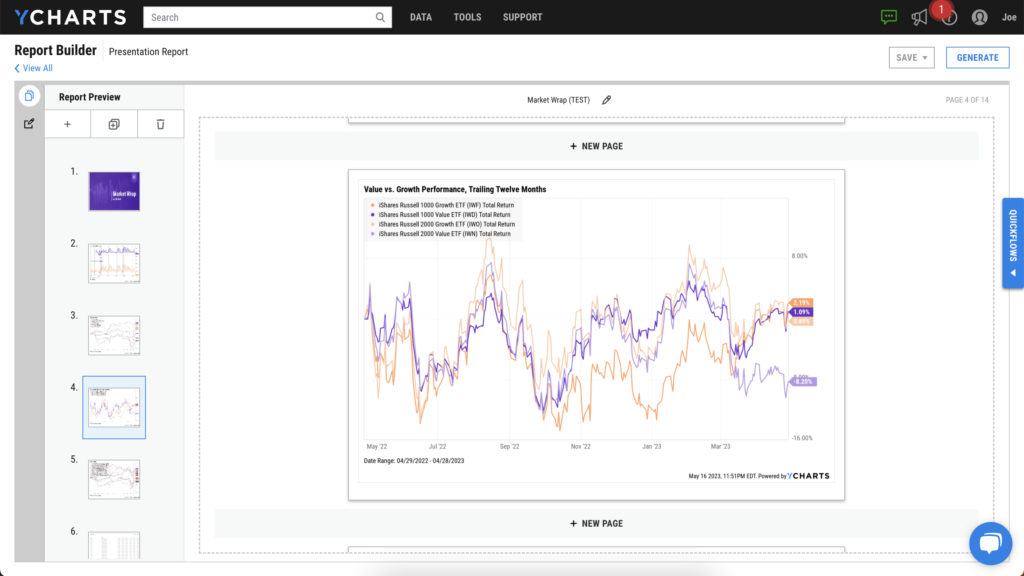
Download Visual | Modify in YCharts
Visualize the Economic and Market Cycles
Want to determine the current cycle stages? Fundamental Charts can illustrate market performance along with over 400,000 economic indicators, including interest rates, unemployment, and US GDP, as illustrated in the charts above.
Plotting ratios, spreads, correlations, and US recession backdrops can also uncover how different securities fare throughout the economic cycle and its stages.
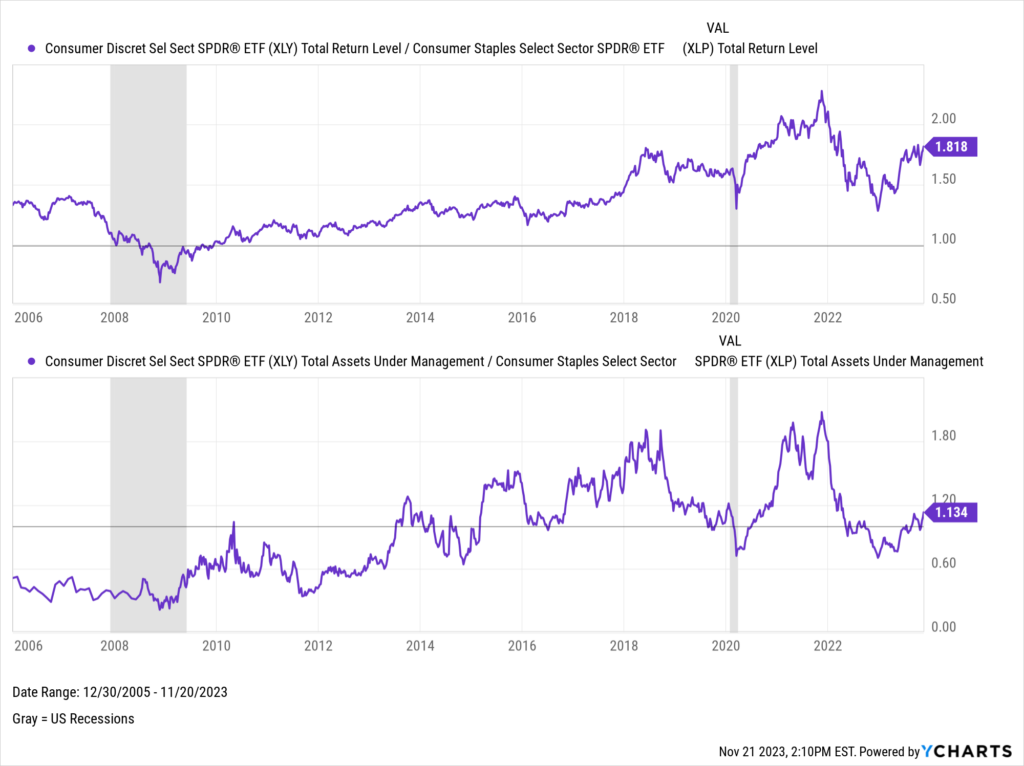
Download Visual | Modify in YCharts
Screen for Investment Ideas
Once you have a sense of current market conditions, it’s time to find investments poised to outperform. The YCharts Stock Screener finds securities across all sectors and industries that fit your criteria.
Screening templates are also available to get you started. Find momentum stocks or stocks trading near lows and those with attractive relative metrics against the market, their respective industry, and respective sector.
Similarly, the Fund Screener enables you to search over 77,000 mutual funds and ETFs. This includes sector-tracking funds and even ETFs that leverage sector rotation strategies, such as:
Sector Rotation focused ETFs:
- Anfield US Equity Sector Rotation ETF (AESR)
- ATAC US Rotation ETF (RORO)
- First Trust Lunt US Factor Rotation ETF (FCTR)
- Main Sector Rotation ETF (SECT)
- Q3 All-Season Active Rotation ETF (QVOY)
- RH Tactical Rotation ETF (RHRX)
- SPDR SSGA Fixed Income Sector Rotation ETF (FISR)
- SPDR SSGA US Sector Rotation ETF (XLSR)
Sector Rotation focused Mutual Funds:
- ATAC Rotation Institutional (ATCIX)
- ATAC Rotation Investor (ATACX)
- Conquer Risk Tactical Rotation (CRTBX)
- Q3 All-Season Sector Rotation Instl (QAISX)
- Sector Rotation Fund (NAVFX)
Model Portfolios
Tie your analysis together with Model Portfolios to validate your sector rotation strategy against any benchmark. Here, you can evaluate the alpha of your rotation strategies and showcase your research with client-ready PDF reports.
Download a Sample Model Portfolio Report
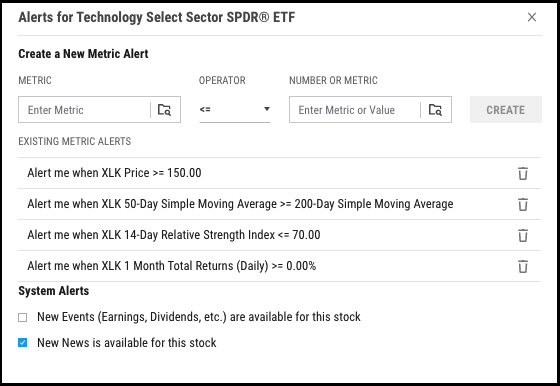
Alerts
YCharts will let you know when a possible sector rotation is near with custom alerts. Get automatic alerts—and a head start on your sector rotation game plan—when an equity or economic indicator reaches certain levels, including price, moving averages, RSI, and much more.
Learn More About Sector Rotation
• Sector Rotation Definition (Investopedia)
• Sector Rotation and the Stock Market Cycle (Barry Ritholtz)
• What Is Sector Rotation? (The Motley Fool)
• New on YCharts: Heat Maps for Stocks, Indices & Sectors
Whenever you’re ready, there are 3 ways YCharts can help you:
Have questions about how YCharts can help you visually illustrate the differences between investing strategies?
Send us an email at hello@ycharts.com or call (866) 965-7552. You’ll be directly in touch with one of our Chicago-based team members.
Want to test out YCharts’ research and reporting tools for free?
Start a no-risk 7-Day Free Trial
Want More Insights from YCharts? Subscribe to the Blog.
Disclaimer
©2023 YCharts, Inc. All Rights Reserved. YCharts, Inc. (“YCharts”) is not registered with the U.S. Securities and Exchange Commission (or with the securities regulatory authority or body of any state or any other jurisdiction) as an investment adviser, broker-dealer or in any other capacity, and does not purport to provide investment advice or make investment recommendations. This report has been generated through application of the analytical tools and data provided through ycharts.com and is intended solely to assist you or your investment or other adviser(s) in conducting investment research. You should not construe this report as an offer to buy or sell, as a solicitation of an offer to buy or sell, or as a recommendation to buy, sell, hold or trade, any security or other financial instrument. For further information regarding your use of this report, please go to: ycharts.com/about/disclosure
Next Article
How Wholesalers Can Use 13F Reports with YCharts to Boost ETF AUMRead More →