How Wholesalers Can Use 13F Reports with YCharts to Boost ETF AUM
Every quarter, 13F report filings cause some of the most famous investors to make headlines due to the new positions in their portfolios. But for wholesalers with ETF products, a search on the EDGAR Database for 13Fs can provide insights into an advisor’s holdings and help you build a game plan in preparation for a call.
This quarter, Warren Buffet’s Berkshire Hathaway (BRK.A) revealed exits from several long-held positions and now has an ownership stake in the Atlanta Braves after adding 223,645 shares of Atlanta Braves Holdings (BATRK) to its portfolio.
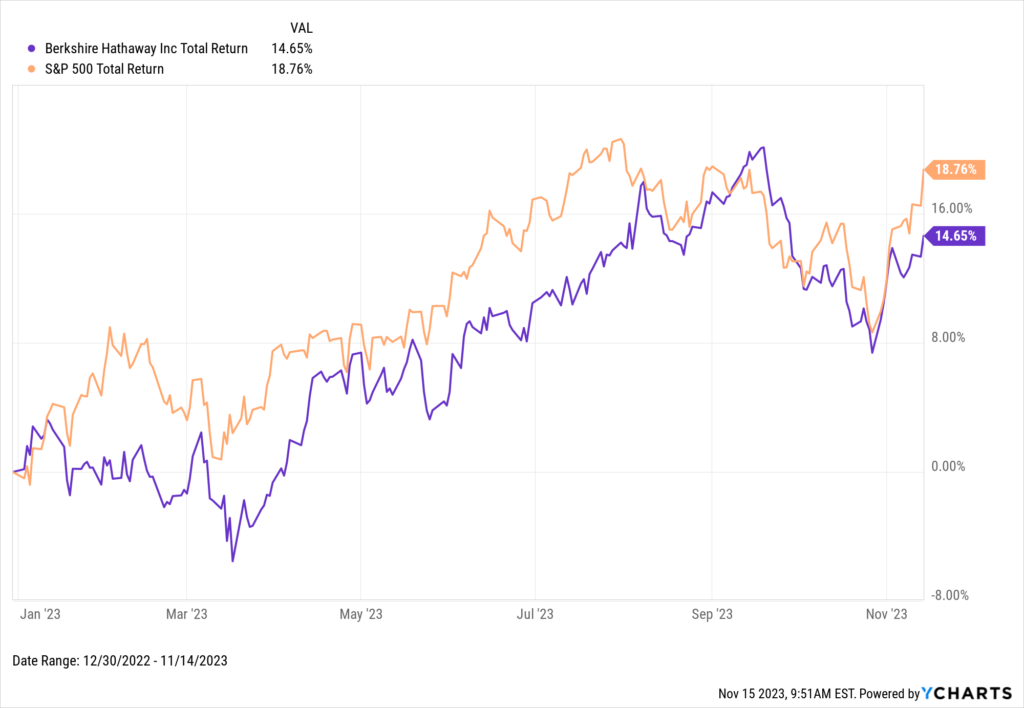
Download Visual | Modify in YCharts
Despite stories like these dominating the headlines, less publicized 13F filings are the real opportunity for wholesalers to boost their AUM. With these insights, YCharts’ communication and research tools can help you research your competitors and position your fund as a replacement.
What is a 13F Filing
Simply put, a 13F quarterly report shows the holdings of institutional money managers with over $100 million in AUM. The goal of these reports is to provide transparency and accountability, and they must be filed with the Securities and Exchange Commission (SEC) within 45 days of the quarter’s end.
Many retail investors use 13Fs to tail the “smart money.” However, there are some problems with this – mainly the timing of the filings and lack of information on hedge funds’ short positions. Nonetheless, 13Fs can provide wholesalers insights into which advisors recently held or are currently holding rival funds and how their positions have changed.
Using 13F Filings to Find Prospects
When building a strategy for your territory, 13F reports can help with prospecting.
By entering an advisor(s) or their firm name in the EDGAR Database, you can “Ctrl+F” through their 13F to find competitor ETFs that you’ve been triumphant against in the past and want to position yourself against.
If you have a list of target advisors in your pipeline, 13Fs provide another conversation you can have with them.
By doing this before your first conversation with this advisor, you have talking points for your fund and how to position your fund against their current holdings.
Using YCharts to Research Funds
Before or after building a shortlist of advisors you want to target for your 13F campaign, you can use YCharts to find competitor funds for your strategy.
Using the Vanguard Interm-Term Bond ETF (BIV) as an example, you can use the Fund Screener, where you can add metrics like fund flows (1-year, 3-month, YTD, etc.), Yield to Maturity, SEC yield, Average Duration, Average Credit Quality or any other metric that you want to use to compare strategies.
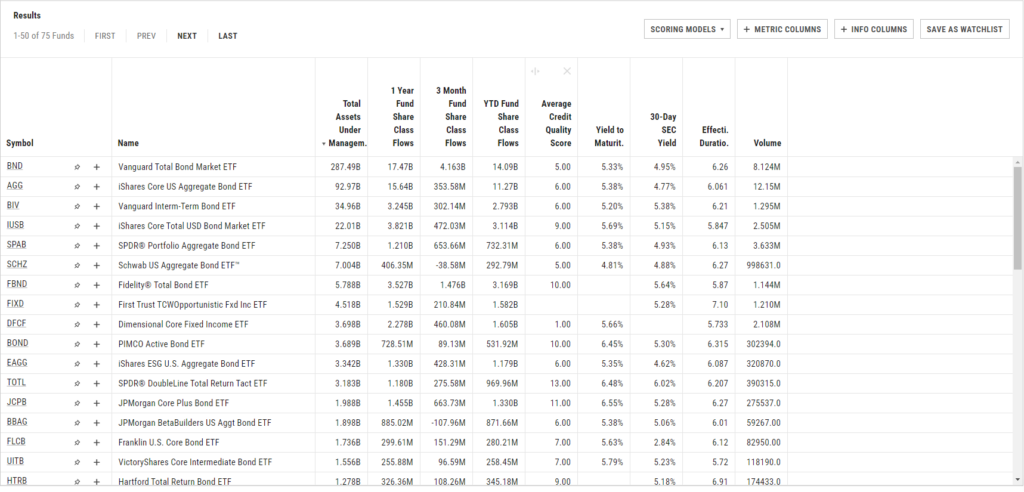
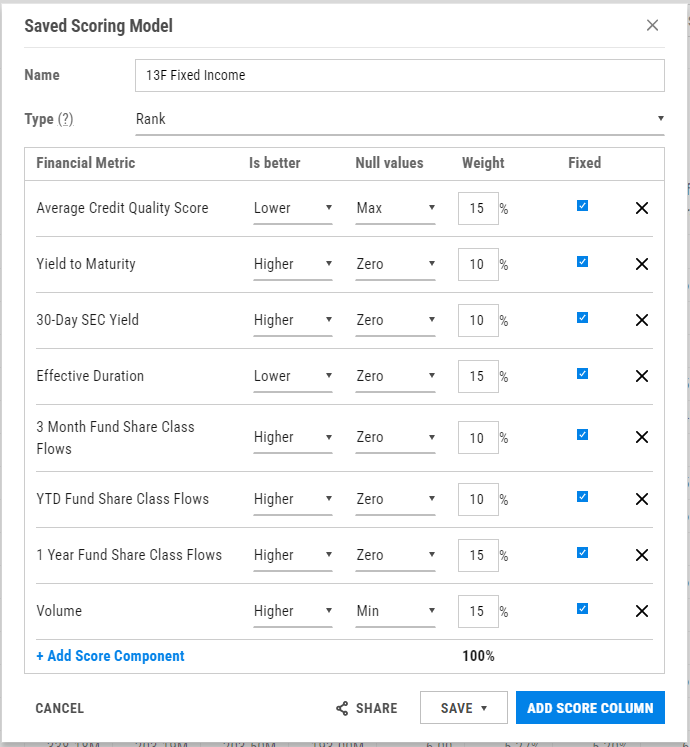
To avoid relying on a single metric to find a fund you want to challenge, you can combine the metrics to create a scoring model that provides a numerical ranking of which funds you’ll have the most successful chance of positioning your strategy against.
In this case, the JPMorgan Core Plus Bond ETF (JCPB) appears to be a ripe opportunity to challenge due to its elevated credit risk.
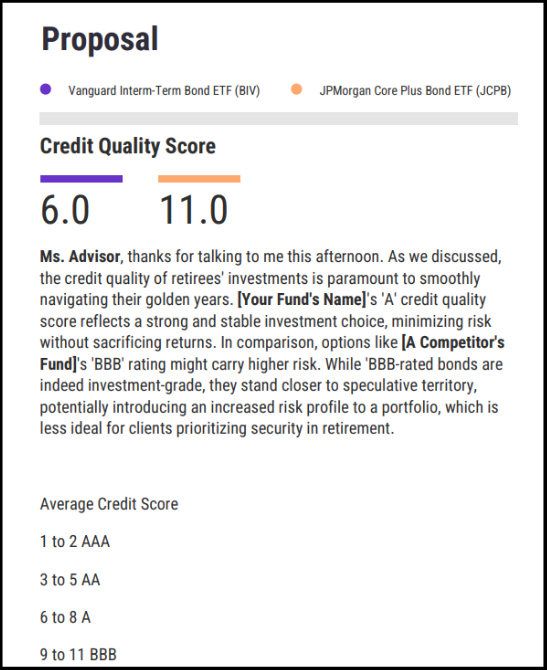
Sending Material After a Call With a Prospect
With YCharts’ new Proposals, you can tailor personalized Talking Points for that advisor. You can highlight the higher creditworthiness or additional yield your fund offers compared to a competitor and how that will give the advisor’s clients a better investing experience.
Start a Free Trial to Craft Your Own Proposals
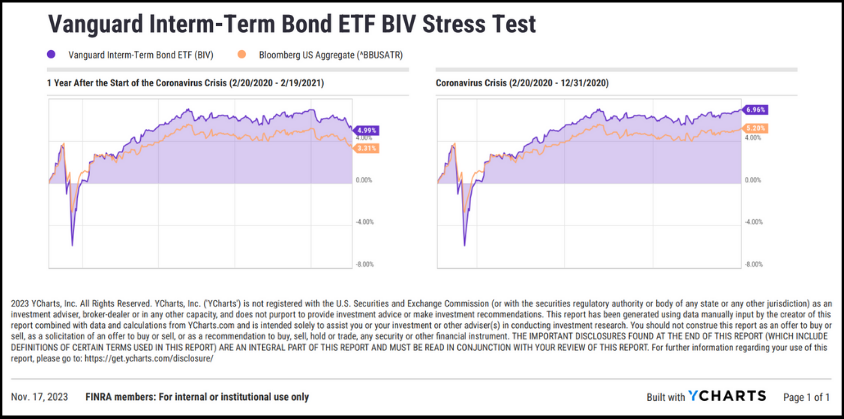
In addition, you can bring in Fundamental Charts and Scenarios, or the enhanced Stress Tests feature to bring in custom time frames that visually highlight your strategy’s superiority.
Wholesalers with ETFs in their product suite can leverage 13F filings and YCharts to craft tailored engagement strategies that resonate with advisors. By focusing beyond headline-making 13F news and using these tools to analyze and articulate the advantages of their ETF offerings, they can grow their AUM with informed, strategic conversations.
Whenever you’re ready, there are 3 ways YCharts can help you:
Have questions about how YCharts can assist your distribution team in achieving your AUM goals?
Schedule a meeting with an asset management specialist, call us at (773) 231-5986, or email hello@ycharts.com.
Want to test out YCharts’ research and reporting tools for free?
Start a no-risk 7-Day Free Trial
Want More Insights from YCharts? Subscribe to the Blog.
Disclaimer
©2023 YCharts, Inc. All Rights Reserved. YCharts, Inc. (“YCharts”) is not registered with the U.S. Securities and Exchange Commission (or with the securities regulatory authority or body of any state or any other jurisdiction) as an investment adviser, broker-dealer or in any other capacity, and does not purport to provide investment advice or make investment recommendations. This report has been generated through application of the analytical tools and data provided through ycharts.com and is intended solely to assist you or your investment or other adviser(s) in conducting investment research. You should not construe this report as an offer to buy or sell, as a solicitation of an offer to buy or sell, or as a recommendation to buy, sell, hold or trade, any security or other financial instrument. For further information regarding your use of this report, please go to: ycharts.com/about/disclosure