NEW on YCharts: Technical Charts
YCharts’ Technical Charts has recently experienced a makeover to a more modern interface that matches the familiar formatting found on Fundamental Charts. Not only that, but we’ve added a couple of new features that will further enhance one’s price trend analysis, including a new chart style, additional indicators, and annotation capabilities.
Want to see it in action? Check out the short video below:
Start a Free Trial | Schedule a Demo
Out with the Old, In with the New
Maintaining the same dynamic capabilities as its previous iteration, the latest updates to YCharts’ Technical Charts improve the visual component, begging you to share your insights with colleagues and clients alike.
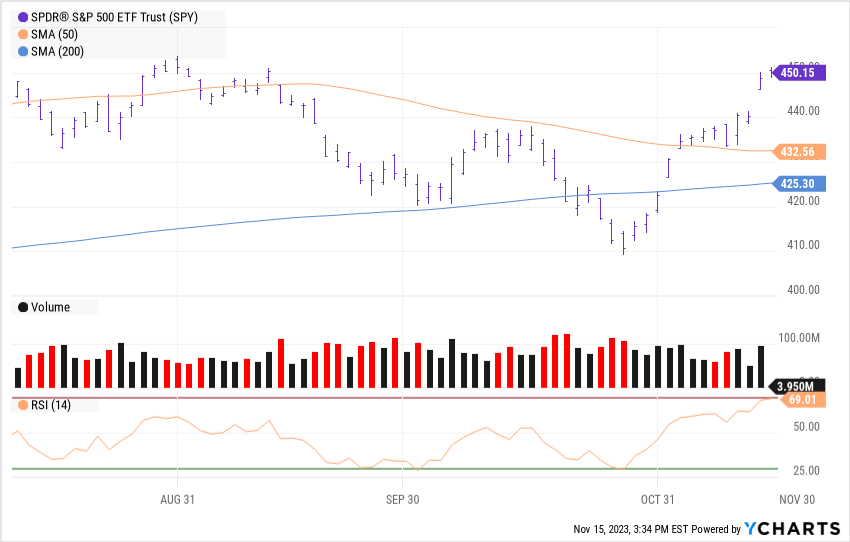
In addition to the available “Line” and “Candlestick” chart styles, the new “OHLC” (Open, High, Low, Close) chart type offers investors a consolidated view of four essential data points in a single vertical bar – the opening price, closing price, as well as the high and low price range for the selected timeframe.
Start a Free Trial | Schedule a Demo
Moreover, YCharts’ Technical Charts boasts an ample selection of over 30 diverse overlays and oscillators, ranging from the Simple Moving Average (SMA) and Exponential Moving Average (EMA) to MACD, Relative Strength Index (RSI), Momentum Oscillator, and more that will help you better evaluate a security’s true value.
Highlight Major Trends and Callout Specific Datapoints
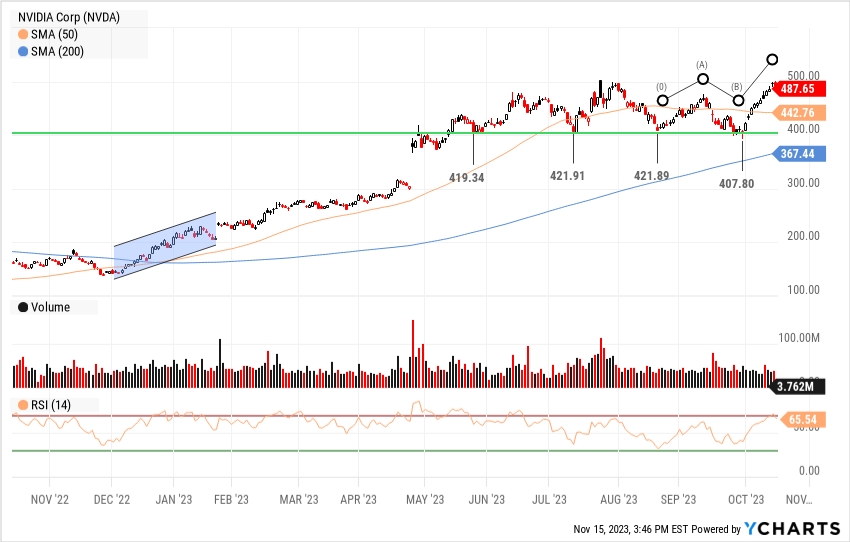
The most significant addition to YCharts’ Technical Charts is annotation capabilities, empowering investors to gain deeper insights into price patterns for a security or index. With these tools, you’ll be well-equipped to pinpoint investment opportunities. These new charting features enable investors to:
- Highlight specific timeframes or significant price points using three distinct counter types, including customizable text, numerical labels, and directional arrows.
- Quantify significant periods by noting the maximum, minimum, average, and the count of price data points.
- Draw attention to noteworthy historical price shifts leveraging “Crooked” and “Elliott” lines to identify trends, support, resistance, and potential patterns to inform an investor’s trading strategy and potentially help predict future price movements.
Start a Free Trial | Schedule a Demo
Some additional advanced indicators investors can use to perform in-depth analysis include:
- Pitchfork Bands: Used to identify potential levels of support and resistance for an asset. It is drawn using three parallel trendlines that help determine the general direction of the trend and possible areas where the price may reverse or continue.
- Parallel Channel: A technical pattern formed by drawing two parallel trendlines: one connecting the highs and another connecting the lows of price movements. This channel helps traders identify potential buying and selling opportunities based on the price oscillating between these parallel lines.
- Fibonacci Retracements: Horizontal lines on a chart that indicate potential levels of support or resistance based on ratios derived from the Fibonacci sequence. Typical retracement levels are 23.6%, 38.2%, 50%, 61.8%, and 78.6%. Traders use these levels to identify potential entry or exit points for trades based on the observed price movements.
Access Charts on the Fly & Share with Colleagues
Create a template within Technical Charts to easily swap in and out securities or indices of your choosing at a later date. Collaborate seamlessly by sharing your chart settings with your team, enabling them to build on your insights and research. As an added benefit, you can conveniently download these charts as PNG images to include in emails or integrate them into presentation slides for your upcoming client meetings.
The revamped YCharts Technical Charts is a game-changer for investors and analysts seeking a user-friendly, feature-rich tool for price trend analysis. The extensive selection of overlays and oscillators, along with the new annotation capabilities, empowers users to highlight key trends and specific data points, facilitating more informed investment decisions. YCharts’ Technical Charts is your go-to resource for gaining a deeper understanding of market dynamics and enhancing your investment strategy.
Whenever you’re ready, there are 3 ways YCharts can help you:
- Have questions about how YCharts can help uncover technical insights?
Send us an email at hello@ycharts.com or call (866) 965-7552. You’ll be directly in touch with one of our Chicago-based team members.
- Want to try out YCharts’ Technical Charts?
Start a no-risk 7-Day Free Trial.
- Want more insights from YCharts? Subscribe to the Blog.
Disclaimer
©2023 YCharts, Inc. All Rights Reserved. YCharts, Inc. (“YCharts”) is not registered with the U.S. Securities and Exchange Commission (or with the securities regulatory authority or body of any state or any other jurisdiction) as an investment adviser, broker-dealer or in any other capacity, and does not purport to provide investment advice or make investment recommendations. This report has been generated through application of the analytical tools and data provided through ycharts.com and is intended solely to assist you or your investment or other adviser(s) in conducting investment research. You should not construe this report as an offer to buy or sell, as a solicitation of an offer to buy or sell, or as a recommendation to buy, sell, hold or trade, any security or other financial instrument. For further information regarding your use of this report, please go to: ycharts.com/about/disclosure
Next Article
Reduce Client Anxiety with YCharts Custom Stress TestsRead More →