Could You Have Hedged Inflation in 2022 with an ETF?
Inflation reached as high as 9.06% in 2022, ballooning to levels not seen in over four decades.
Seeking to hedge against inflation, many investors often turn to diverse assets such as ETFs. We explored the efficacy of these strategies in our white paper, Can You Hedge It With an ETF?, by replicating a sample 60/40 model portfolio and incorporating varying weights of Invesco DB Commodity Tracking (DBC), iShares TIPS Bond ETF (TIP), iShares 1-3 Year Treasury Bond ETF (SHY), as well as Bitcoin. We then tested the altered portfolios across three recent inflationary periods: 2006-2008, 2015-2018, and 2020-2021.
Read on to find out how these strategies performed through June 2022, the market’s most recent bout with high inflation.
Download the free White Paper to see our full findings:Traditional and Digital Assets: Diverse Approaches to Inflation Hedging
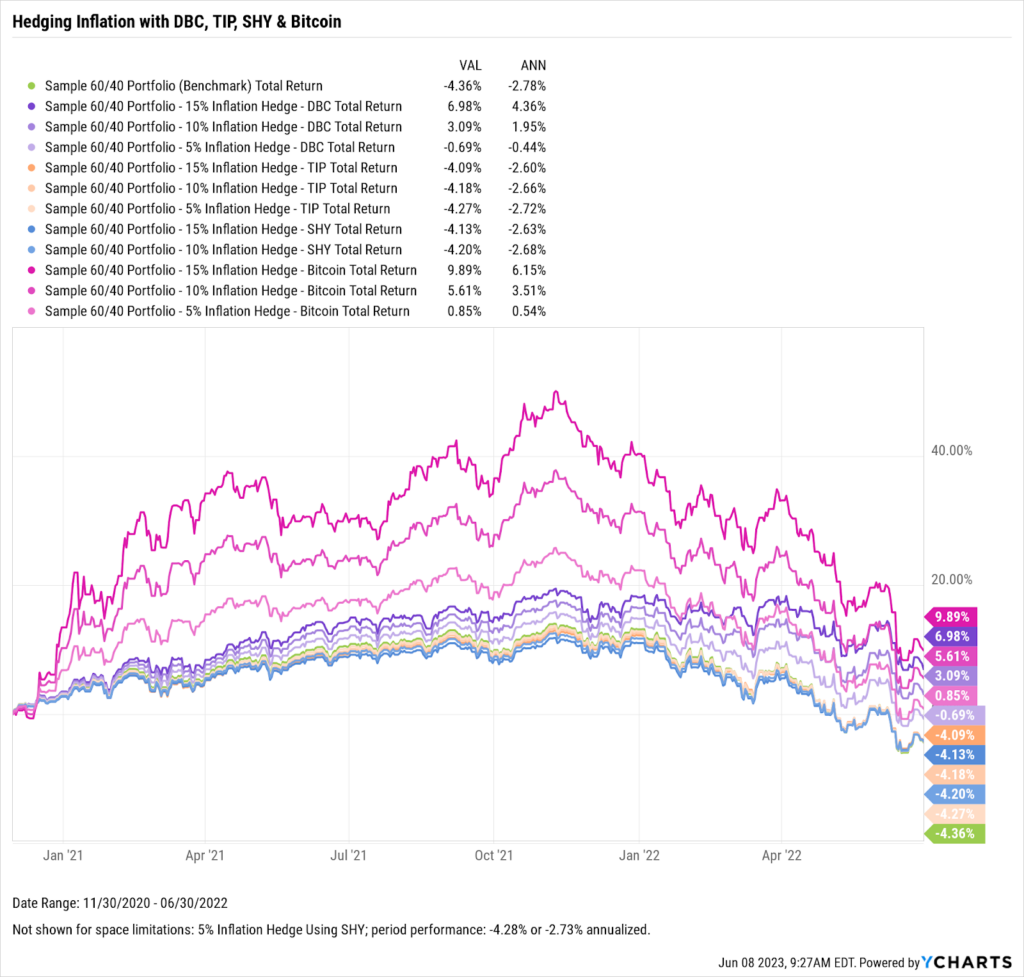
Inflation climbed from 1.17% to 9.06% between November 30, 2020 and June 30, 2022. Every ETF model we tested outperformed the benchmark 60/40 in this period.
Models with hedges of 15% demonstrated the most significant outperformance for all three hedges used. While portfolios hedged with SHY and TIP provided modest outperformance, models containing DBC and Bitcoin actually generated positive returns over the course of the period.
DBC, backed by a diverse range of commodities, provided a tangible, traditional hedge against inflation. Because of their inherent value, commodities often experience price increases during inflationary times.
Conversely, Bitcoin presents a unique approach to potentially hedging against inflation. Because of its intangibility, decentralized nature, and limited supply, Bitcoin has earned the moniker of ‘digital gold. ‘Investing in this alternative store of value produced positive returns regardless of each model’s level of exposure.
These traditional and digital asset classes effectively hedged against inflation across this period. However, the method of protection and risk profile for each are distinctly different.
Download Visual | Modify in YCharts
Seeking Stability: TIPS and Short-Term Treasury Bonds as Inflation Hedges
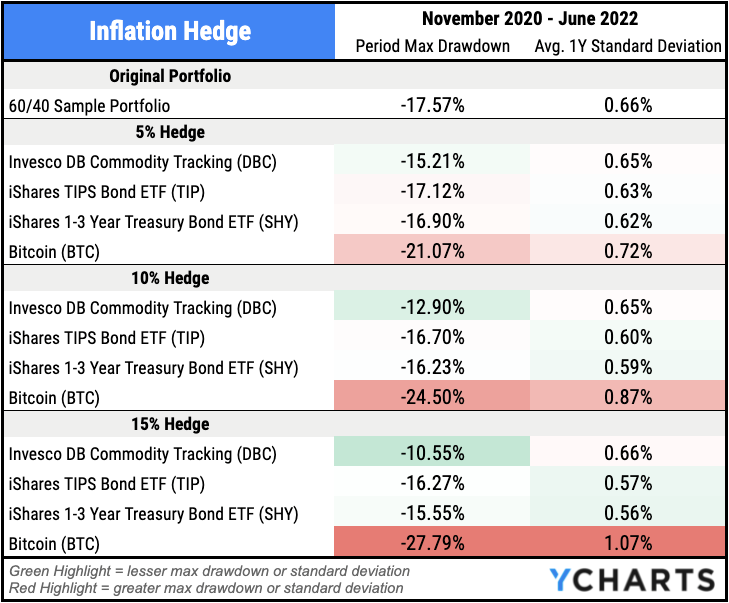
An investor’s risk tolerance is crucial when selecting a suitable inflation hedge. Though it delivered the best performance, it’s worth noting that the 15% Bitcoin hedge also experienced the sharpest drawdown—a considerable 27.79% during the observed period.
All three portfolios containing Bitcoin posed the highest drawdown relative to other tested models and exceeded the benchmark’s drawdown.
In contrast, models hedged with Treasury Inflation-Protected Securities (TIP) and 1-3 year Treasury bonds (SHY) provided the smoothest ride in the face of inflation. These securities are backed by the U.S. government, offering a higher degree of safety. Specifically, TIPS are designed to provide protection against inflation, as their principal value is adjusted based on changes in CPI.
A 15% allocation to TIP or SHY model yielded lower volatility compared to the benchmark, as evidenced by their standard deviations of 0.57% and 0.56%, respectively. For investors seeking more stability and lower risk exposure, TIPs and short-term Treasury bond-based ETFs could be preferable hedges against inflation.
Connect with YCharts
To get in touch, contact YCharts via email at hello@ycharts.com or by phone at (866) 965-7552
Interested in adding YCharts to your technology stack? Sign up for a 7-Day Free Trial.
Disclaimer
©2023 YCharts, Inc. All Rights Reserved. YCharts, Inc. (“YCharts”) is not registered with the U.S. Securities and Exchange Commission (or with the securities regulatory authority or body of any state or any other jurisdiction) as an investment adviser, broker-dealer, or in any other capacity, and does not purport to provide investment advice or make investment recommendations. This report has been generated through application of the analytical tools and data provided through ycharts.com and is intended solely to assist you or your investment or other adviser(s) in conducting investment research. You should not construe this report as an offer to buy or sell, as a solicitation of an offer to buy or sell, or as a recommendation to buy, sell, hold or trade, any security or other financial instrument. For further information regarding your use of this report, please go to: ycharts.com/about/disclosure
Next Article
Monthly Market Wrap: May 2023Read More →