Monthly Market Wrap: May 2023
Welcome back to the Monthly Market Wrap from YCharts, where we break down the most important trends for advisors and their clients in this monthly market review. As always, feel free to download and share any visuals with clients and colleagues, or on social media.
Speaking of visuals: be sure to download our free Monthly Market Wrap slide deck, containing all charts featured in the Market Wrap + more.
Get the Monthly Market Wrap slide deck sent straight to your inbox. Download Here:May 2023 Market Summary
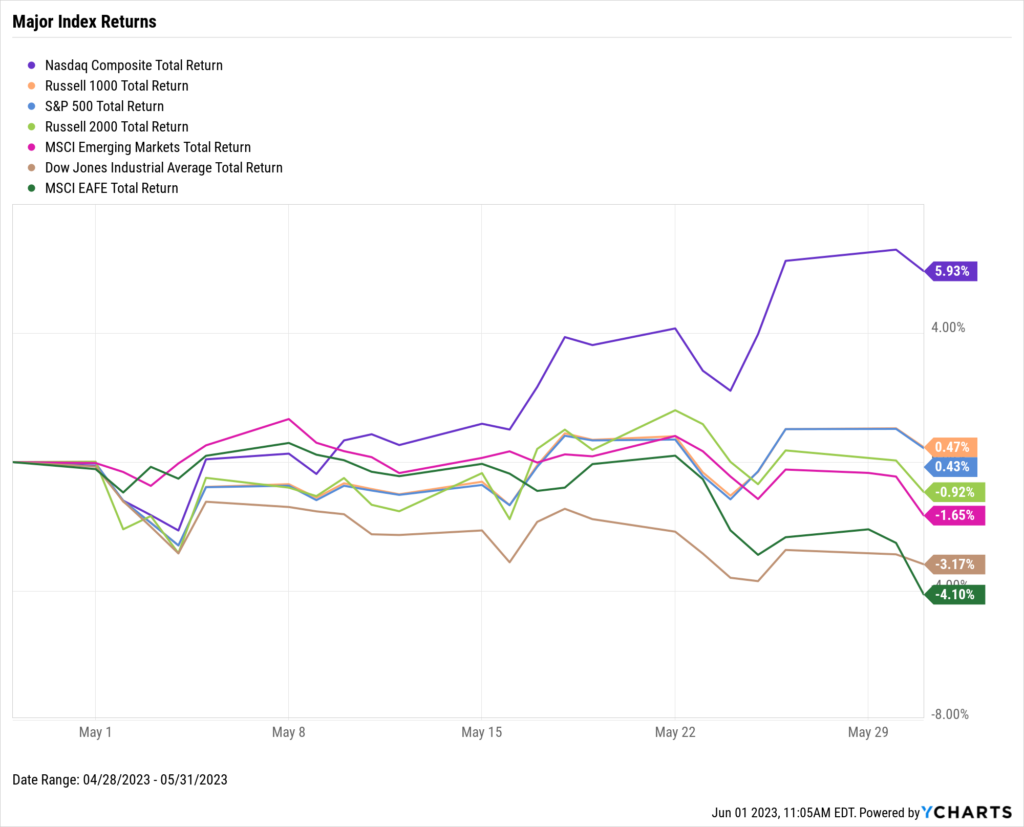
May was a mixed month for stocks as the NASDAQ surged, the S&P remained about flat, and the Dow Jones Industrial Average took a hit. The NASDAQ advanced 5.9% in May largely thanks to stellar gains in the semiconductor space, notably by NVIDIA (NVDA), Advanced Micro Devices (AMD), and Broadcom (AVGO). The S&P 500 rose 0.4%, while the Dow Jones Industrial Average lost 3.2%. It was a down month around the world–Emerging Markets slipped 1.7%, and Developed Markets sank 4.1%.
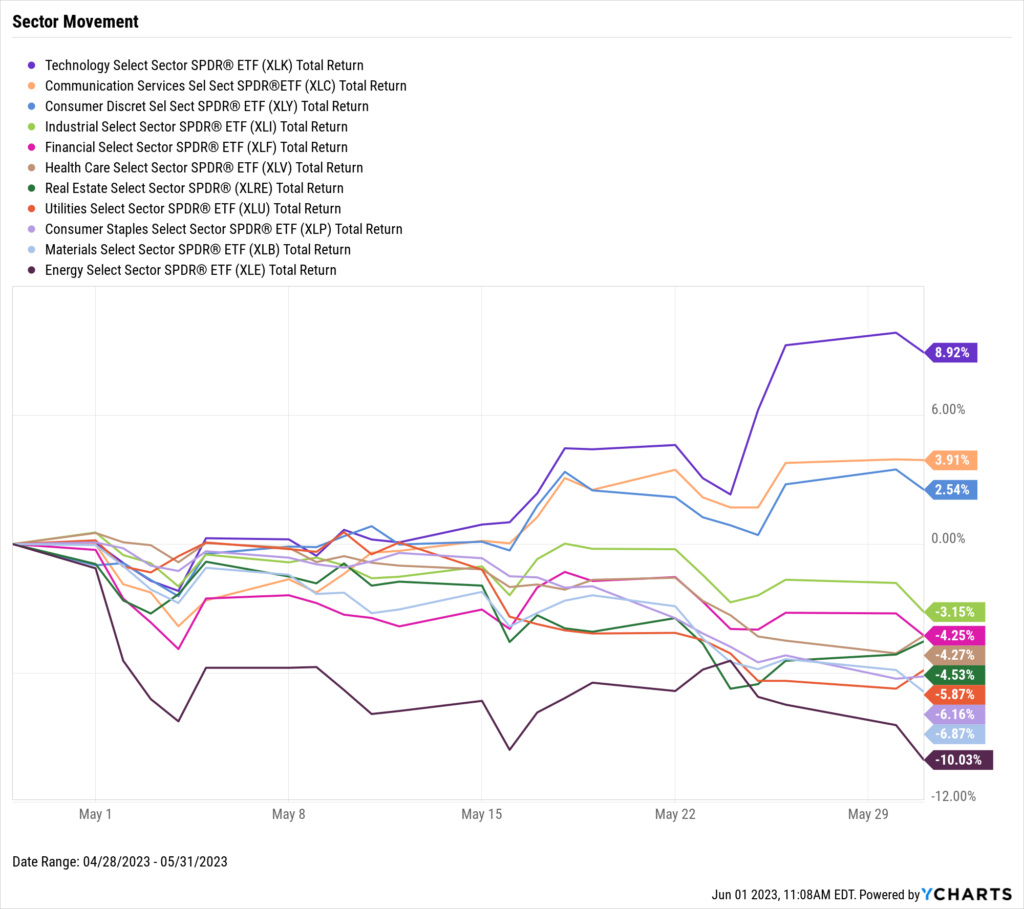
Only 3 of the 11 US stock sectors were positive in May as Technology, Communication Services, and Consumer Discretionary led the way. On the flip side, Energy tumbled 10%, followed by Materials (down 6.9%) and Consumer Staples (down 6.2%).
Unemployment increased by 0.3 percentage points to 3.7% in May one month after retreating back to its lowest level since 1969 (3.4%). Inflation remained essentially unchanged MoM, and the Federal Reserve issued its 10th consecutive rate hike at the start of the month, bringing the Fed Funds Rate to 5.25%. Oil was down over 6.5% in May, bringing both WTI and Brent down over 41% from their highs last year.
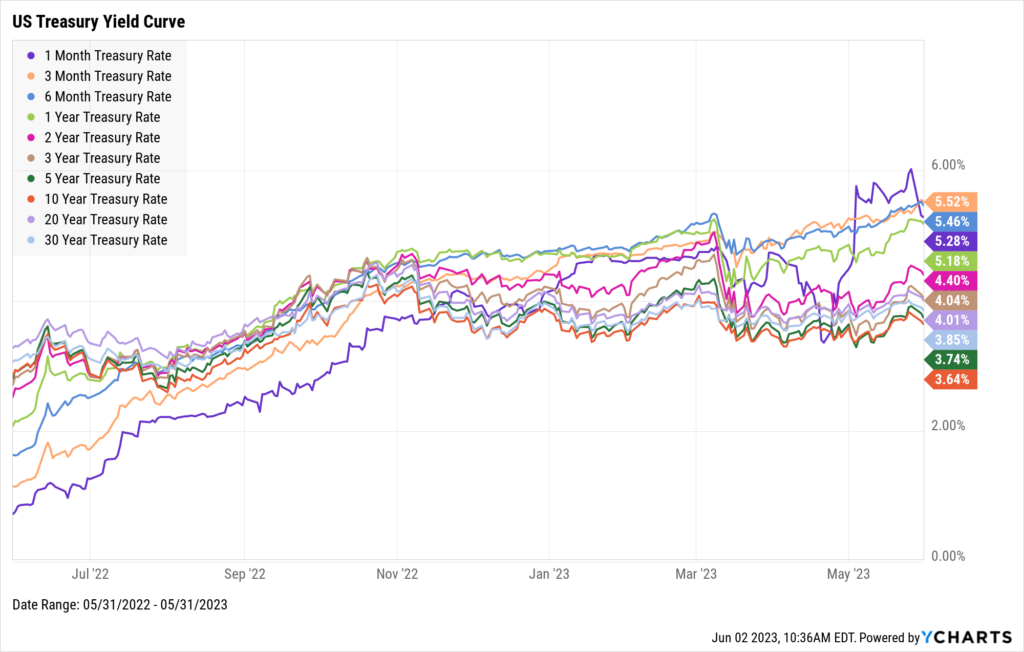
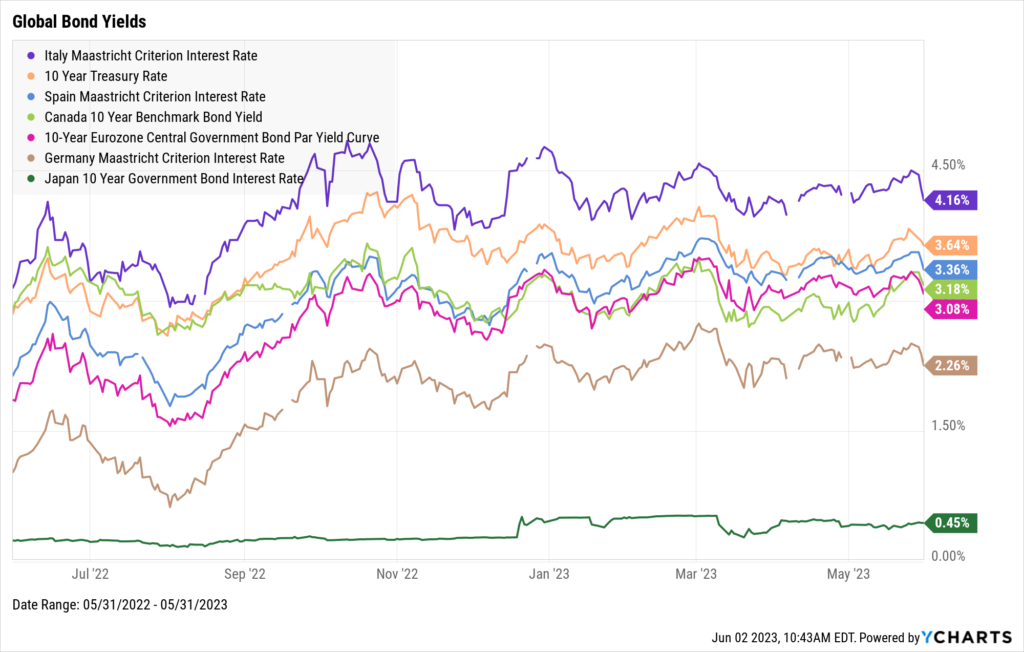
US Treasury yields spiked sharply in May amid debt ceiling risk. The 1-Month Treasury Bill surged a whopping 93 basis points to 5.28%, followed by the 3-Month at 5.52% (+42 bps) and 6-Month at 5.46% (+40 bps). Long-term bonds, such as the 10-Year, also got a lift, but its yield of 3.64% still puts it as the lowest on the curve. The Canada 10 Year Benchmark Bond Yield increased by 34 basis points in May and Japan’s 10 Year Government Bond Interest Rate ticked up 5 bps. Otherwise, global yields fell in May.
Jump to Fixed Income Performance
Want access to full-year charts and data as well? Download our Monthly Market Wrap Slide Deck for more:Off the YCharts! The Newest $1T Club Member
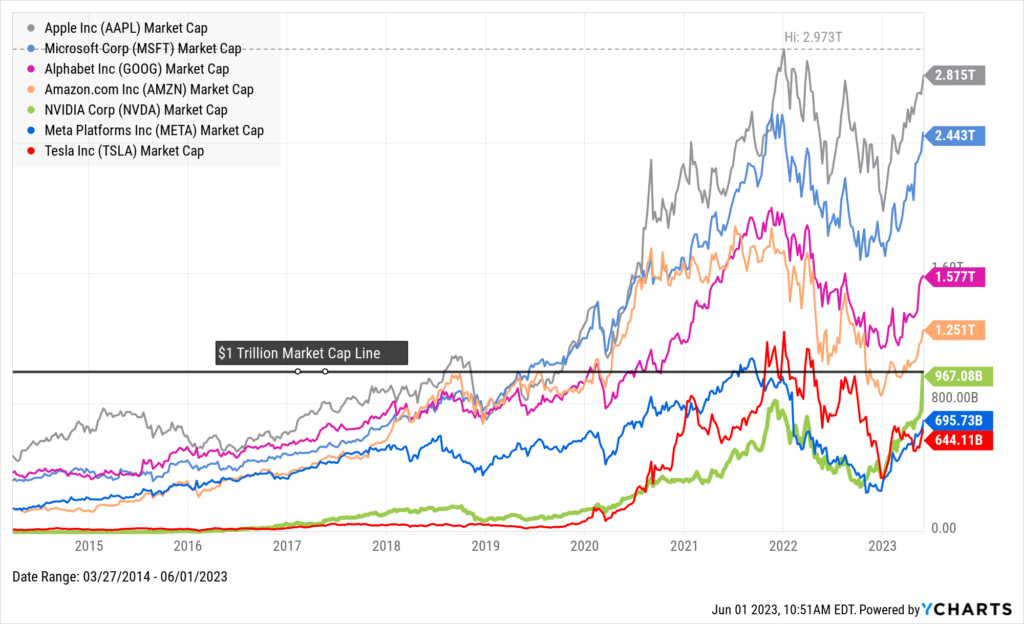
On May 30th, a new member was welcomed into the $1 Trillion Market Cap Club™: NVIDIA (NVDA). Although its club membership was brief, the chipmaker has surged a whopping 167% YTD. If NVIDIA maintains its momentum with another quarter of strong earnings and solid forward-looking guidance, its market cap should be back above $1T soon enough.
Here’s a look at how the seven past and present members of the $1 Trillion Market Cap Club are currently doing:
Download Visual | Modify in YCharts
Equity Performance
Major Indexes
Download Visual | Modify in YCharts | View Below Table in YCharts
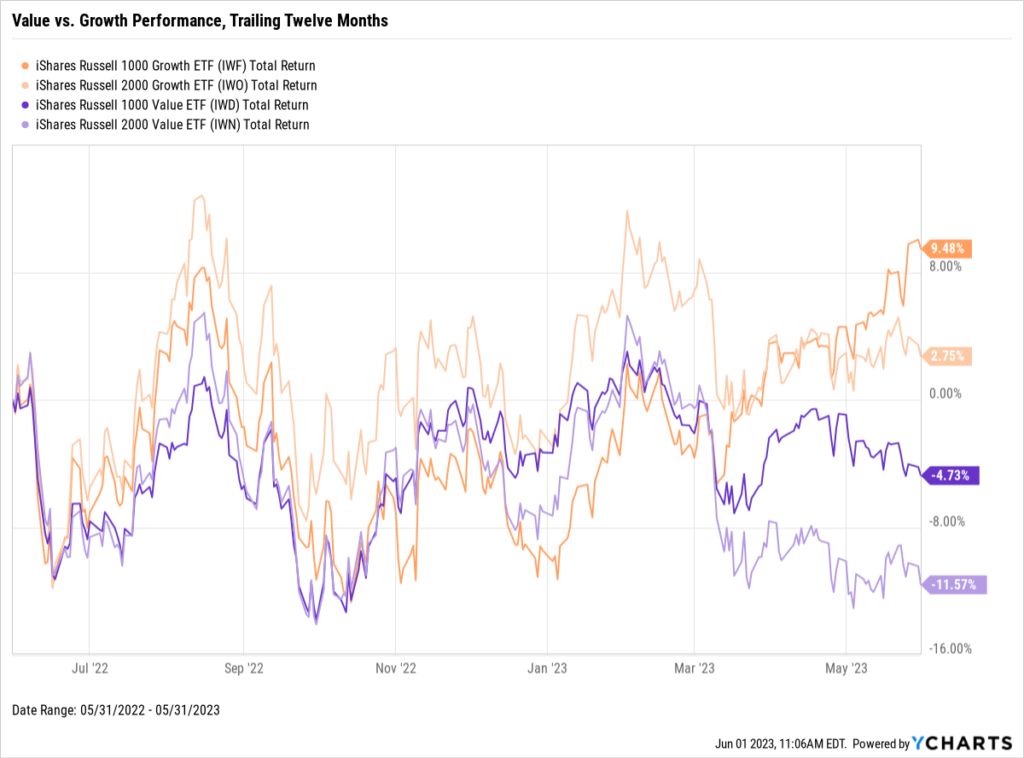
Value vs. Growth Performance, Trailing Twelve Months
Download Visual | Modify in YCharts | View in Comp Tables
US Sector Movement
Download Visual | Modify in YCharts | View Below Table in YCharts
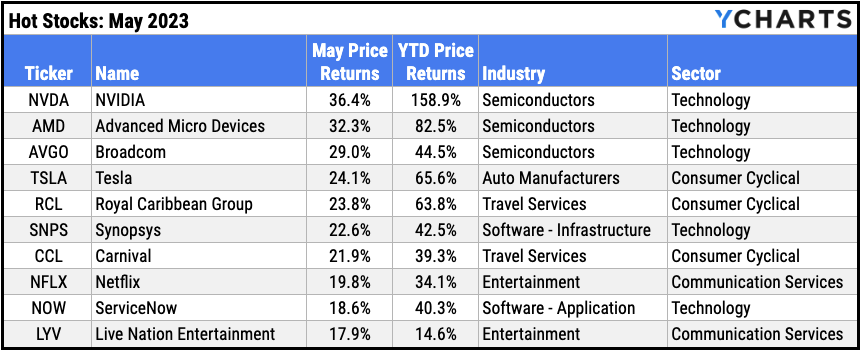
Hot Stocks: Top 10 S&P 500 Performers of May 2023
- NVIDIA (NVDA): 36.4% gain in May
- Advanced Micro Devices (AMD): 32.3%
- Broadcom (AVGO): 29.0%
- Tesla (TSLA): 24.1%
- Royal Caribbean Group (RCL): 23.8%
- Synopsys (SNPS): 22.6%
- Carnival (CCL): 21.9%
- Netflix (NFLX): 19.8%
- ServiceNow (NOW): 18.6%
- Live Nation Entertainment (LYV): 17.9%
Download Visual | Modify in YCharts
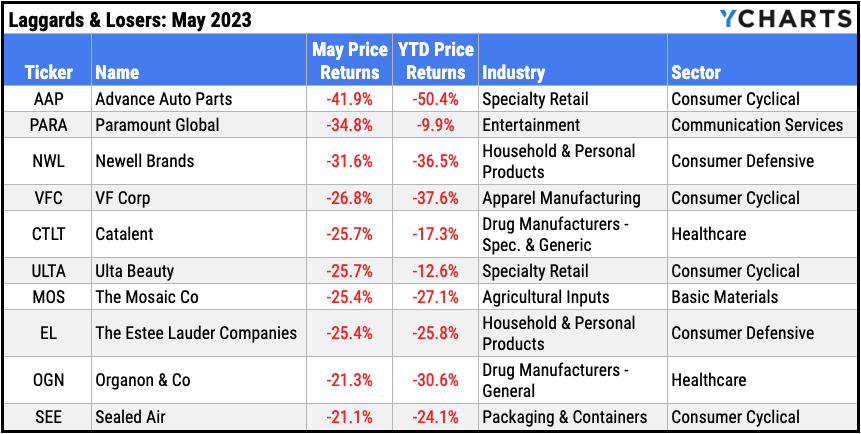
Laggards & Losers: 10 Worst S&P 500 Performers of May 2023
- Advance Auto Parts (AAP): -41.9% decline in May
- Paramount Global (PARA): -34.8%
- Newell Brands (NWL): -31.6%
- VF Corp (VFC): -26.8%
- Catalent (CTLT): -25.7%
- Ulta Beauty (ULTA): -25.7%
- The Mosaic Co (MOS): -25.4%
- The Estee Lauder Companies (EL): -25.4%
- Organon & Co (OGN): -21.3%
- Sealed Air (SEE): -21.1%
Download Visual | Modify in YCharts
Featured Market & Advisor News
Wages Not An Important Driver Of Inflation, Fed Study Finds (FA-Mag)
A Guide to the Shifting Landscape of REITs and Commercial Real Estate (YCharts)
RIAs are embracing compliance as a necessary evil (InvestmentNews)
Embracing Market Turmoil: Staying Invested vs. Exiting During Financial Crises (YCharts)
Former NBA Star Jamal Mashburn: My Advisor Listened to Me (WealthManagement.com)
What Happens After A Fed Rate Hike? (Or Pause)? (YCharts)
Economic Data
Employment
After once again tying its lowest level since 1969 in April, May’s unemployment rate bounced up 3.7%. The labor force participation rate remained unchanged at 62.6% for the third straight month. 253,000 jobs were added in April, firmly beating nonfarm payroll expectations of 180,000 for the month.
Consumers and Inflation
US Inflation was virtually unchanged in April at 4.93%, as was US Core Inflation at 5.52%. Both inflation readings came in less than one-tenth of a percent lower than the previous month. The US Consumer Price Index rose 0.37% in April, and US Personal Spending increased 0.84% MoM. The Federal Reserve hiked the Target Federal Funds Rate by 25 bps at its May 3rd FOMC meeting, bringing it to 5.25%. The Fed Funds rate has now been hiked 500 basis points since the first rate hike 14 months ago on March 16th, 2022.
Production and Sales
The US ISM Manufacturing PMI slipped further into contraction territory in May, falling another 0.2 points to 46.9. US Retail and Food Services Sales rose 0.4% MoM, ending a two-month streak of declines. The YoY US Producer Price Index further cooled down in April, to 2.34%.
Housing
US New Single-Family Home Sales were up 4.1% in April, though US Existing Home Sales slipped 3.4%. Despite the decline in existing home sales, the Median Sales Price of Existing Homes rose by 3.6% to $388,800. Mortgage rates were also on the rise in May; 15-Year and 30-Year Mortgage Rates ended the month at 5.97% and 6.57%, respectively.
Commodities
The price of gold spent the first half of May above $2,000 but ended the month at $1,962.77, down slightly MoM. Oil prices took a breather; the price of WTI per barrel dipped 6.5% to $71.81 and Brent sank 6.8% to $75.77. Both types of crude oil are down over 41% from their highs set in March of 2022. May’s decline in oil prices translated into three cents off the average price of regular gas, to $3.78 per gallon at the end of May.
Cryptocurrencies
The crypto bull run took a pause in May as the price of Bitcoin fell 7.6%, while Ethereum slipped 1.9%. Nonetheless, crypto has enjoyed a remarkable start to 2023. Bitcoin is up 63.7% YTD, and Ethereum is 56.0% higher. May was the first down month for Bitcoin and Ethereum so far in 2023.
Fixed Income
US Treasury Yield Curve
1 Month Treasury Rate: 5.28%
3 Month Treasury Rate: 5.52%
6 Month Treasury Rate: 5.46%
1 Year Treasury Rate: 5.18%
2 Year Treasury Rate: 4.40%
3 Year Treasury Rate: 4.04%
5 Year Treasury Rate: 3.74%
10 Year Treasury Rate: 3.64%
20 Year Treasury Rate: 4.01%
30 Year Treasury Rate: 3.85%
Download Visual | Modify in YCharts
Global Bonds
Italy Long Term Bond Interest Rate: 4.16%
10 Year Treasury Rate: 3.64%
Spain Long Term Bond Interest Rate: 3.36%
Canada 10 Year Benchmark Bond Yield: 3.18%
10-Year Eurozone Central Government Bond Par Yield: 3.08%
Germany Long Term Bond Interest Rate: 2.26%
Japan 10 Year Government Bond Interest Rate: 0.45%
Download Visual | Modify in YCharts
Have a great June! 📈
Get the Monthly Market Wrap slide deck sent straight to your inbox. Download Here:Next Article
A Wholesaler’s Playbook - Boost AUM by Leveraging Fund FlowsRead More →