A Wholesaler’s Playbook – Boost AUM by Leveraging Fund Flows
In today’s intricate investment landscape, understanding the nuances of fund flow analysis is vital for both internal and external wholesalers.
Fund flow analysis offers valuable insights into market sentiment, investor behavior, and can significantly impact the performance of Mutual Funds and Exchange Traded Funds (ETFs).
YCharts clients stay ahead of the curve with our Fund Flows and Strategy Flow Reports. Delivered monthly, this guide simplifies these dynamics with actionable insights to enhance your advisor interactions and turbocharge AUM growth.
Interested in receiving YCharts Fund Flow Reports? Subscribe here:Understanding Fund Flows
Fund flows are the net of a fund’s cash inflows and outflows. Think of them like river currents; when flows move towards (inflows) or away from (outflows) a fund, that creates distinct patterns indicative of investor sentiment towards specific funds, sectors, and even the broader market.
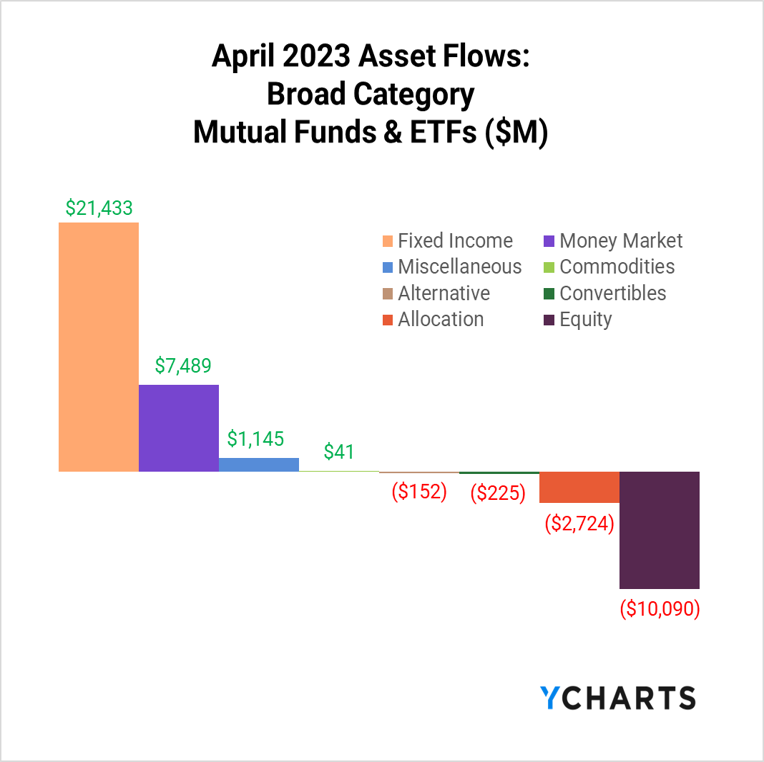
As a wholesaler, identifying these currents can potentially lead to a deeper understanding of market trends. For example, in Q1 2023, Money Market Funds significantly outpaced all other categories–an indicator of investors’ timidness.
As you look for ways to add value for advisors, understanding their client interactions can be invaluable. The insights gained from fund flow data can help guide subsequent discussions with advisors more effectively. Using the Q1 2023 example, advisors could suggest fixed income alternatives in lieu of their clients parking their money on the sidelines, which saw the largest influx of assets in April.
Impact of Fund Flows on Mutual Funds and ETFs
Inflows can elevate a fund’s Net Asset Value (NAV) and boost performance. On the other hand, heavy outflows may force a fund to sell assets, potentially at a low point, decreasing NAV.
With this knowledge, you can strategically manage conversations with advisors to minimize the potential negative impact of fund flows on their clients’ investments.
For instance, if you observe a trend of increasing outflows from a rival fund, it might be a good time to call that advisor about your firm’s superior alternative. YCharts’ Fund Screener makes it easy to spot opportunities and maximize your prospecting call time from there.
To further enhance your use of the Fund Screener, you can leverage the Brokerage Availability feature giving you a deeper understanding of fund flows and the competitive landscape at firms where your products are offered.
Fund Flows as Market Sentiment Indicators
Fund flows can serve as your radar on the market’s mood. An influx of inflows to sector-specific funds? Smooth sailing ahead. Outflows? Brace for choppy waters.
This insight enables you to align your sales pitches with prevailing market sentiment, thereby providing tailored advice to advisors. For example, based on April 2023’s fund flow data, it might have been an excellent time to suggest to an advisor to add any of your family of funds with outsized exposure to defensive consumer equities.
Or, you could’ve explored the allocations of an advisor’s Model Portfolio to determine overexposure to real estate equities. This can then be used as an opportunity to present a replacement fund with more positive momentum.
Mastering fund flow analysis is a valuable asset for wholesalers. It gives you the tools to navigate the financial rapids, understand market conditions, and steer your AUM to new heights. By closely monitoring fund flows, you can anticipate potential market shifts and adjust your sales strategies accordingly, ensuring you’re always on the right course.
Interested in receiving YCharts Fund Flow Reports? Subscribe here:Connect with YCharts
To learn more, schedule time to meet with an asset management specialist, call us at (773) 231-5986, or email hello@ycharts.com.
Want to add YCharts to your technology stack? Sign up for a 7-Day Free Trial to see YCharts for yourself.
Disclaimer
©2022 YCharts, Inc. All Rights Reserved. YCharts, Inc. (“YCharts”) is not registered with the U.S. Securities and Exchange Commission (or with the securities regulatory authority or body of any state or any other jurisdiction) as an investment adviser, broker-dealer, or in any other capacity, and does not purport to provide investment advice or make investment recommendations. This report has been generated through the application of the analytical tools and data provided through ycharts.com and is intended solely to assist you or your investment or other adviser(s) in conducting investment research. You should not construe this report as an offer to buy or sell, as a solicitation of an offer to buy or sell, or as a recommendation to buy, sell, hold, or trade, any security or other financial instrument. For further information regarding your use of this report, please go to: ycharts.com/about/disclosure.
Next Article
A Guide to the Shifting Landscape of REITs and Commercial Real EstateRead More →