Q1 2023 Fund Flows: Recession Apprehension Drives Money Market Flows
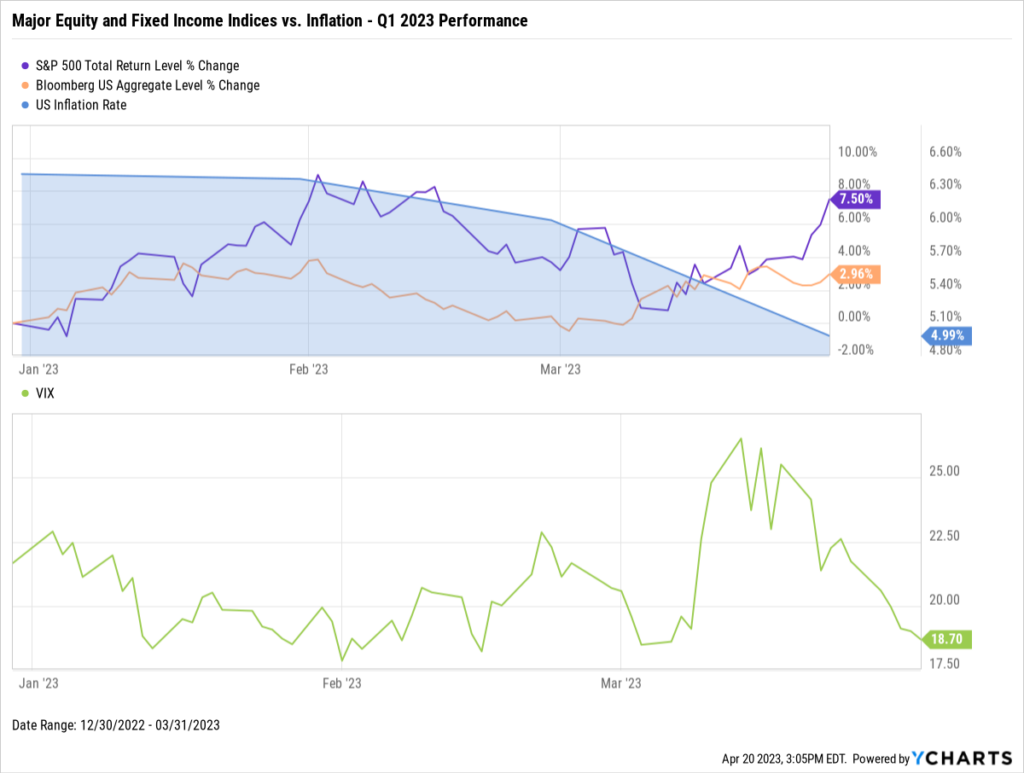
A market reversal and continuation of macroeconomic trends have punctuated the start of 2023. The Federal Reserve completed its ninth straight rate hike in an effort to tame inflation, which came in at 5% as of March 31st, the same level as it was in May 2021. The S&P 500 and Bloomberg US Aggregate rebounded from double-digit losses in 2022. And despite a spike during the Silicon Valley Bank crisis, the VIX has stayed relatively tame during the first three months of the year.
Download Visual | Modify in YCharts
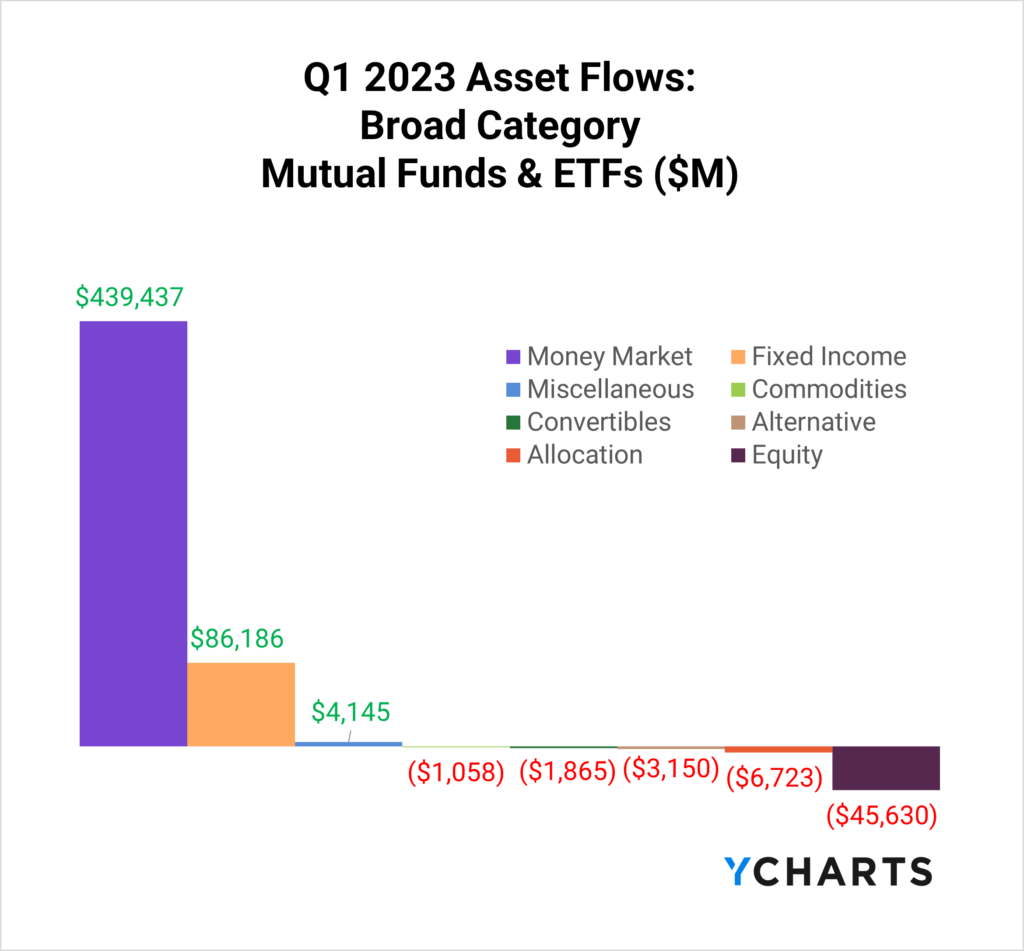
One of the most significant impacts of the Fed’s hawkish agenda has been investor preference toward parking their money on the sidelines, evidenced by the whopping $439B that flowed into Money Market funds during the first quarter of the year.
Fund flows are the net cash inflow into a fund (purchases) or net outflow from a fund (redemptions). Irrespective of fund performance, when a mutual fund or ETF has positive fund flows (or net issuances for ETFs) in a given period, that fund’s managers have more cash to buy more holdings. The opposite is also true: as fundholders sell shares, fund managers sell out of positions and use the cash to pay redemptions.
This means that fund flow data can indicate higher or lower demand for different asset types, depending on which funds and categories have relatively large inflows or outflows.
Interested in receiving YCharts Fund Flow Reports? Subscribe here:Mutual Fund Flows: Biggest Winners and Losers
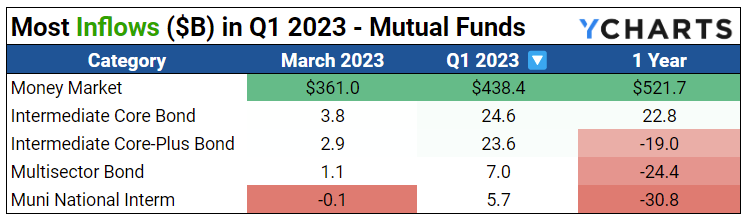
Thanks to more attractive, guaranteed yields and investors’ pessimistic market sentiment, Money Market mutual funds proved to be the most attractive destination for investors’ assets, with $438.4B in inflows in Q1. Additionally, Intermediate Core Bond and Intermediate Core-Plus Bond mutual funds took in a combined $48.2B as investors continued to seek safety.
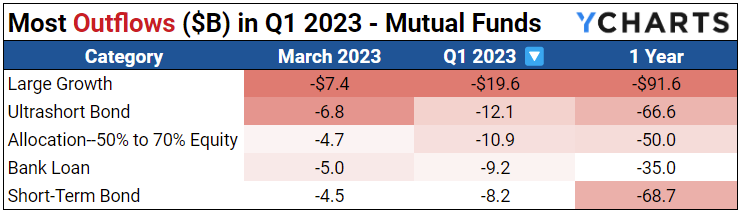
In a continued trend from last quarter, Large Growth equity mutual funds continued to see assets depart, with $19.6B in outflows this quarter. Shorter-term fixed-income instruments like Ultrashort Bond and Short-Term Bond mutual funds watched $12.1B and $8.2B flee their funds, respectively, despite their historical tendency to shield from interest-rate risk.
ETF Flows: Biggest Winners and Losers
In contrast to its mutual fund counterpart, Ultrashort bond ETFs saw a $15.9B influx of new assets. This could be due to various factors, like ETFs’ advantageous tax and fee structure or the flexibility, liquidity, accessibility, and transparency ETFs provide.
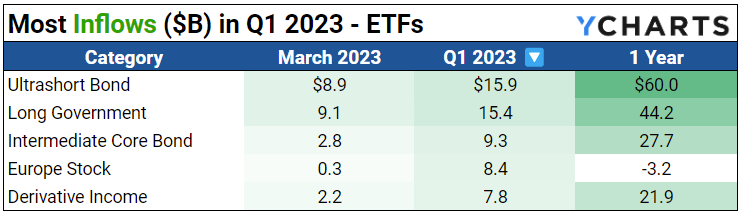
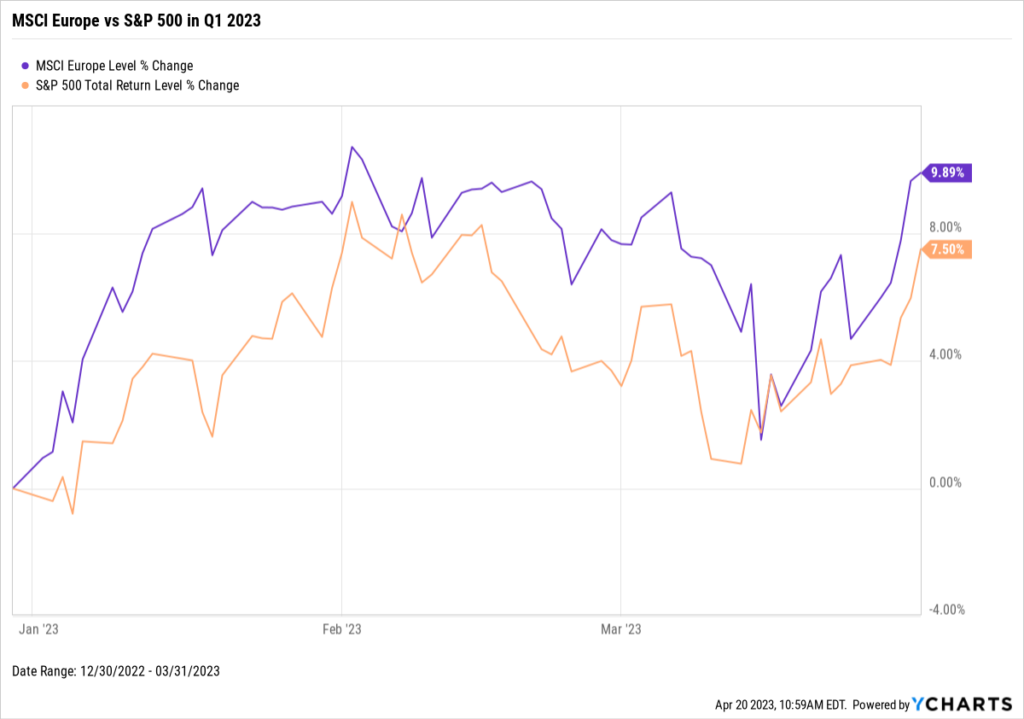
European equity ETFs also saw $8.4B in inflows, likely due to European stocks outperforming US equities to start the year.
Download Visual | Modify in YCharts
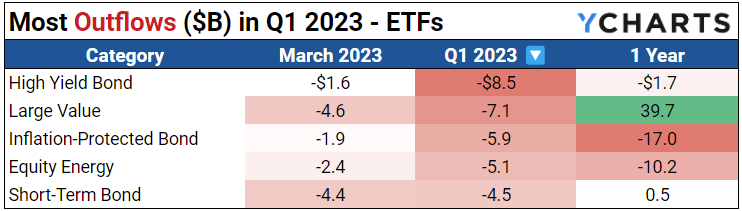
Large Value and High Yield Bond ETFs experienced the most significant outflows, with $7.1 billion and $8.5 billion, respectively. On the equity side, this could be attributed to growth stocks rebounding at the beginning of 2023, while longer-term bonds continue their exodus of assets amid the Fed’s rate hike cycle.
Equity Style Fund Flows and Performance
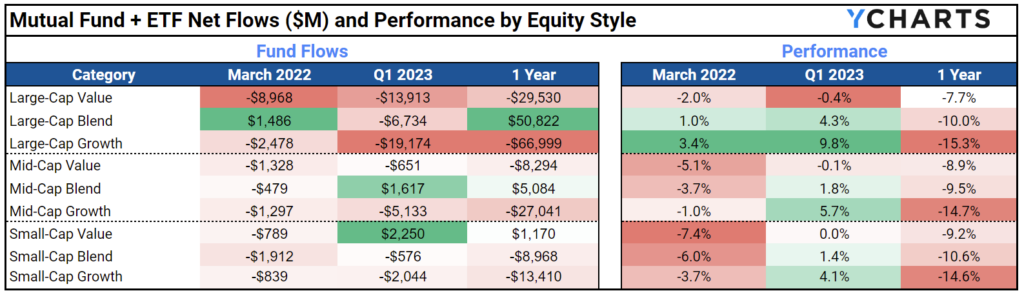
The table below shows a summation of combined mutual fund and ETF fund flows, plus average category performance, for the nine equity-style boxes.
Despite equities producing muted-to-impressive returns, assets have still flowed out of equity funds. This is especially true for the growth space, which saw over $26B of outflows combined, despite growth’s outperformance across all style boxes. This likely suggests that cost-cutting initiatives and subsequent returns to start the year have not been enough to attract investors back to the space.
In an environment where investors can get additional yield on their dollar without taking on significant risk, equity prices or returns will likely have to become more attractive for investors to regain confidence in these assets.
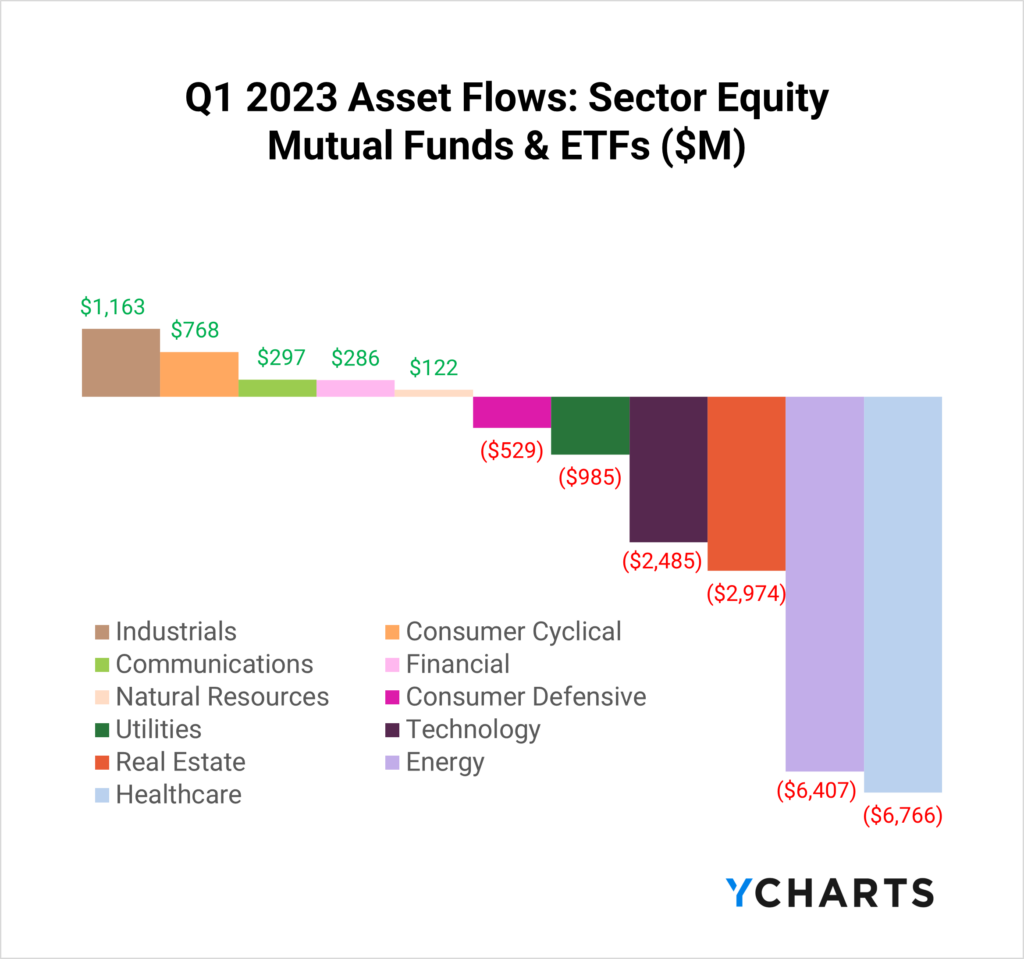
Investor Caution Grows as Outflows Hit High-Performing Sectors
Investors still seem wary of an economic downturn as significant outflows hit some of last year’s highest-performing sectors, including Healthcare and Energy. With other places to park their money, investors may be hedging their bets against potential recessionary risks in different asset classes to start the year.
Connect with YCharts
To learn more, schedule time to meet with an asset management specialist, call us at (773) 231-5986, or email hello@ycharts.com.
Want to add YCharts to your technology stack? Sign up for a 7-Day Free Trial to see YCharts for yourself.
Disclaimer
©2022 YCharts, Inc. All Rights Reserved. YCharts, Inc. (“YCharts”) is not registered with the U.S. Securities and Exchange Commission (or with the securities regulatory authority or body of any state or any other jurisdiction) as an investment adviser, broker-dealer, or in any other capacity, and does not purport to provide investment advice or make investment recommendations. This report has been generated through application of the analytical tools and data provided through ycharts.com and is intended solely to assist you or your investment or other adviser(s) in conducting investment research. You should not construe this report as an offer to buy or sell, as a solicitation of an offer to buy or sell, or as a recommendation to buy, sell, hold or trade, any security or other financial instrument. For further information regarding your use of this report, please go to: ycharts.com/about/disclosure