Value vs Growth: Current Trends, Top Stocks & ETFs
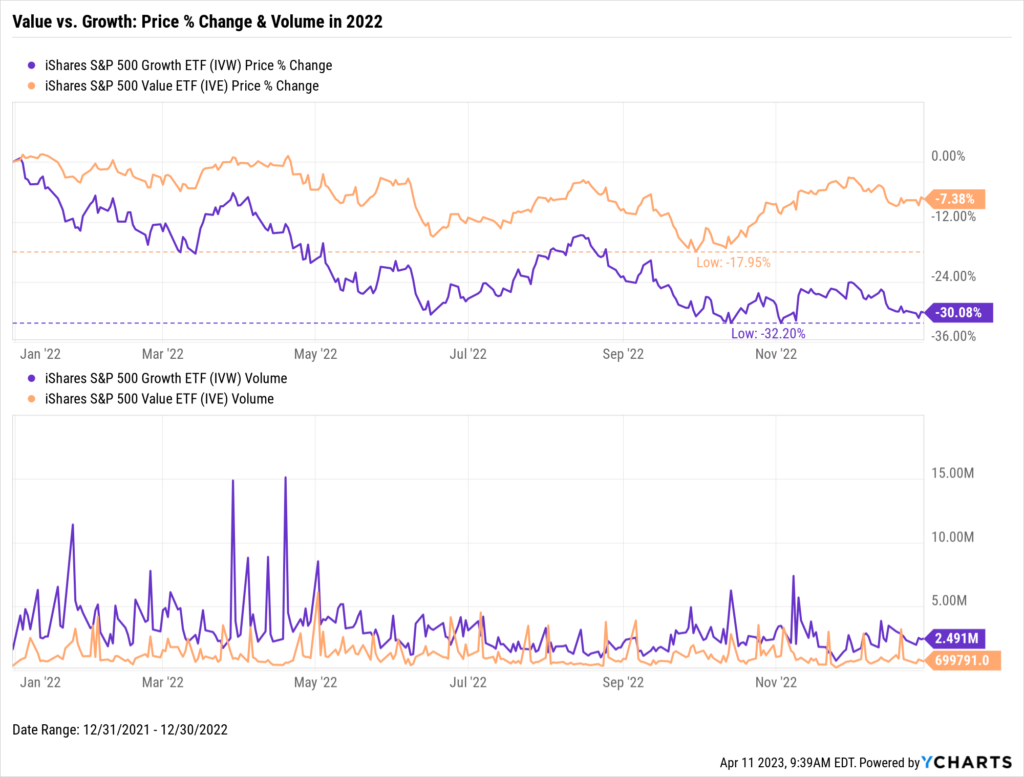
While growth stocks handily outperformed value from 2015 through 2021, 2022 was a different story. Growth stocks, represented by iShares S&P 500 Growth ETF (IVW), sank 30% in 2022. Value, represented by iShares S&P 500 Value ETF (IVE), significantly outpaced growth all year, though the ETF still logged a negative performance.
Download Visual | Modify in YCharts
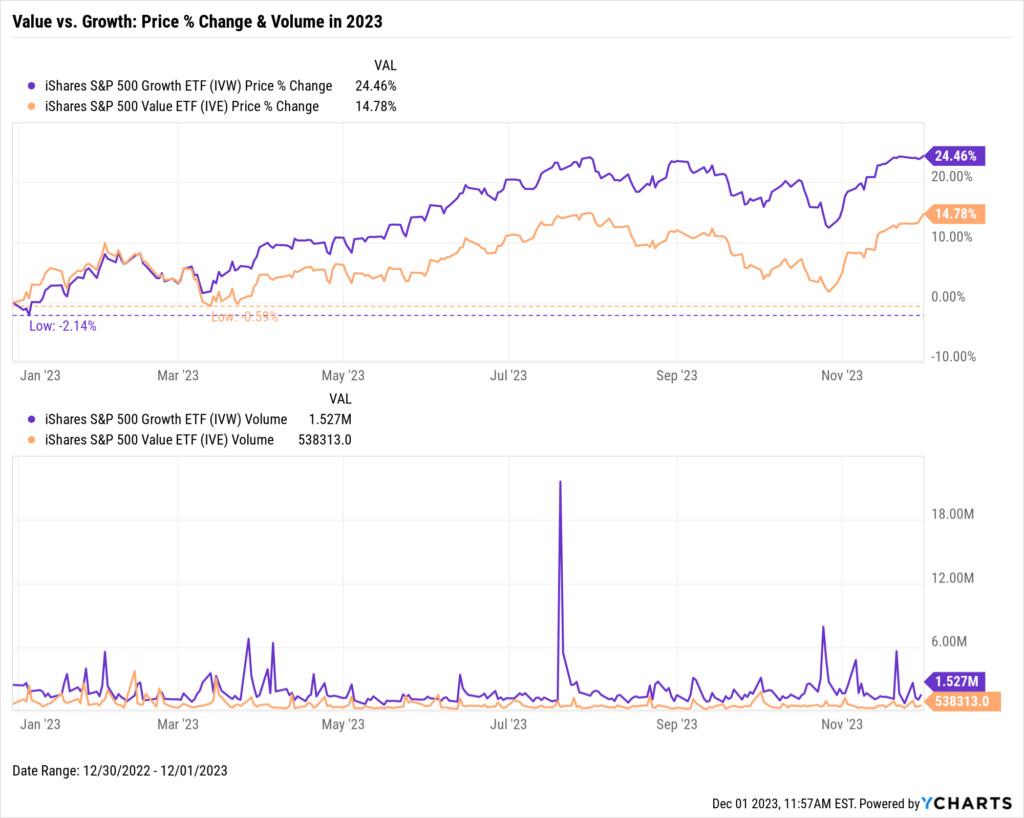
2023 is proving to be a rebound for equities. After moving in near-perfect lockstep with each other for the first two months of the year, the Growth equity style broke out to the upside, advancing 24.5% year to date. Albeit at a less intense 14.8% gain, Value has risen in a similar pattern as well. Additionally, IVW has seen consistently more trading volume than IVE across most time horizons as well.
Download Visual | Modify in YCharts
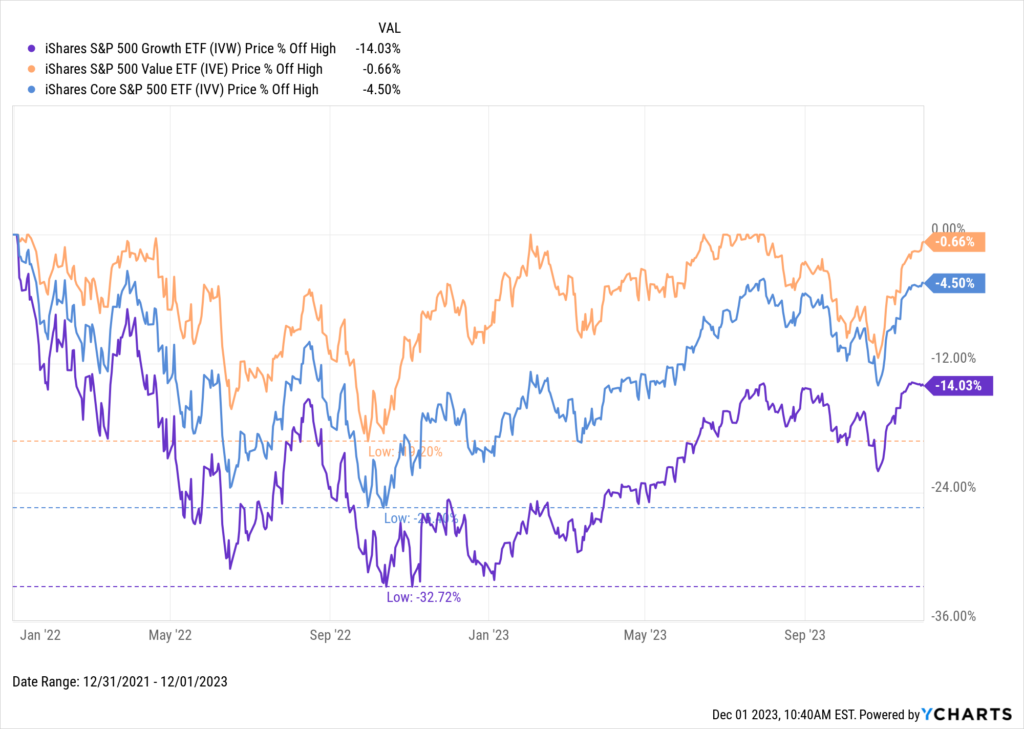
The S&P 500 index has significantly bounced back from its October 2022 low. Value set new highs in August, followed by a correction in September and October that pushed Value 5.4% away from retaking its all-time high. However, after a rally in November, IVE is within 1% of its ATH, while the benchmark index is 4.5% off its ATH.
Download Visual | Modify in YCharts
A major catalyst for Growth’s significant outperformance over Value and the S&P this year is its overweighting in the Magnificent Seven stocks, which have propelled major indices forward all year. IVW’s combined 38.72% weighting in Apple (AAPL), Microsoft (MSFT), NVIDIA (NVDA), Alphabet (GOOG, GOOGL), Amazon (AMZN), and Tesla (TSLA) dwarfs IVV’s 26.34% in the same stocks.
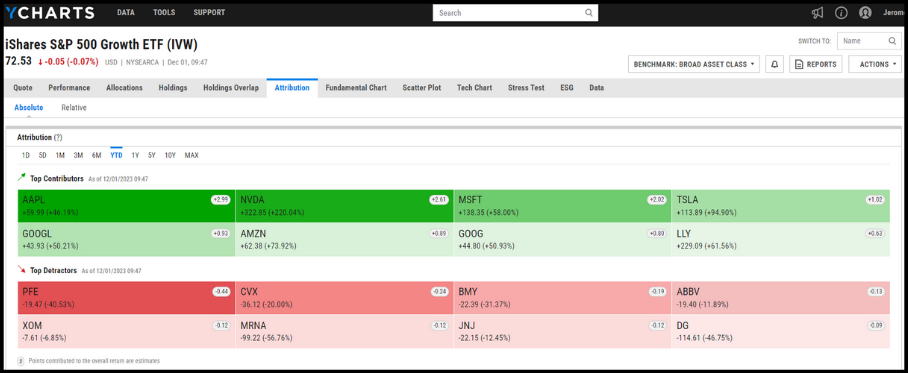
Discover What Else is Driving IVW’s Performance with Attribution
The Long-Term Story of Value vs. Growth
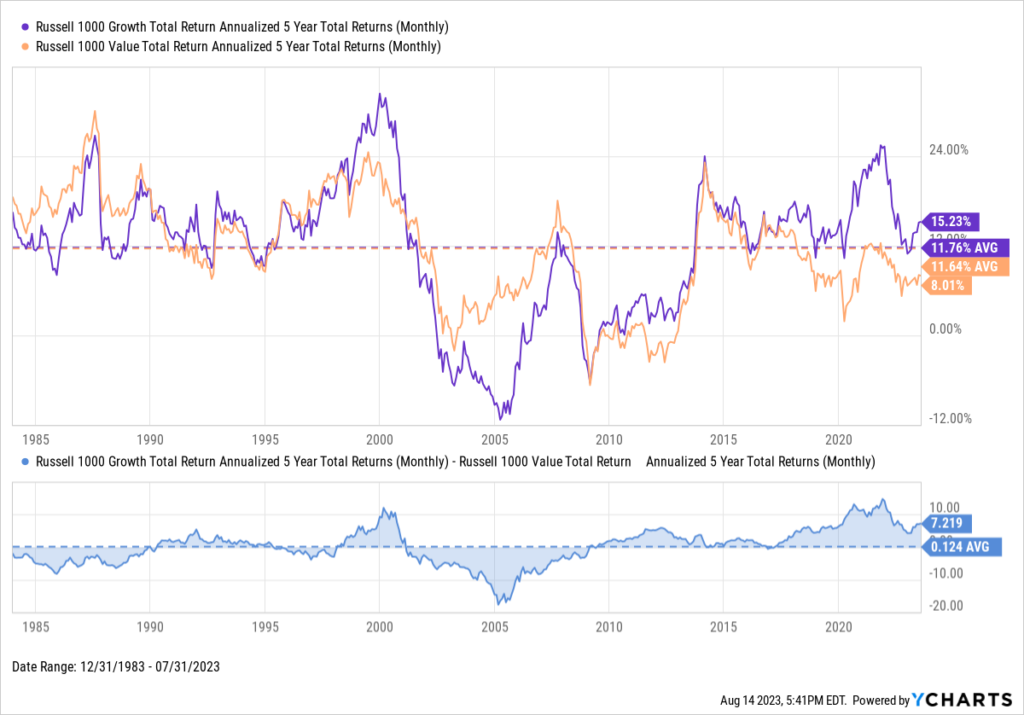
Value and growth have each outperformed the other over certain periods. There’s been a steep divergence between growth and value in recent years, but growth’s steep drawdowns in 2022 have narrowed that gap.
The chart below was taken from our latest advisor resource, The Top 10 Visuals for Client & Prospect Meetings slide deck. The top half shows rolling five-year annualized total returns for the Russell 1000 Growth and Russell 1000 Value indices since the early 1980s, with the two regularly trading the lead. The lower panel illustrates the spread between the two, with a value above zero representing growth outperforming value. Despite 2022 being an especially rough year for growth, its trailing five-year annualized returns are still six percentage points higher than that of value.
Whether you’re Team Value or Team Growth, taking either path 40 years ago would’ve brought you to the same place today as both styles’ average annualized five-year total returns are nearly identical.
Download Visual | Modify in YCharts
It’s easy to get carried away when one equity class significantly outpaces the other. Still, when deciding between value and growth investing, it’s important to consider cyclicality and your personal investment objectives and time horizon. To help in your decision-making, we’ve outlined below the most important characteristics of each approach, how value and growth compare in terms of performance, and several ways YCharts helps uncover the best strategy for you and your clients.
Download the free Slide Deck, The Top 10 Visuals for Client & Prospect Meetings, for more insights:The Top Growth & Value Stocks
The Top Growth Stocks
The Top Growth Stocks table is based on this YCharts Stock Screen narrowed to Russell 1000 Growth index constituents. The Top 10 Growth Stocks are sorted in order of 1-year price returns.
The Top 10 Growth Stocks as of 11/30/2023 according to this criteria are:
The Top Value Stocks
Similarly, the Top Value Stocks table is based on this YCharts Stock Screen narrowed to Russell 1000 Value index constituents. The Top 10 Value Stocks are sorted in order of 1-year price returns.
The Top 10 Value Stocks as of 11/30/2023 according to this criteria are:
The Top Growth & Value ETFs
The Top Growth ETFs
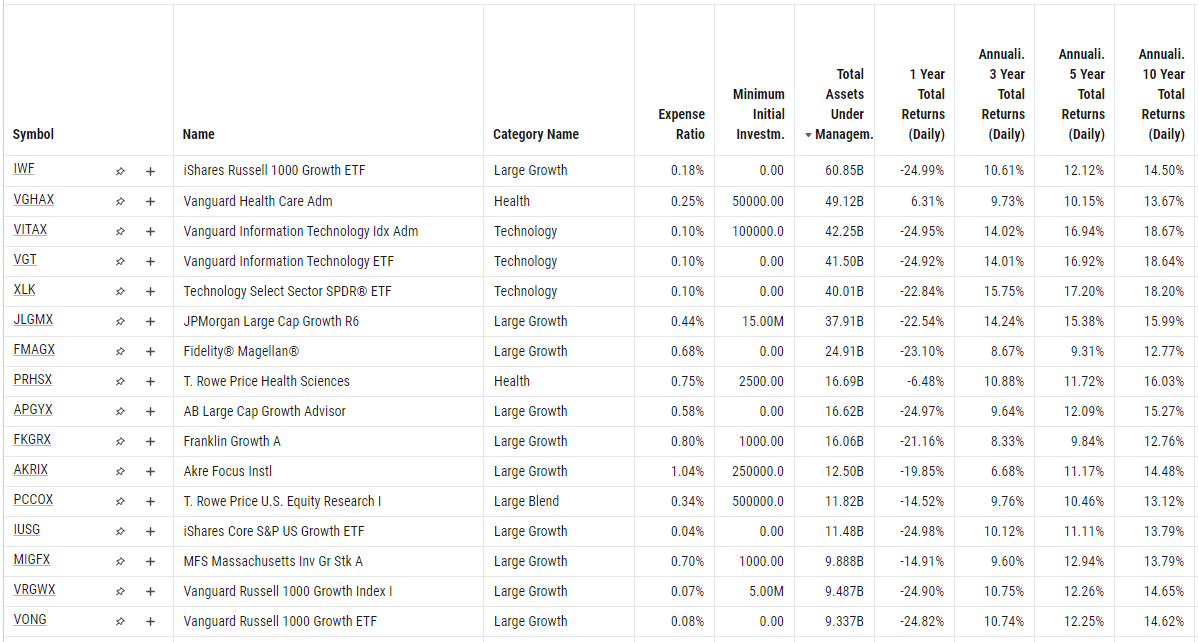
The Top Growth ETFs table is based on this YCharts Fund Screen narrowed to constituents listed on major US exchanges classified in the Large Cap Growth ETF equity style (excluding leveraged and inverse ETFs). The Top 10 Growth ETFs are sorted in order of 1-year price returns.
The Top 10 Growth ETFs as of 11/30/2023 according to this criteria are:
The Top Value ETFs
Similarly, the Top Value ETFs sortable table is based on this YCharts Fund Screen narrowed to constituents listed on major US exchanges classified in the Large Cap Value ETF equity style (excluding leveraged and inverse ETFs).
The Top 10 Value ETFs as of 11/30/2023 according to this criteria are:
Defining Value and Growth
Value investors try to identify companies with solid fundamentals that they believe are undervalued by the market. Growth investors look for companies that demonstrate rapid revenue growth but have yet to reach scale or their full growth potential. It’s difficult to say which approach is superior because market conditions fluctuate, as do sector returns.
The key characteristics of value stocks and funds are:
- Undervalued compared to their peers: Value stocks trade at lower valuations than other companies in their sector or industry. When share prices fall, but a company’s underlying fundamentals remain strong, value stocks become “affordable” in the short-term and hopefully lead to long-term gains.
- Lower P/E Ratios than the broad market: Even beyond a company’s closest competitors, value stocks are generally lower-priced than the broader market in terms of price-to-earnings (P/E) ratio, especially compared to growth stocks.
- Less growth but reliable income streams: Usually larger and more established businesses, earnings of value stocks grow at modest but consistent clips. Because of their sizes, many companies opt to pay significant amounts of earnings directly to shareholders in the form of dividends rather than reinvest them back into the business.
- Less volatile than the broad market: Because value stocks are priced more conservatively, share prices often move less than the market average, and expectations are lower when companies report earnings. But the trade-off to price stability may be a longer holding period until payout, so value stocks are well-suited for long-term investors.
The key characteristics of growth stocks and funds are:
- Track record of earnings and revenue growth: Growth stocks are typically less mature but have grown their revenue and earnings at a better-than-average rate in recent years, and are expected to continue doing so. Often, growth companies will ignore profitability to continue pushing revenue results. Consistently high growth rates for key top and bottom-line metrics justify their relatively higher valuations.
- Higher P/E Ratios than the broad market: Because investors expect their earnings to continue growing, growth stocks carry high valuations such as above-average P/E, price-to-book (P/B), and price-to-sales (P/S) ratios. A strong Forward P/E, which considers estimates made by the company and Wall Street analysts, indicates an expectation of continued growth for these companies.
- More growth with less reliable return on investment: Growth companies typically opt to reinvest earnings instead of paying dividends to shareholders. This makes an investor’s ROI dependent on the share price increasing, but when a growth stock plows earnings back into the business, it increases the likelihood of capital appreciation.
- More volatile than the broad market: Due to their higher valuations, prices of growth stocks tend to be more volatile than the market average. When share prices are already lofty, they can plummet quickly if a company misses expectations or when negative news surfaces.
Performance of Value vs Growth Stocks <H2>
Market cyclicality is an important factor when comparing value vs. growth performance.
Growth stocks generally perform better during bull markets, when interest rates are falling, and when corporate earnings are trending up. However, during economic slowdowns, growth tends to lag behind value. Similarly, value tends to outperform growth during bear markets and in the early stages of economic recovery.
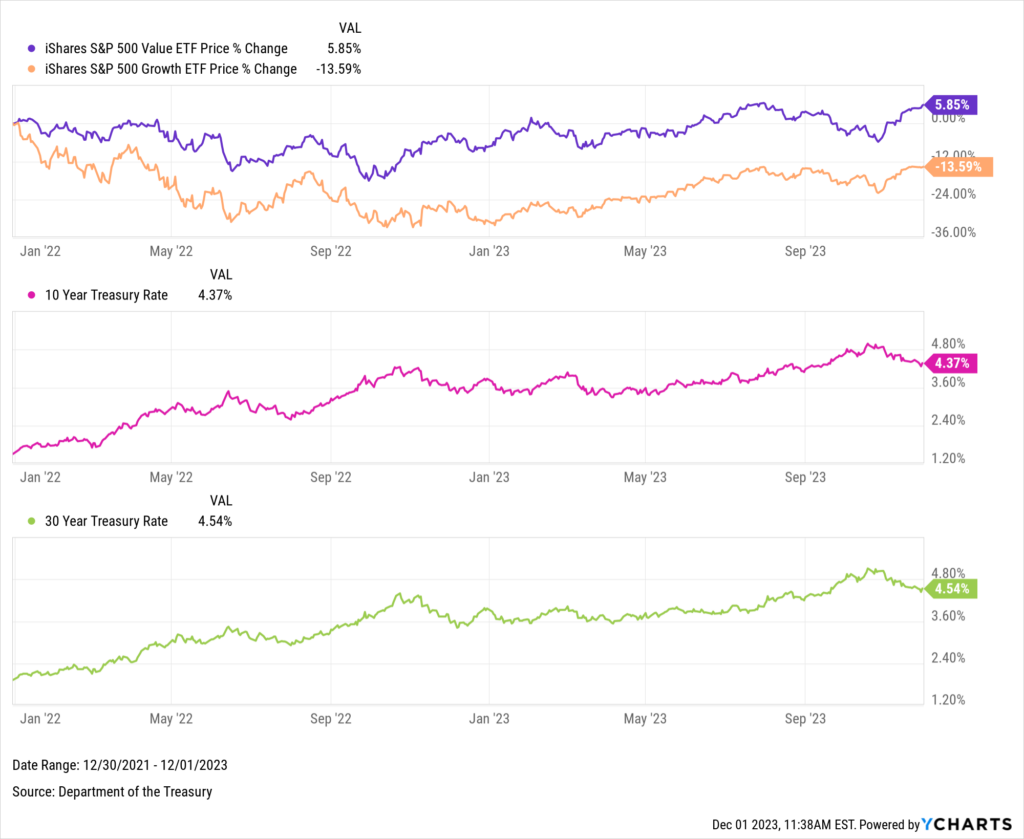
For instance, the spike in long-term treasury bond rates last year. As interest rates rise and future cash flows are increasingly discounted, investors will likely rotate out of growth stocks and into less risky or speculative assets, such as value stocks and fixed income.
Treasuries traded sideways for most of the year, so investors returned to growth stocks in 2023, but as Treasuries crept closer to 5%, the spread between value and growth equities narrowed.
Download Visual | Modify in YCharts
Company size (given by market capitalization) is also often a contributing factor. When further breaking down value and growth companies by size, such as large, mid, and small market capitalizations, more nuanced performance differences appear. There are over 77,000 funds available in YCharts, including some popular value and growth ETFs with strategies that incorporate market cap:
Large-cap funds:
Invesco Dynamic Large Cap Value ETF (PWV) and Growth ETF (PWB)
Nuveen ESG Large-Cap Value ETF (NULV) and Growth ETF (NULG)
Schwab US Large-Cap Value ETF (SCHV) and Growth ETF (SCHG)
Mid-cap funds:
iShares Morningstar Mid-Cap Value ETF (IWS) and Growth ETF (IWP)
Nuveen ESG Mid-Cap Value ETF (NUMV) and Growth ETF (NUMG)
Vanguard Mid-Cap Value ETF (VOE) and Growth ETF (VOT)
Small-cap funds:
Opus Small Cap Value Plus ETF (OSCV)
Vanguard Small-Cap Value ETF (VBR) and Growth ETF (VBK)
Using YCharts to Compare Value and Growth Stocks
YCharts features several tools and data sets to enable more informed comparisons of value vs. growth stocks, or value funds vs. growth funds:
Create Value vs. Growth Stock Visuals
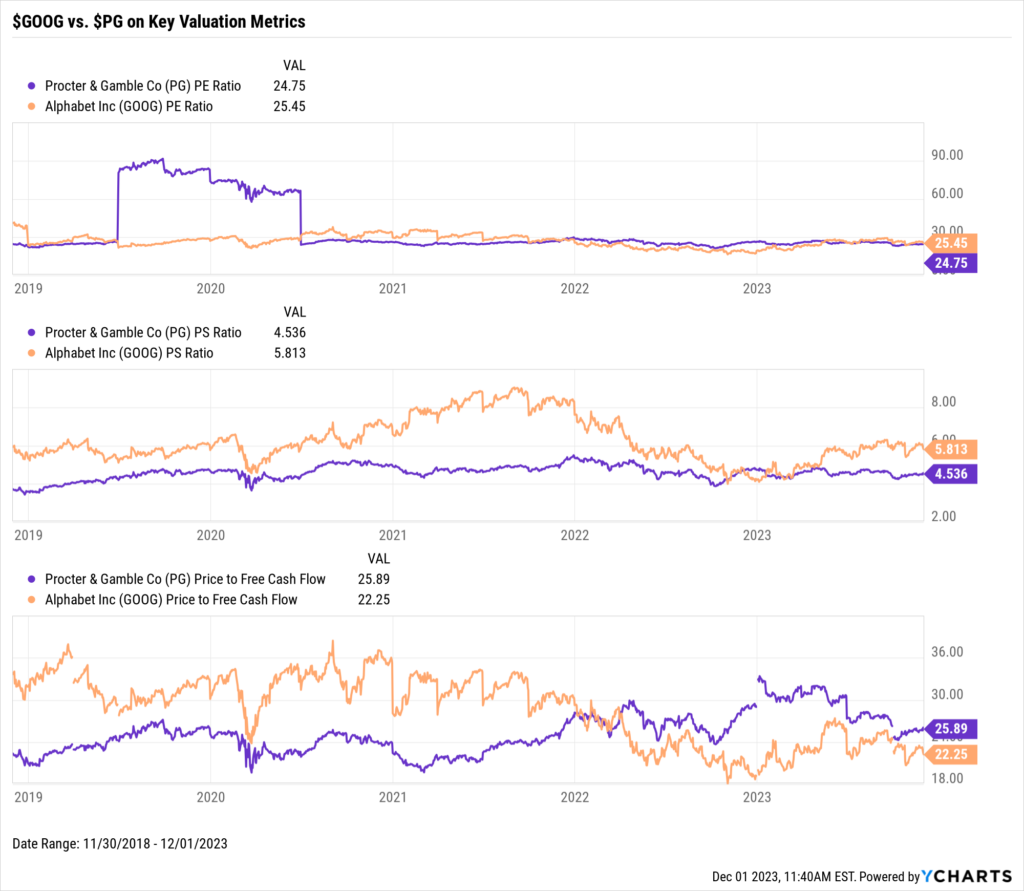
The charts above illustrate long-term performance for value and growth strategies, but what about individual stocks and the metrics that define them? Use Fundamental Charts to compare two companies based on underlying metrics defining value and growth opportunities over any period. For example, put the P/E, P/S, and price-to-free cash flow ratios for Alphabet (GOOG) and Procter & Gamble (PG), two common top holdings in growth and value funds, respectively, head-to-head.
Download Visual | Modify in YCharts
Generate Side-by-Side Comparison Reports
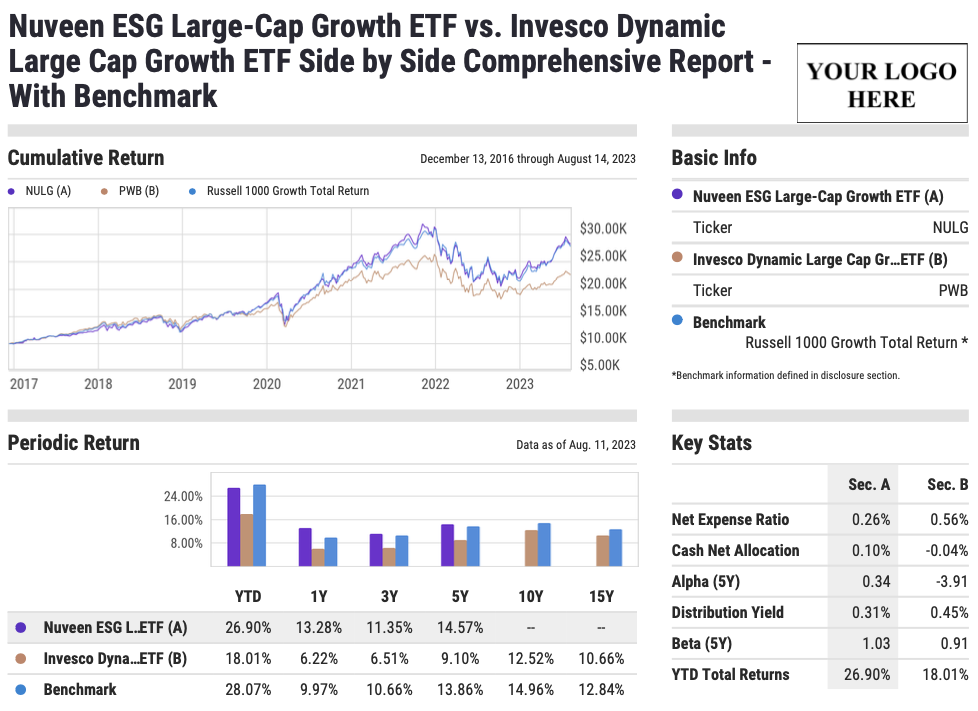
To compare growth and value funds in a client-friendly format, build a Side-by-Side Comparison report.
The example below pits two growth ETFs, Invesco’s Dynamic Large Cap Growth ETF (PWB) and Nuveen’s ESG Large-Cap Growth ETF (NULG), head-to-head on factors like holdings, performance, risk, and fees. Sending over a comparison report between the two funds can be accomplished in just a few mouse clicks, saving you time while ensuring your client gets the information they need swiftly.
Download Visual | View Side-by-Side Report
These quick and easy-to-generate comparison reports provide a world of value for investors and their clients, ensuring visually appealing and straightforward analysis with an immediate impact.
Screen for Value and Growth Stocks, Funds & ETFs
Whether your mind is already made up on value vs. growth, or you want to dig a little deeper, the YCharts Stock and Fund Screeners narrow in on the best equities and funds for your portfolio. The YCharts Screeners feature several pre-built templates to make finding new investment opportunities easier.
The Trailing Revenue, EPS, and Cash Flow Growth screen, one of many growth-focused Stock Screener templates, finds stocks with strong revenue growth, earnings-per-share (EPS) growth, and cash from operations growth over several timeframes. Other pre-built templates include the growth-focused Forecasted Growth Screen and Relative Value Stocks and Dividend Growth Over Time for value-minded investors.
Evaluating value and growth mutual funds and ETFs is a slightly different analysis. With all fund managers trying to pick the best stocks, you can compare and contrast managers’ success by looking at those funds’ performance and risk metrics. Templates like Top Growth Funds and Top Value Funds help identify the best-performing funds of both styles:
Download Visual | Modify in YCharts
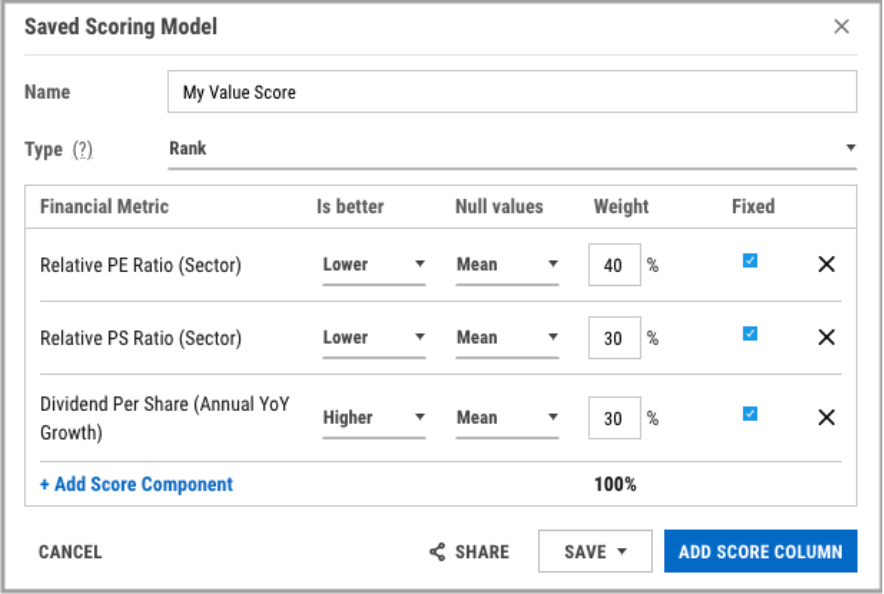
Build Custom Scoring Models for Value and Growth Stocks
Once you have a more manageable list of securities (like the results from the screen above), use Scoring Models to create a custom score or ranking using the metrics you find most important. For example, the Value Score below incorporates relative P/E ratio, relative P/S, and dividend per share growth at varying weights to compare several value stocks against each other.
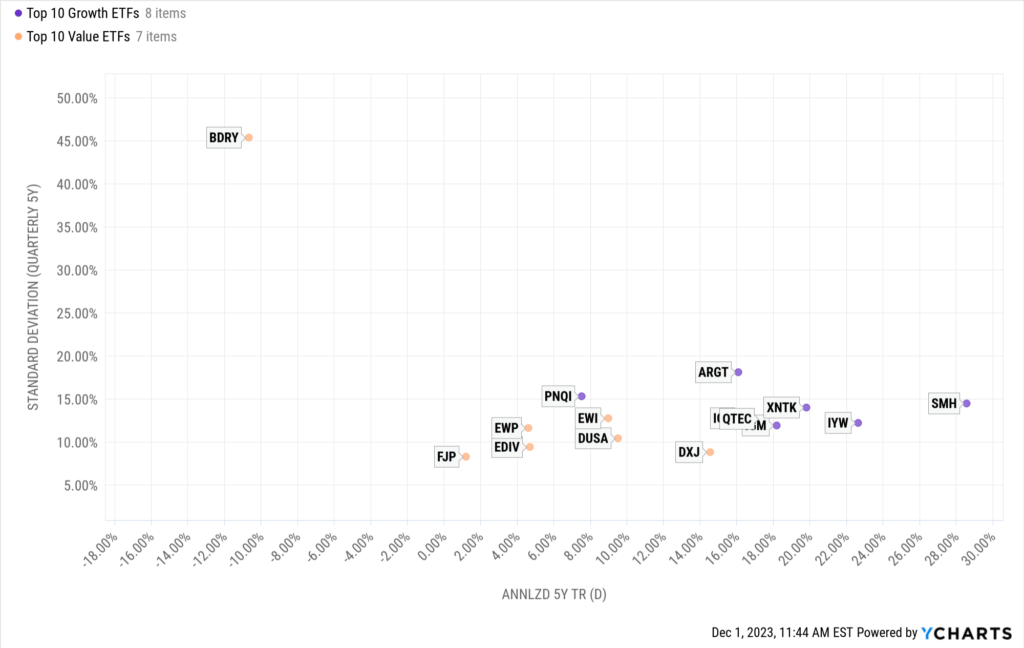
Illustrate Risk vs. Reward with Scatter Plot
Looking for a more visual tool to conduct security analysis? Go beyond data tables using a Scatter Plot to paint a pros vs. cons picture for a group of securities. The Scatter Plot below shows the risk and reward of the top individual Value and Growth holdings over an example five-year lookback:
Value vs Growth: Which Is Better For You?
Your preference for, or belief in, value vs. growth typically comes down to your investment objectives, risk tolerance, and time horizon. You may also prefer to achieve exposure to growth, value, or both via mutual funds, ETFs, or individual stocks.
Some general rules of thumb: growth may be right for you if you’re comfortable with larger price movements and don’t need current income (by way of dividends), and you might prefer value if you’re looking for more stable investments that regularly pay dividends.
There’s also a case to be made for including both value and growth in your portfolio to smooth out times of volatility and still keep pace when the market starts to run. “Blend” funds, created by asset managers, have emerged to achieve “growth at a reasonable price.” This hybrid approach focuses on companies poised for growth but still incorporates traditional value indicators.
Whenever you’re ready, there are three ways YCharts can help you:
Have questions about how YCharts can help you visually illustrate the differences between investing styles?
Email us at hello@ycharts.com or call (866) 965-7552. You’ll get a response from one of our Chicago-based team members.
Want to test out YCharts for free?
Start a no-risk 7-Day Free Trial.
Signup for the Top 10 Visuals Deck for more visuals to help your firm thrive
Download the free Slide Deck, The Top 10 Visuals for Client & Prospect Meetings, for more insights:Disclaimer
©2023 YCharts, Inc. All Rights Reserved. YCharts, Inc. (“YCharts”) is not registered with the U.S. Securities and Exchange Commission (or with the securities regulatory authority or body of any state or any other jurisdiction) as an investment adviser, broker-dealer or in any other capacity, and does not purport to provide investment advice or make investment recommendations. This report has been generated through application of the analytical tools and data provided through ycharts.com and is intended solely to assist you or your investment or other adviser(s) in conducting investment research. You should not construe this report as an offer to buy or sell, as a solicitation of an offer to buy or sell, or as a recommendation to buy, sell, hold or trade, any security or other financial instrument. For further information regarding your use of this report, please go to: ycharts.com/about/disclosure
Next Article
A Closer Look At October Flows: Where Did the Money Market Assets Go?Read More →