Is the Stock Market too Concentrated? Magnificent Seven Q3 2023 Update
As we gear up for the Q3 earnings season, the focus remains on the ‘Magnificent Seven’ stocks. NVIDIA (NVDA), Tesla (TSLA), Apple (AAPL), Microsoft (MSFT), Alphabet (GOOGL, GOOG), Meta (META), and Amazon (AMZN) have collectively outperformed the broader market by a wide margin this year.
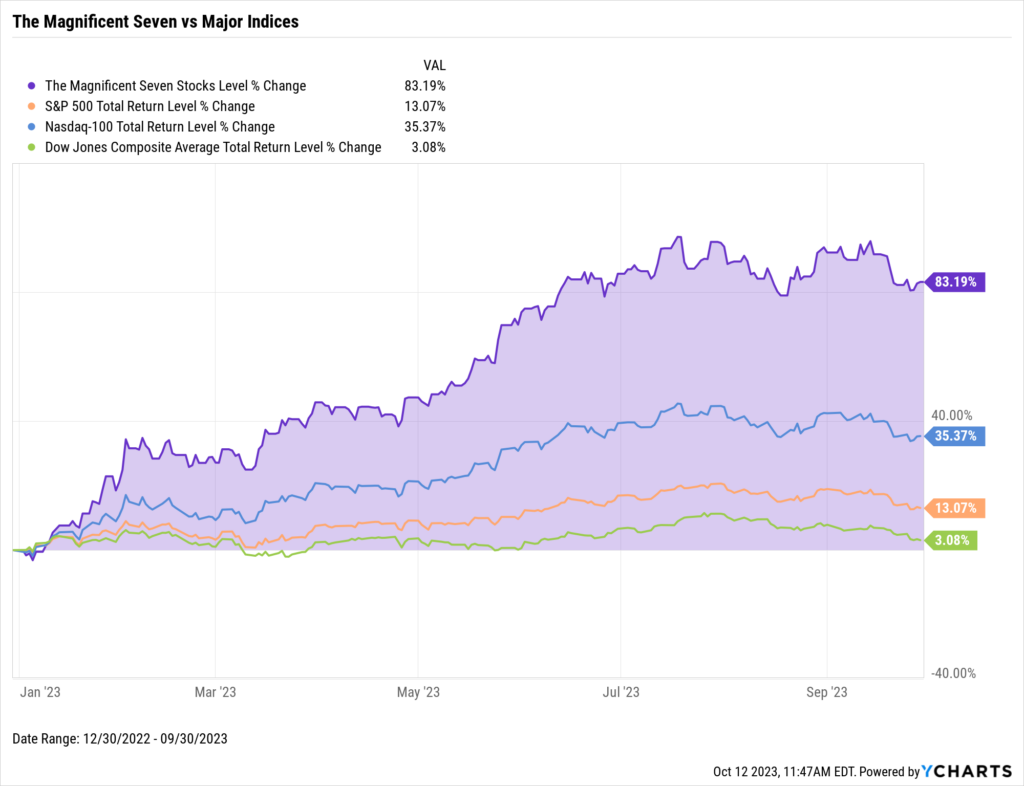
As a result of this significant outperformance and the market cap weighting of the S&P 500, these seven stocks now represent 29% of the total index.
This extreme short-term outperformance and the virality of these consumer-facing companies have created challenging conversations for advisors with clients that have potentially unrealistic return expectations.
This blog post serves two purposes.
First, we provide several visuals built with YCharts to help you navigate these difficult conversations. Then, we’re providing an in-depth update on the “Magnificent Seven” to help you prepare for the Q3 2023 earnings season.
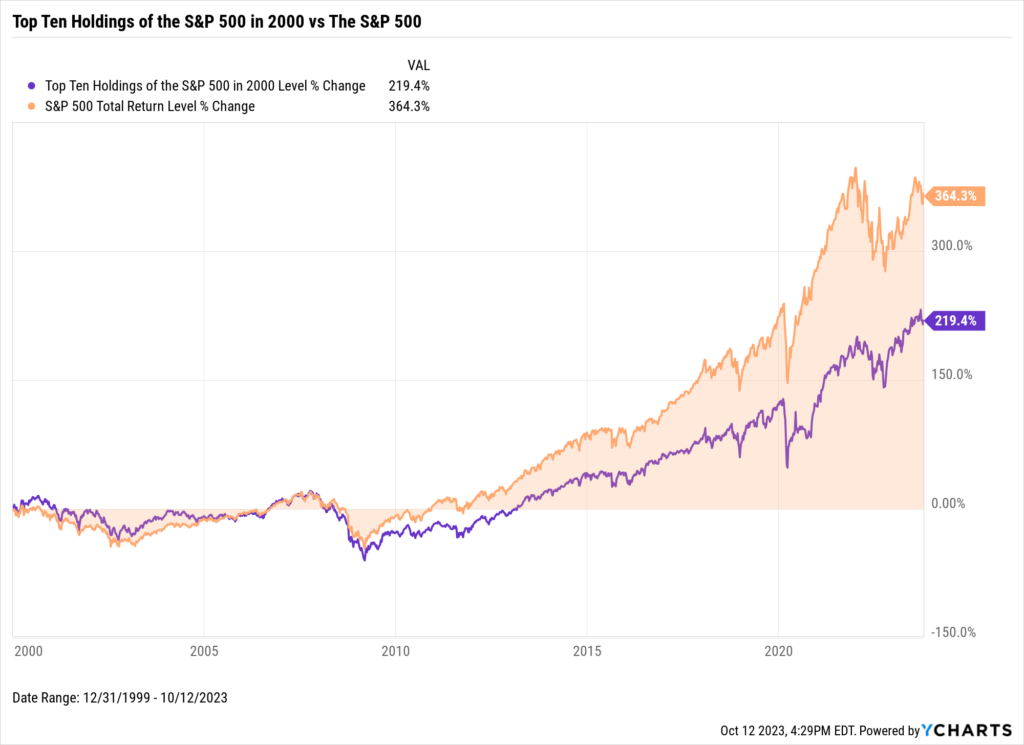
Should You Buy the Top 10 Holdings of the S&P 500?
In 2000, General Electric (GE), Exxon (XOM), Pfizer (PFE), Citigroup (C), Cisco (CSCO), Wal-Mart (WMT), Microsoft, AIG (AIG), Merck (MRK), and Intel occupied 23.5% of the S&P 500. An equal 10% investment in this group would have significantly underperformed against the S&P 500 since then.
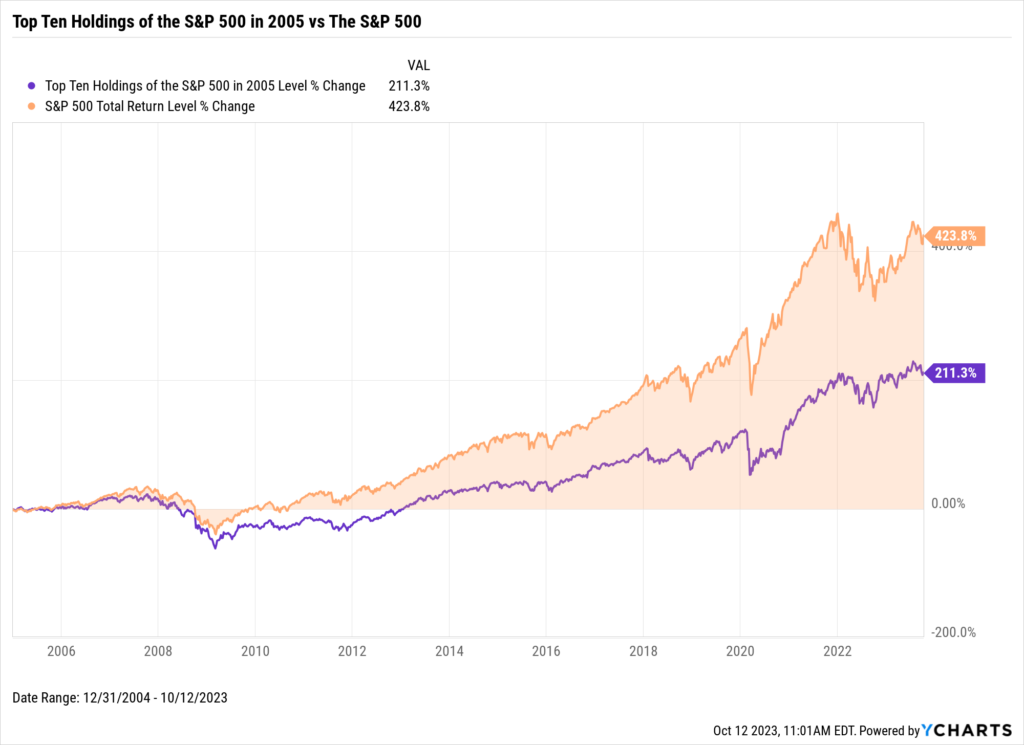
The Top 10 also went on to significantly underperform the S&P 500 In 2005, when General Electric, Exxon, Proctor & Gamble (PG), Citigroup, Bank of America (BAC), Wal-Mart, Microsoft, AIG, Johnson & Johnson (JNJ), and Pfizer comprised 20.4% of the S&P 500.
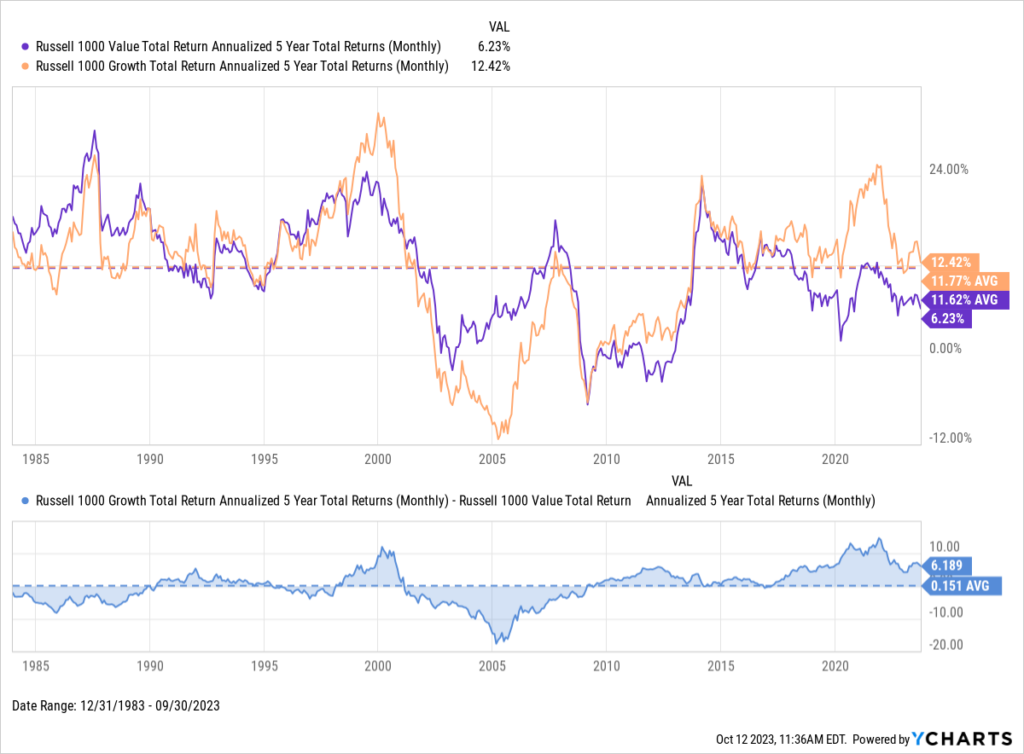
These visuals spotlight a crucial takeaway: today’s headline-makers and top performers may not sustain their performance into the future. Outperforming and underperforming strategies often mean revert.
As shown in the chart below, over the last 40 years, Value and Growth stocks have each outperformed the other for periods of time. However, long-term average trailing returns are nearly equal.
In the lower panel, an increasingly positive spread indicates outperformance by Growth stocks, and a more negative spread indicates Value outperformance.
Modify in YCharts | Get the Full Top 10 Visuals Deck
The chart above is from The Top 10 Visuals for Prospect & Client Meetings slide deck. We’re sharing the deck for free for you to use in your practice.
Download the free Slide Deck, The Top 10 Visuals for Client & Prospect Meetings, for more insights:Magnificent Seven Q3 2023 Earnings Prep
Venturing into Q4, we’re examining the status of each member of the ‘Magnificent Seven’ heading into the Q3 2023 earnings season.
Click to jump to a specific section:
- NVIDIA
- Tesla
- Apple
- Microsoft
- Alphabet
- Meta Platforms
- Amazon
- Earnings Calendar for the Magnificent Seven
NVIDIA
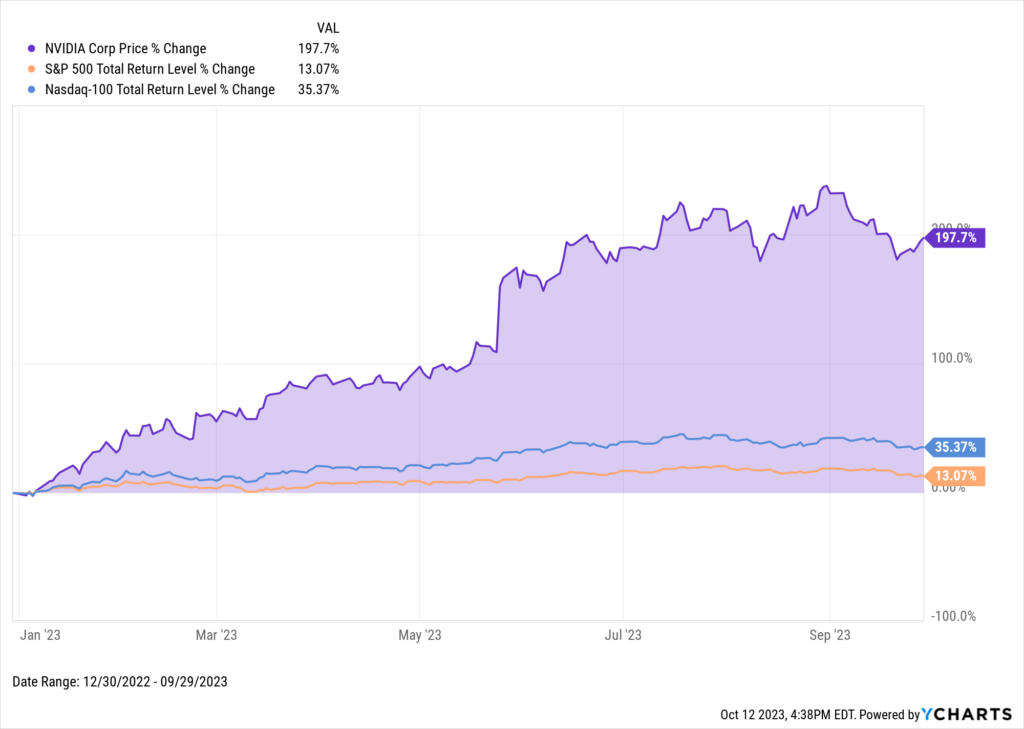
In 2023, the meteoric rise of Artificial Intelligence (AI) has cast NVIDIA as a pivotal player in the AI saga. CEO Jensen Huang declared at the end of Q2, “A new computing era has begun. Companies worldwide are transitioning from general-purpose to accelerated computing and generative AI.”
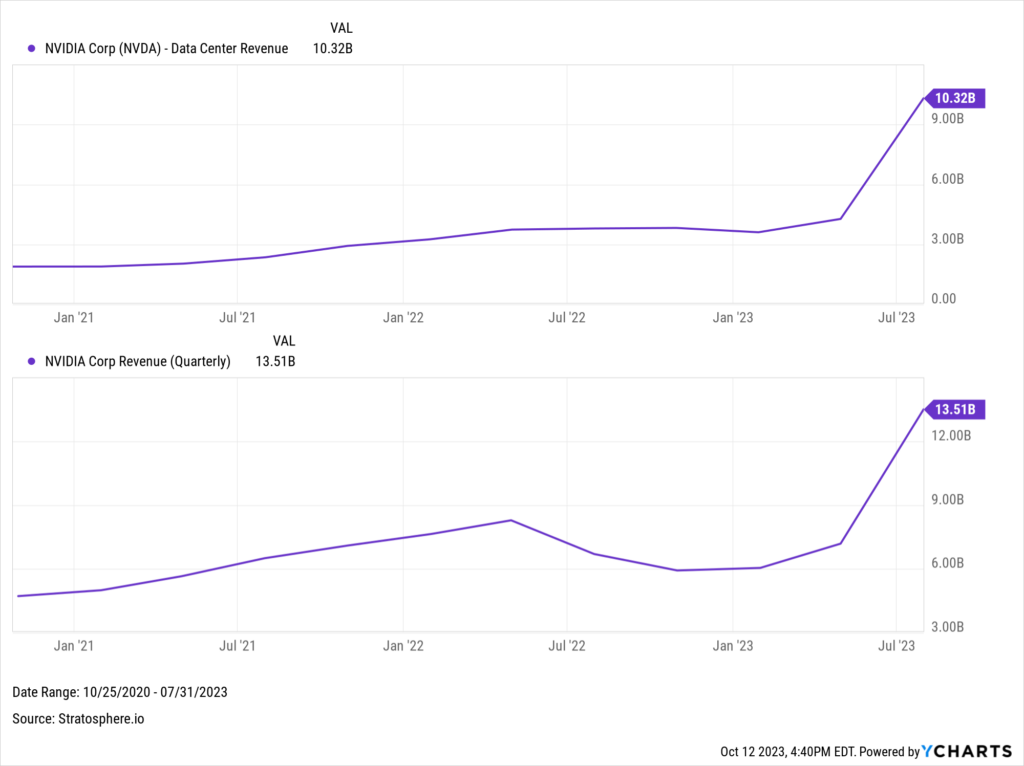
After registering a staggering $13.51B in revenue last quarter, it’s clear the chip manufacturer isn’t merely participating in this technological renaissance but actively sculpting it.
Despite experiencing a slight pullback in late August and September, NVIDIA’s stock ascended by an impressive 197% year-to-date as of September 29th.
Download Visual | Modify in YCharts
NVIDIA’s innovation in AI is driven by several new chips getting widespread adoption, including the H100, which the company claims delivers nine times the performance of its predecessor and is essential in building Large language models (LLMs) like ChatGPT and BARD. Last quarter, NVIDIA also announced plans to ship an enhanced version of the GH200 Grace Hopper Superchip next year, combining the Grace CPU with the abovementioned H100 GPU, which, according to the company, can process specific AI tasks (specifically, running LLMs) 284 times faster.
Recognizing its potential, industry giants like Google Cloud, Meta, and Microsoft are among the early adopters of the DGX GH200, a supercomputer powered by 256 Grace Hopper Superchips that offers 144TB of shared memory for next-gen Gen AI language models.
Amid the thriving AI adoption, NVIDIA continues to guide businesses to enhanced AI integration. The company’s “three-chip strategy” is a cornerstone for enterprises building their AI models, underscored by the 171% YoY increase in NVIDIA’s data center revenue in Q2. Data center revenue accounts for over three-quarters of NVIDIA’s total revenue.
Download Visual | Modify in YCharts
NVIDIA solidified itself among the elite companies with a trillion-dollar market cap post-earnings report. This significant boost demonstrates NVIDIA’s integral role in fortifying global AI infrastructure, solidifying its position as an ally for enterprises navigating the AI landscape.
The tech giant is also simplifying AI for developers. NVIDIA announced an AI Workbench, an upgraded NVIDIA AI Enterprise 4.0, and a partnership with Hugging Face, all designed to streamline the creation and customization of AI models and extend access to AI computing resources, making advanced AI more accessible, thereby fueling broader AI adoption and innovation across diverse sectors.
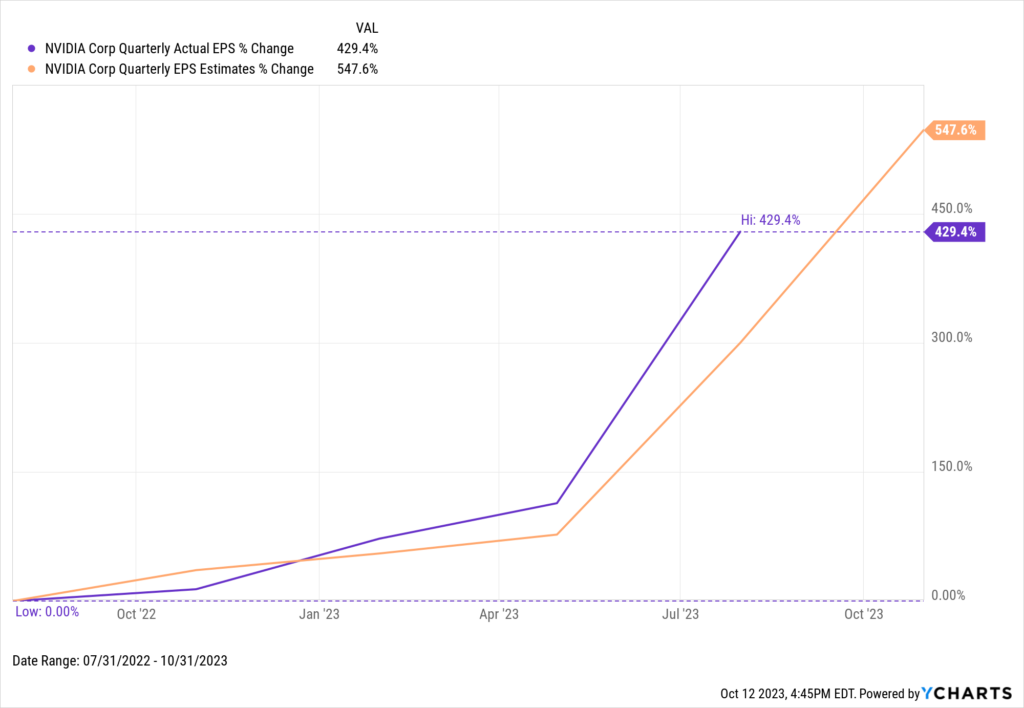
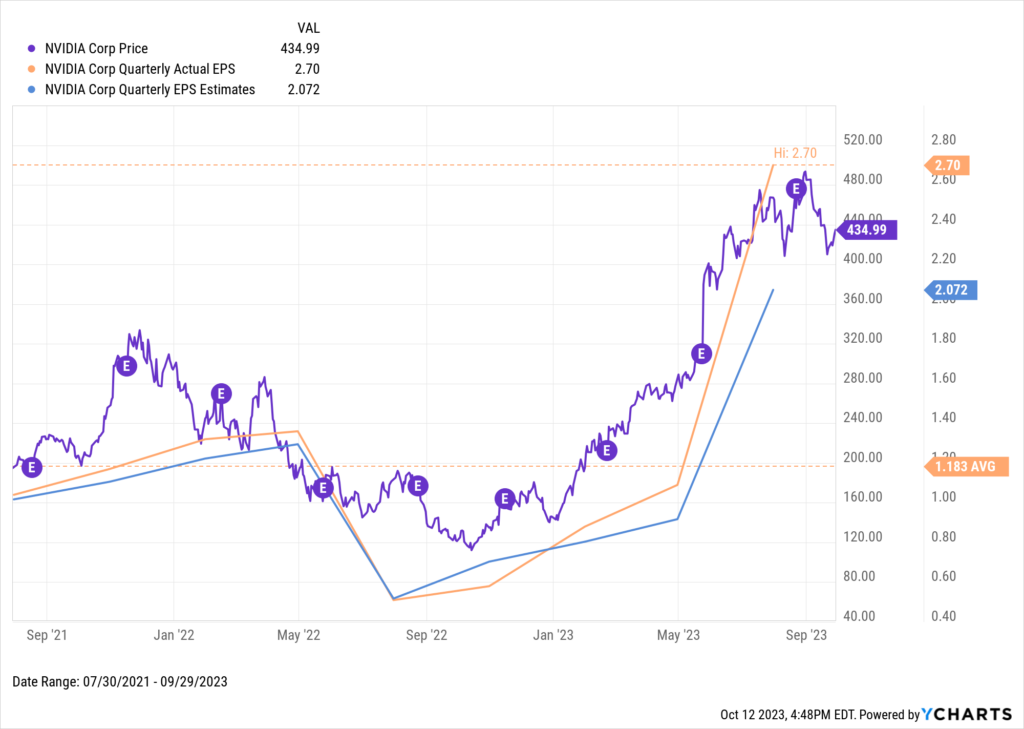
NVIDIA’s Q2 EPS came in at $2.70, surpassing the forecasted $2.14 by a considerable margin and reflecting a colossal 429% YoY uptick. During the earnings call, NVIDIA issued an optimistic revenue guidance for this upcoming quarter, targeting $16 billion in revenue. This forecast suggests the company’s sales will have grown 170% annually.
Download Visual | Modify in YCharts
NVIDIA will report Q3 earnings on November 16th. Analysts expect EPS to come in at $3.35, a stark contrast from actual EPS of $0.58 a year earlier.
Download Visual | Modify in YCharts
If these earnings updates are helpful, sign up for our post-earnings update to stay informed.
Enter Your Email to Recieve a Post-Earnings Season UpdateTesla
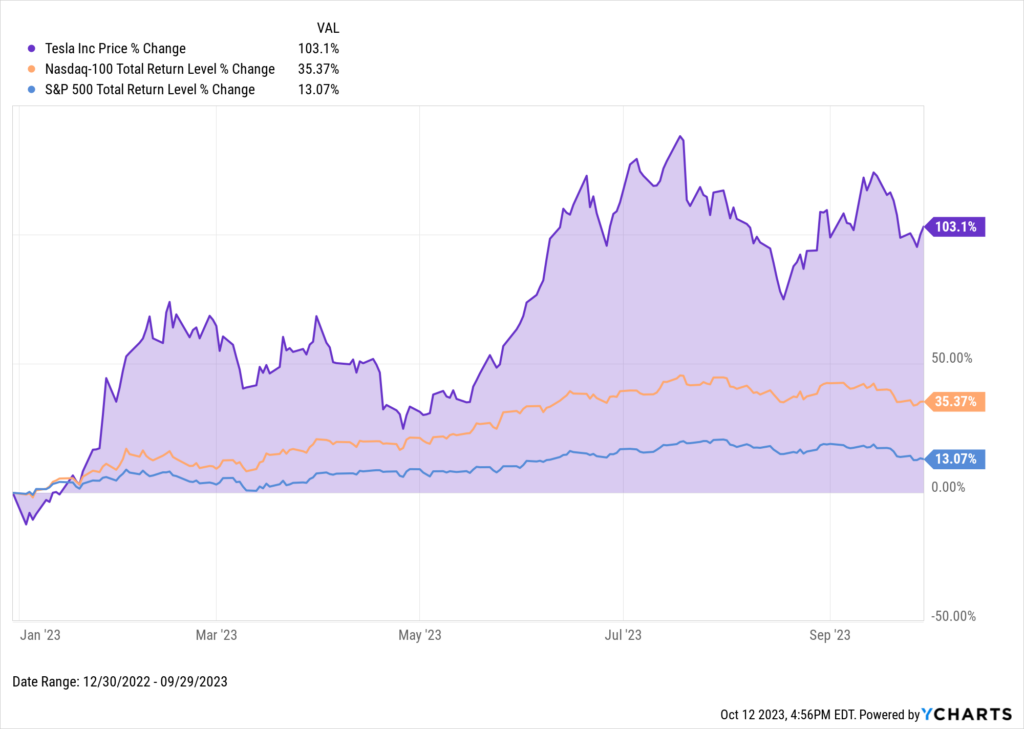
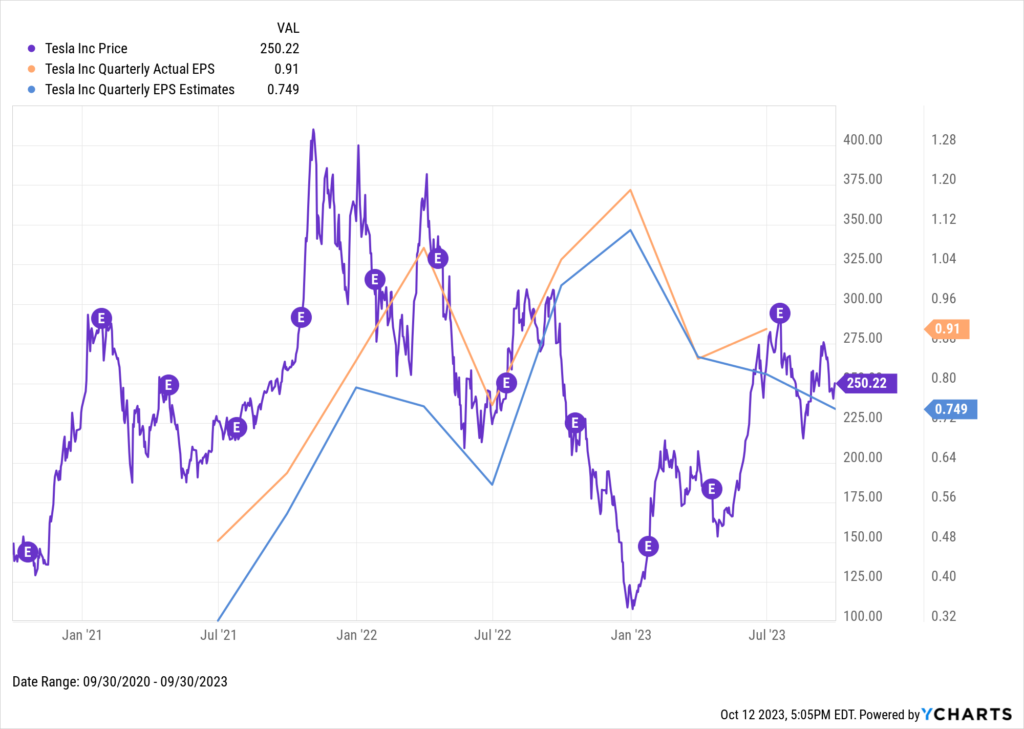
Tesla, a pioneer in electric vehicles (EVs), has been instrumental in driving the advancements in autonomous technology within the automotive industry. Through three quarters of 2023, the company’s stock has soared by 103%.
Download Visual | Modify in YCharts
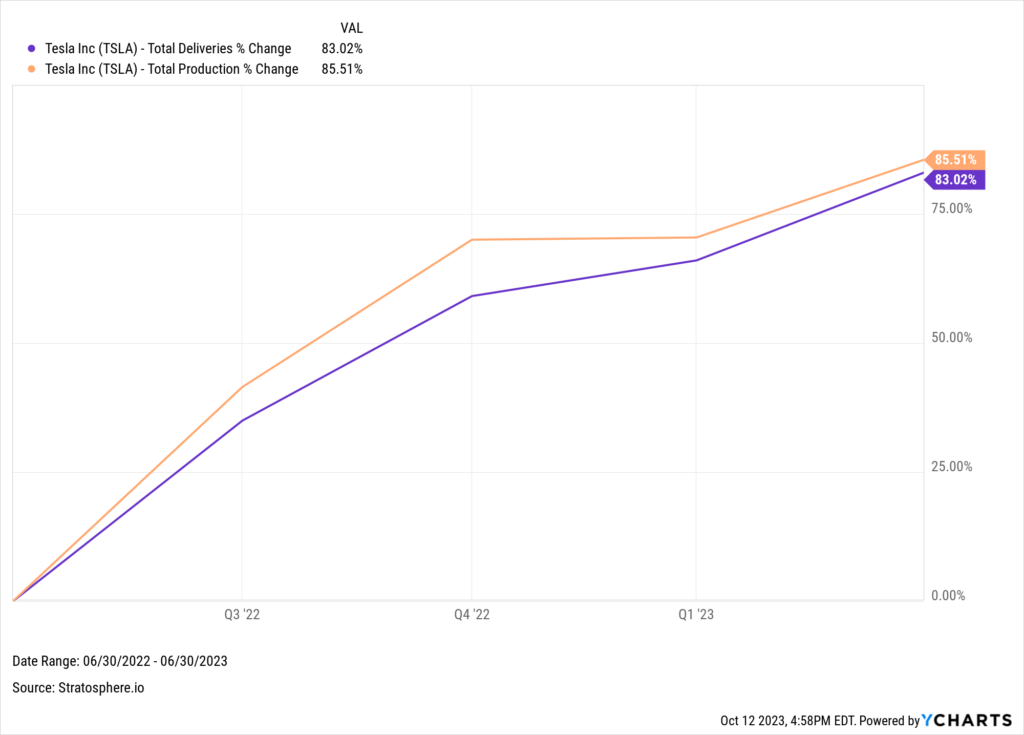
In the previous quarter, Tesla witnessed its car sales revenue surge by 49.37% YoY. Production and deliveries each escalated by over 80% year over year. However, several price cuts caused the amplified delivery count to dent Tesla’s operating margin, dipping below 10% for the first time since Q1 2021.
Despite an expected deceleration in production and deliveries, Tesla’s presence on American roads has steadily grown. The Model Y became the best-selling non-pickup vehicle in the US and the best-selling car worldwide earlier this year.
Download Visual | Modify in YCharts
Tesla further solidified its influence on future EV infrastructure. Several automakers, including Ford (F) and General Motors (GM), announced that their future EVs would be compatible with Tesla’s Supercharger Network. Per Tesla’s Q2 earnings report, the number of supercharger stations (5,265) and connectors (48,082) increased 33% YoY.
Download Visual | Modify in YCharts
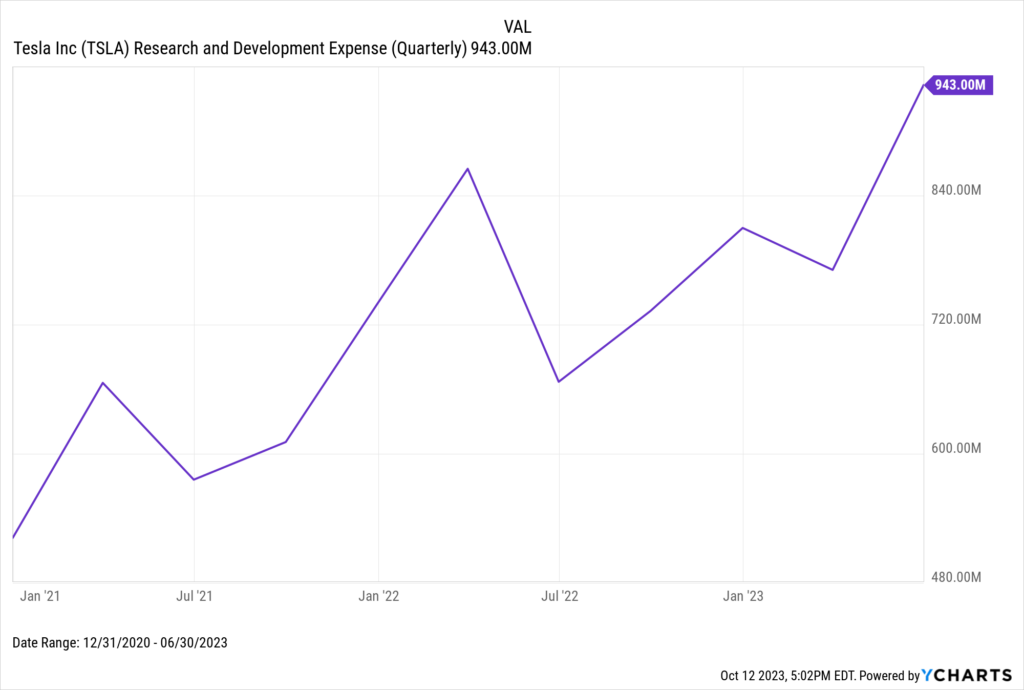
Tesla significantly ramped up its R&D expenditures to $943 million last quarter, a substantial rise from $667 million last year. The primary focus of these investments? You guessed it: Artificial Intelligence.
For Tesla, that means investing in the development of ‘Dojo,’ their supercomputer geared for AI machine learning and computer vision training. With data collected from customers and company vehicles, Tesla aims to refine its software, pioneer innovative features for its driver assistance systems, and solidify its pathway towards the ultimate objective: achieving fully autonomous vehicles.
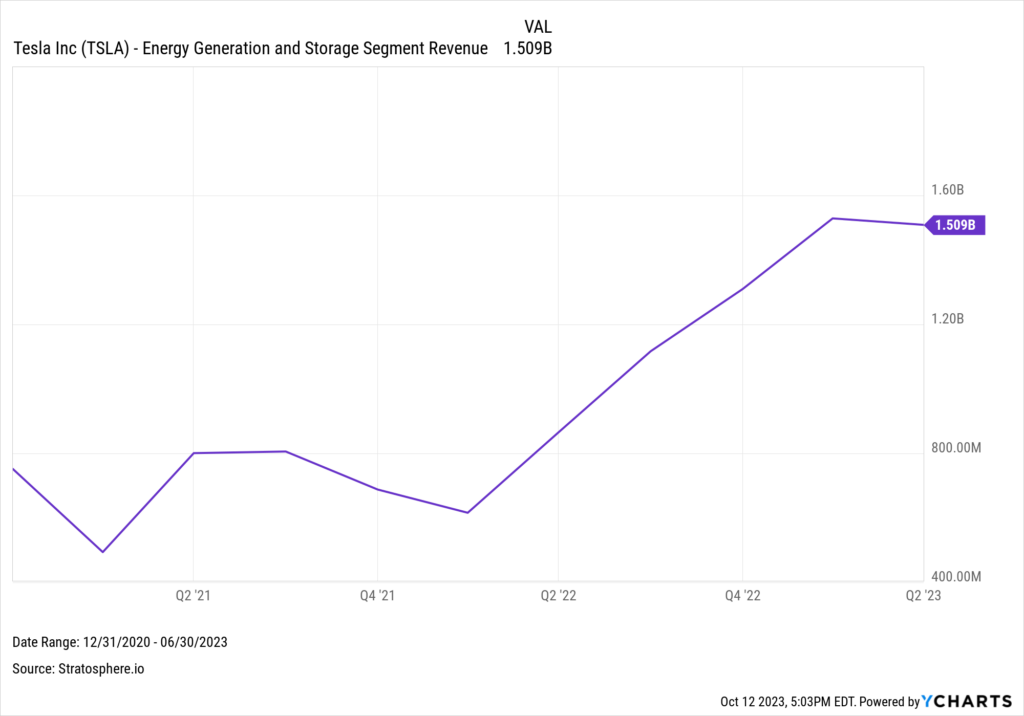
Tesla’s Energy Generation and Storage arm, composed of solar panel and energy storage battery sales, generated over $1.5B in revenue for the second consecutive quarter. This segment now contributes to 6% of Tesla’s total revenue.
Download Visual | Modify in YCharts
Analysts expect Q3 EPS to come in at $0.78 when Tesla reports earnings on October 19th. Analysts and investors alike will be keen to see if the EV maker beats earnings and whether CEO Elon Musk will disclose a delivery date for the eagerly awaited Cybertruck that Musk confirmed will commence deliveries this year.
Download Visual | Modify in YCharts
Apple
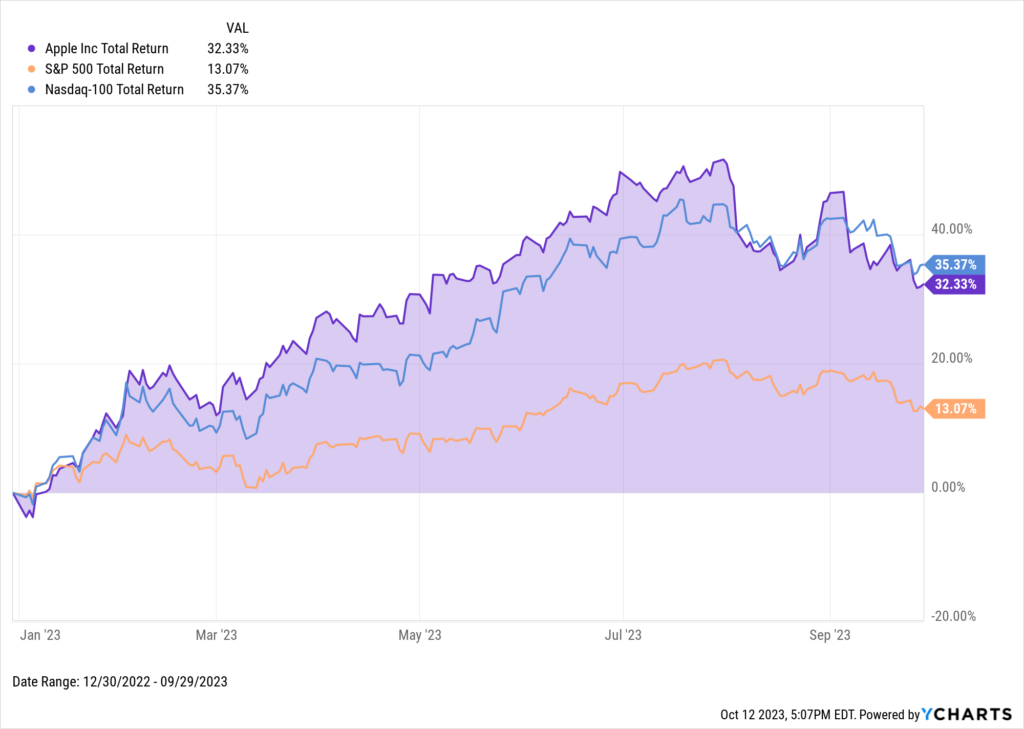
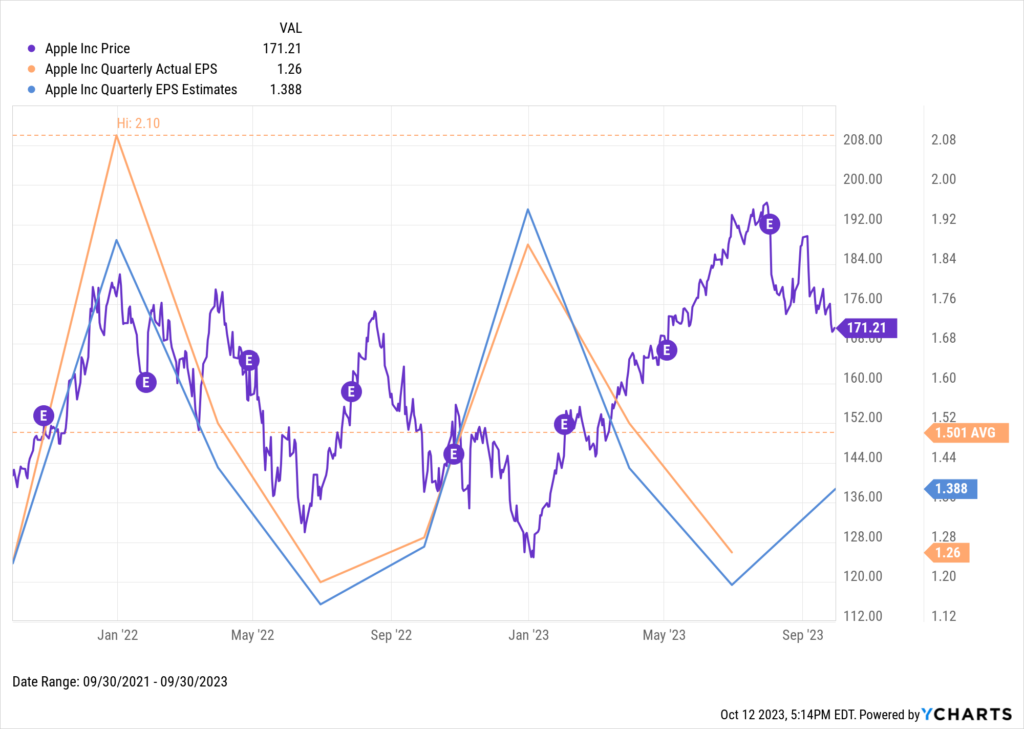
Apple maintains its reputation as one of the most successful publicly traded companies, and this year has been no exception. After skyrocketing like the rest of the Magnificent Seven, the company’s stock performance stumbled a bit in the final part of Q3 and is currently underperforming against the NASDAQ YTD.
Download Visual | Modify in YCharts
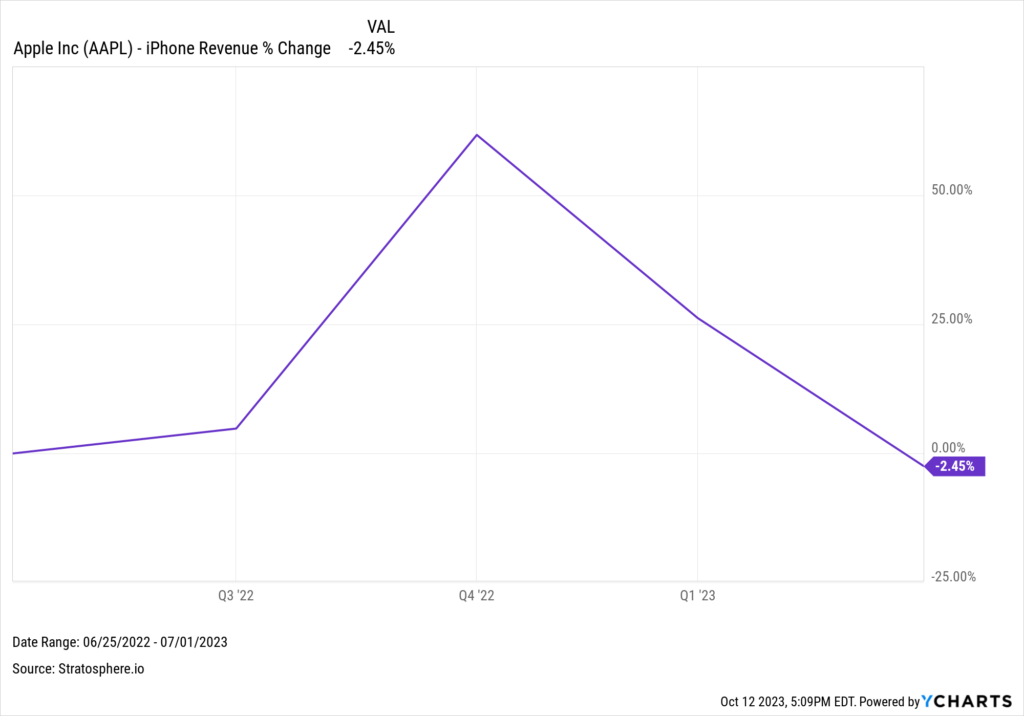
Last quarter, Apple disclosed its third consecutive quarter of waning revenue, which hasn’t happened since 2016. Following the release of the iPhone 15 on September 22nd, this segment of Apple’s business will face additional scrutiny, especially as iPhone revenue declined 2.5% YoY in the last quarter.
Download Visual | Modify in YCharts
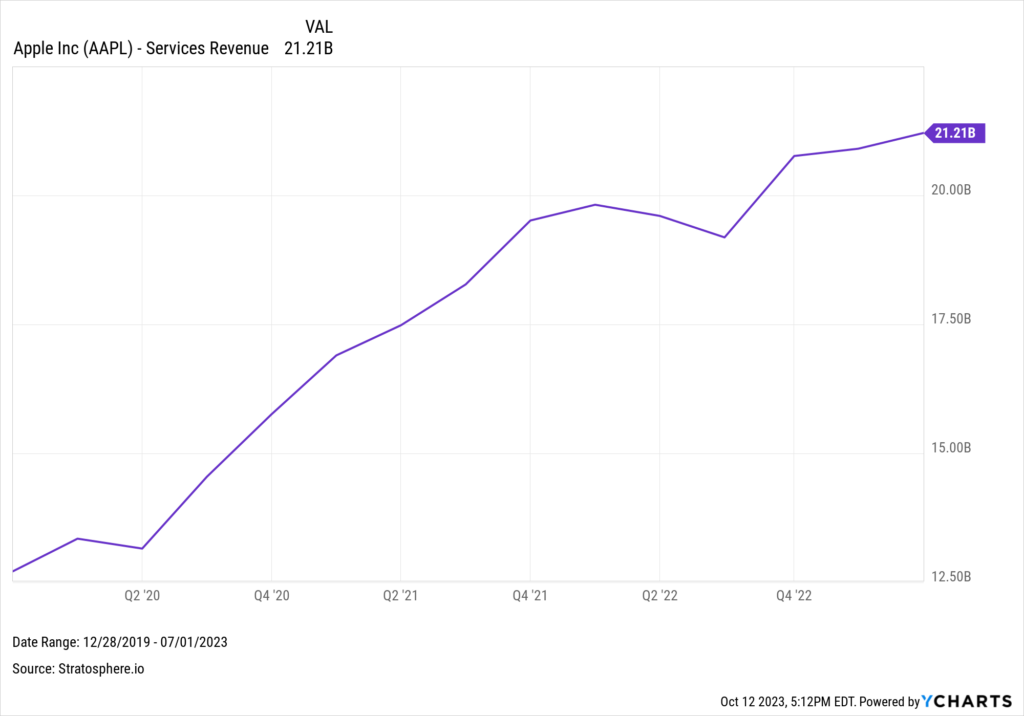
Notwithstanding the previous point, Apple’s services unit emerges as a silver lining, described by CFO Luca Maestri as a “leading indicator of the strength and health of [Apple’s] ecosystem.” This segment has consistently grown, reporting a stellar $21 billion in revenue, propelled by acquiring over a billion paid subscribers across various platforms.
Apple’s services segment includes the App Store, Apple Music, iCloud, and other subscriptions. The company’s AppleTV+ deal with Major League Soccer (MLS) catalyzed a surge in subscriptions following Lionel Messi’s high-profile move to Inter Miami. Within the first month of Messi’s arrival, the platform witnessed an influx of over 250,000 new U.S.-based subscribers and is reportedly exploring further investment in live sports broadcasting, including casting a prospective offer for Formula 1’s broadcasting rights.
Download Visual | Modify in YCharts
Even as a blue-chip stock, the company still sees substantial growth potential in emerging markets. Revenue from China, Apple’s third-largest market, saw a 7.9% increase, reaching $15.8 billion. Elsewhere in Asia, India was one of 8 countries CEO Tim Cook mentioned as having a total revenue record.
India—now the world’s most populous nation—is increasingly pivotal in Apple’s global strategy. In April, Cook visited India to inaugurate the first official Apple store in Mumbai, highlighting the company’s strategic move to capture the country’s vast market opportunity.
“[India] is the second largest smartphone market in the world. So we ought to be doing really well there,” Cook said during last quarter’s earning call. “We still have a very, very modest and low share in the smartphone market. And so I think that it’s a huge opportunity for us.”
Apple reports earnings on October 27, 2023, and analysts predict an EPS of $1.39.
Download Visual | Modify in YCharts
Microsoft
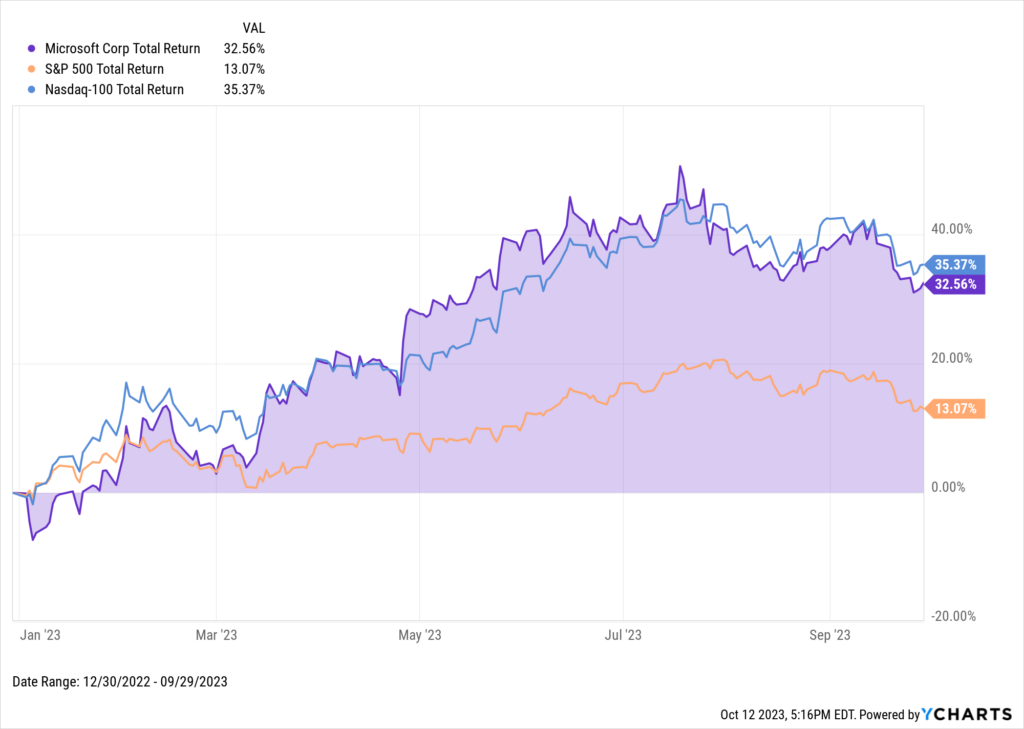
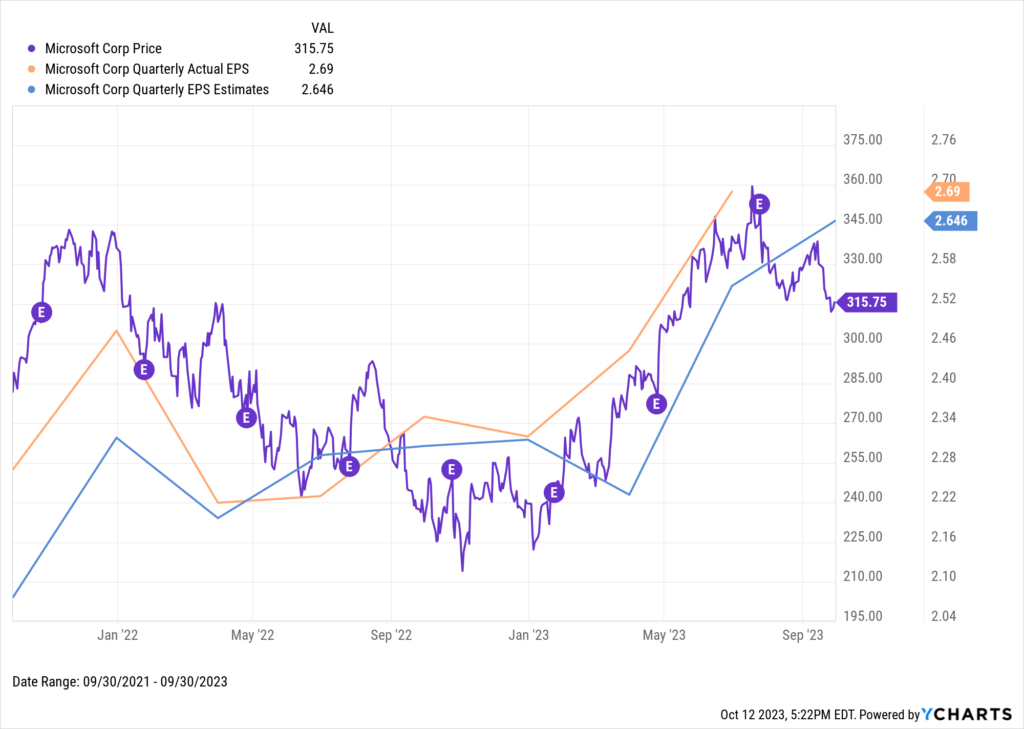
With its strategic stake in OpenAI, Microsoft has ridden the wave of AI excitement that’s permeated 2023. OpenAI is the creator of the popular LLM ChatGPT. Microsoft’s stock has trended similarly to Apple, outpacing the broader NASDAQ index early in the year but giving up some gains down the stretch in Q3.
Download Visual | Modify in YCharts
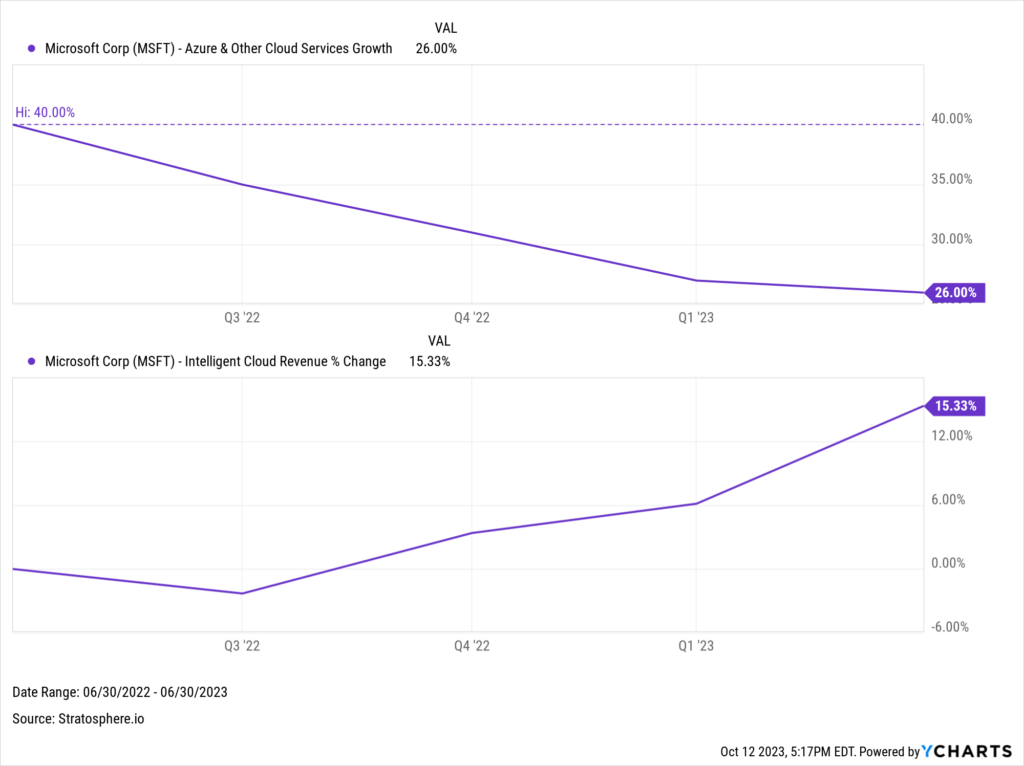
ChatGPT has undergone notable enhancements in 2023, including new speech and image recognition capabilities and an integrated ability to harness Bing for real-time information. In addition to subscriptions for GPT-4 (the paid version of ChatGPT), OpenAI has monetized its API, leveraging Microsoft’s Azure Cloud platform.
Last quarter, Azure saw 26% in revenue growth, a drop off from last year’s robust 40% growth but impressive nonetheless. The Intelligent Cloud segment, where Azure plays a pivotal role, reported a stellar $24 billion revenue for Q2, signifying 15% YoY growth.
Download Visual | Modify in YCharts
Microsoft’s Azure OpenAI Service, which provides enterprises access to advanced language models and a suite of developer tools, has witnessed a significant uptick in clientele. The platform now supports over 11,000 customers, including Mercedes-Benz, which will bring ChatGPT to more than 900,000 vehicles in the United States.
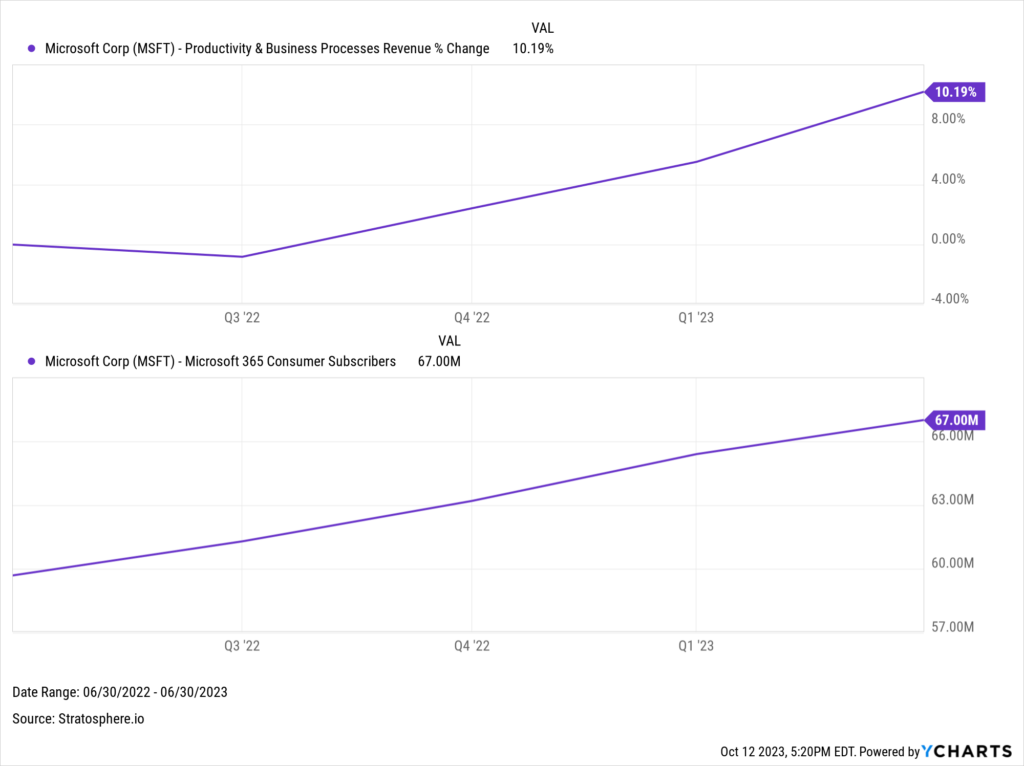
Outside of the burgeoning AI success, Microsoft is still driving success with its Office and Microsoft 365 platforms. The company now boasts 67 million Microsoft 365 subscribers (a leap from last year’s 60 million) and witnessed a 10% revenue increase in the Productivity & Business Processes segment.
Download Visual | Modify in YCharts
Microsoft is slated to reveal its earnings on October 25th. Analysts anticipate an EPS of $2.65, signifying a 12.8% YoY increase.
Download Visual | Modify in YCharts
Alphabet
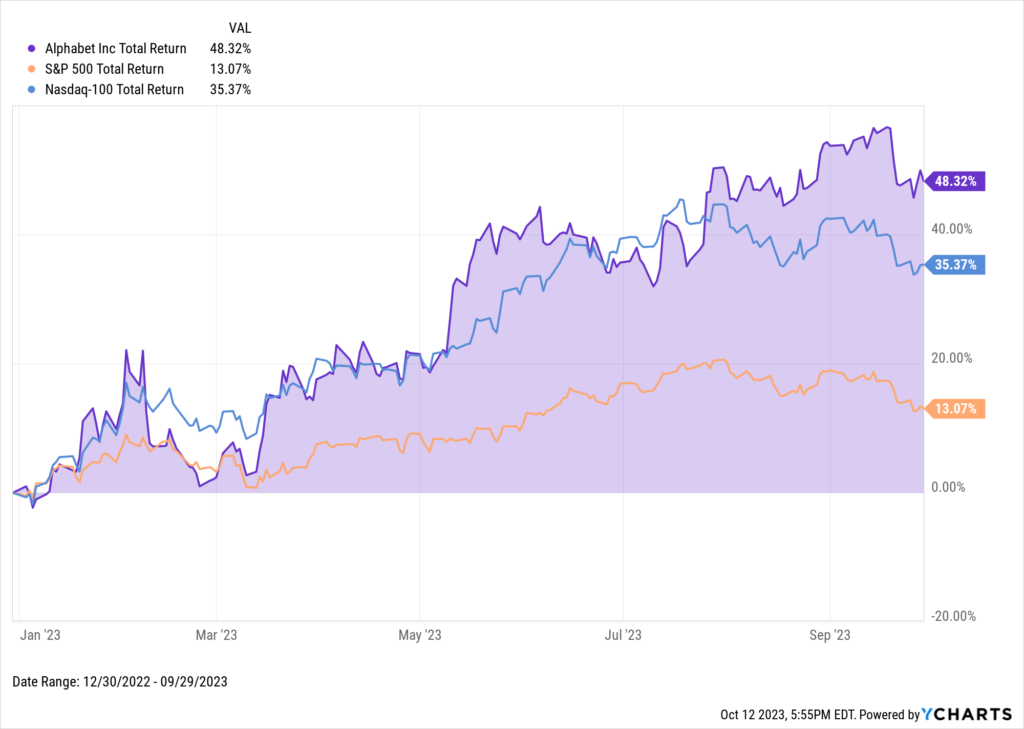
With a 48.3% stock increase this year as of September 29th, Alphabet is another major player on the LLM side of the AI space, particularly with Bard.
Download Visual | Modify in YCharts
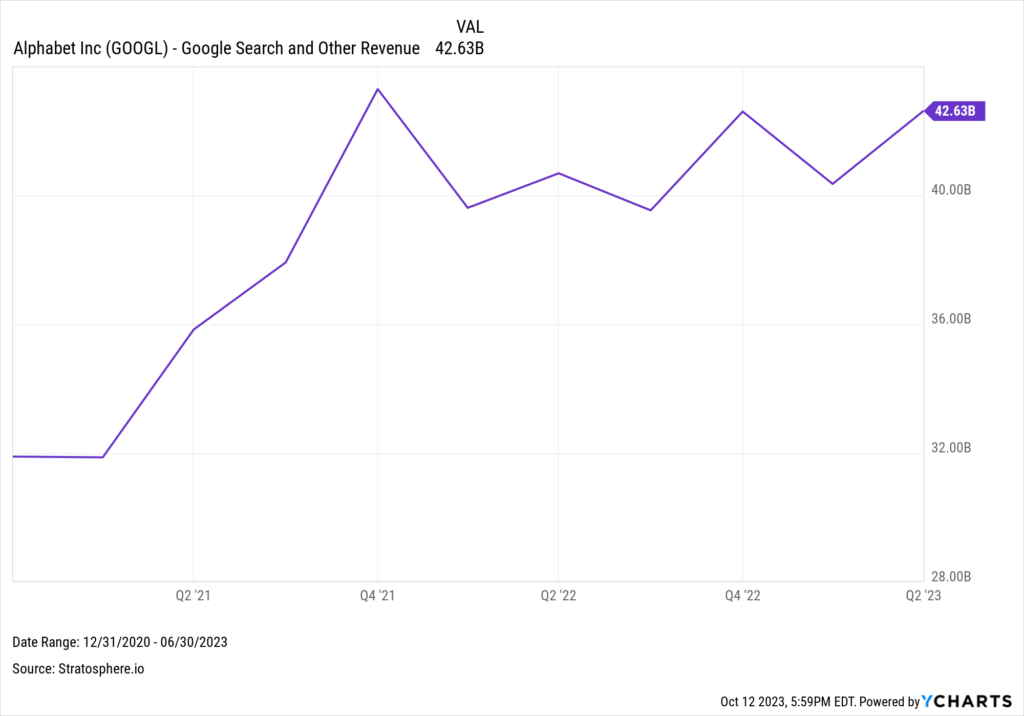
However, the US Department of Justice’s antitrust lawsuit might be at the top of mind for analysts and investors.
The DOJ argues that Alphabet’s agreements with Apple ensuring Google’s status as the default search engine on devices like iPhones stifle competition. The DOJ is seeking an injunction to bar those agreements and has suggested potentially breaking up Google with its sights set expressly on Google Search, which alone raked in $42.6B of revenue last quarter.
Download Visual | Modify in YCharts
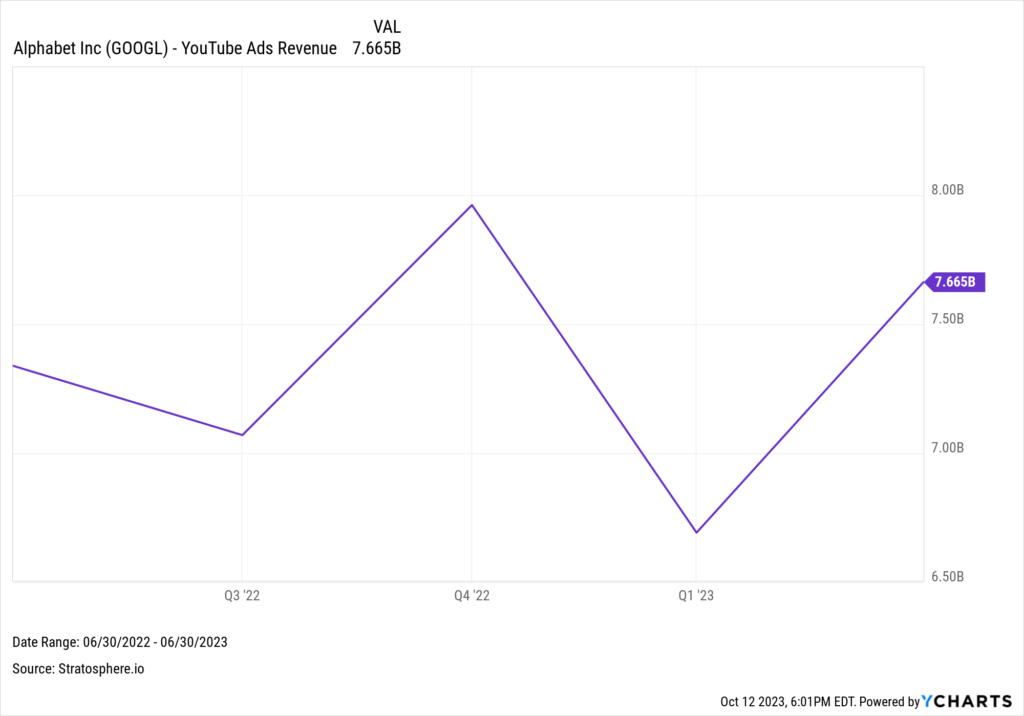
Unquestionably, advertising revenue forms the financial pillar of Alphabet’s earnings. Ad revenue grew to $58.14 billion, a 3.3% uptick from last year’s $56.29 billion. Moreover, YouTube’s advertising revenue stood at $7.67 billion despite wrestling with fierce competition, notably from TikTok.
Download Visual | Modify in YCharts
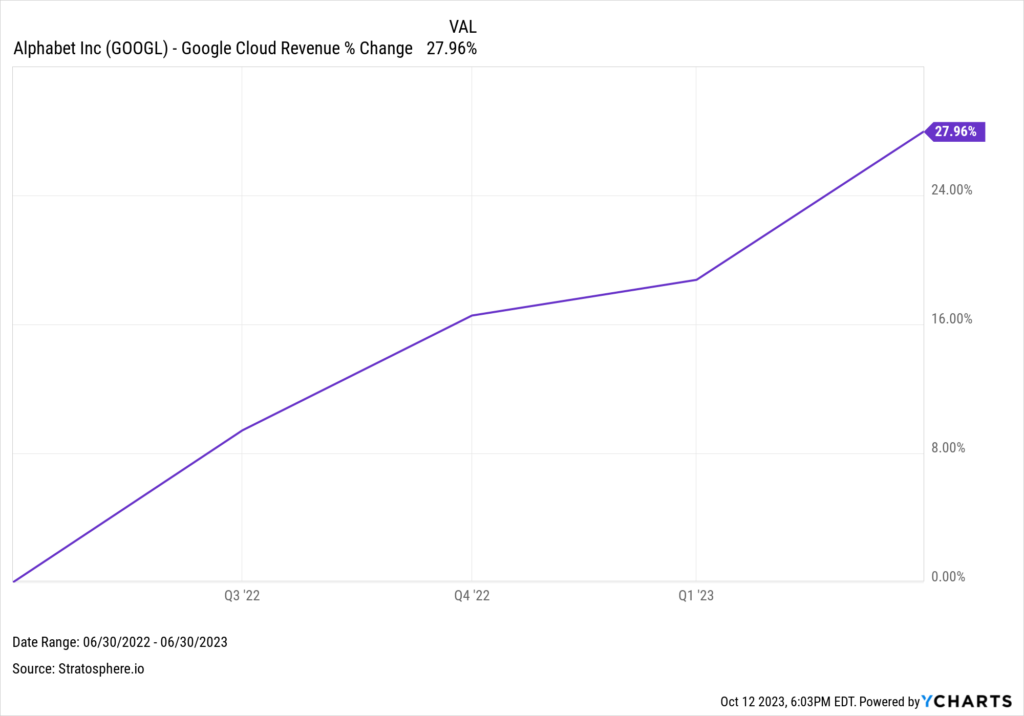
Various facets of Alphabet’s business are also exhibiting vitality. Google Cloud’s revenue ascended 28%, from $6.3 billion at the end of Q2 in 2022 to $8 billion in the same quarter of this year. CEO Sundar Pichai emphasized Google Cloud’s importance in an earnings call earlier in the year, saying that nearly 60% of the world’s top 1000 companies are Google Cloud customers. In the latest earnings call, Pichai said, “70% of Gen AI unicorns are Google Cloud customers.”
Google Cloud might be where Alphabet’s biggest advantage in AI lies. Alphabet recently unveiled Duet, an AI co-pilot engineered for writing, coding, and data analysis.
Download Visual | Modify in YCharts
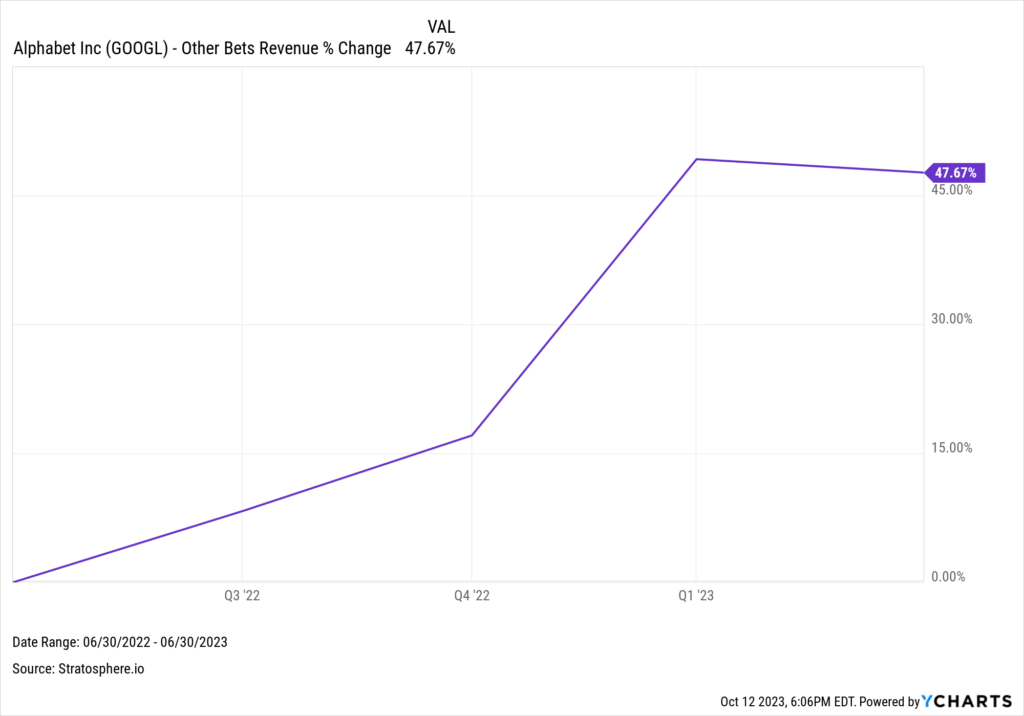
Alphabet’s ‘Other Bets’ segment – which encompasses Waymo, the autonomous driving venture – saw a significant 48% YoY revenue rise, amounting to $285 million.
Download Visual | Modify in YCharts
During the last earnings call, the company announced that Ruth Porat, Alphabet’s CFO for the past eight years, will transition to oversee the ‘Other Bets’ portfolio. Therefore, this upcoming quarter will afford analysts and investors a premiere glance at this segment’s performance under Porat’s guidance.
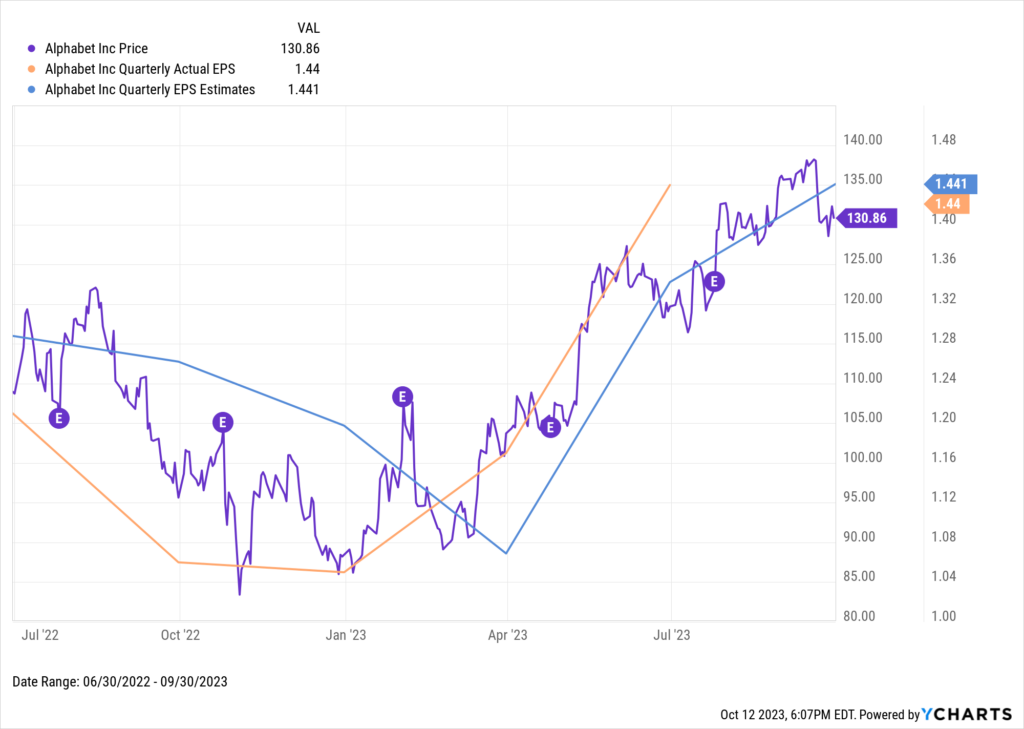
Alphabet is scheduled to declare earnings on October 25th, with analysts projecting an EPS of $1.44.
Download Visual | Modify in YCharts
META Platforms
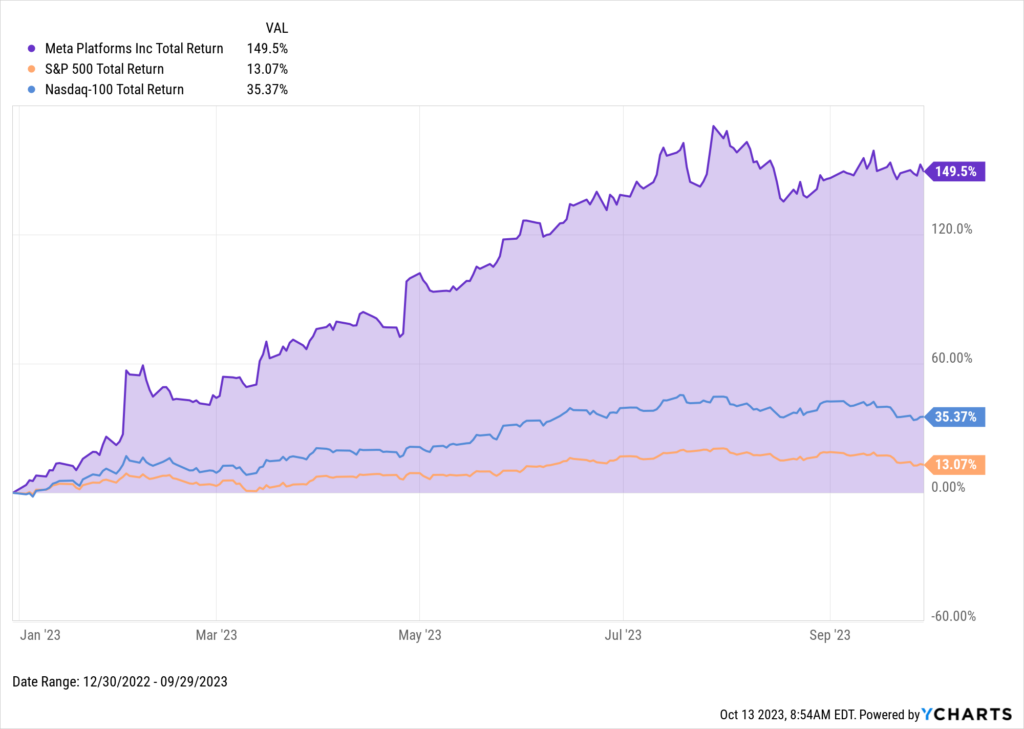
If not for NVIDIA’s meteoric rise, Meta Platforms Inc. (META) would arguably dominate this year’s stock market conversations. The stock surged 149.5% as of September 29th, propelled by large cost-cutting initiatives, unveiling new platforms and enhancement of existing ones, and recently resurrecting one of its more publicized ideas.
Download Visual | Modify in YCharts
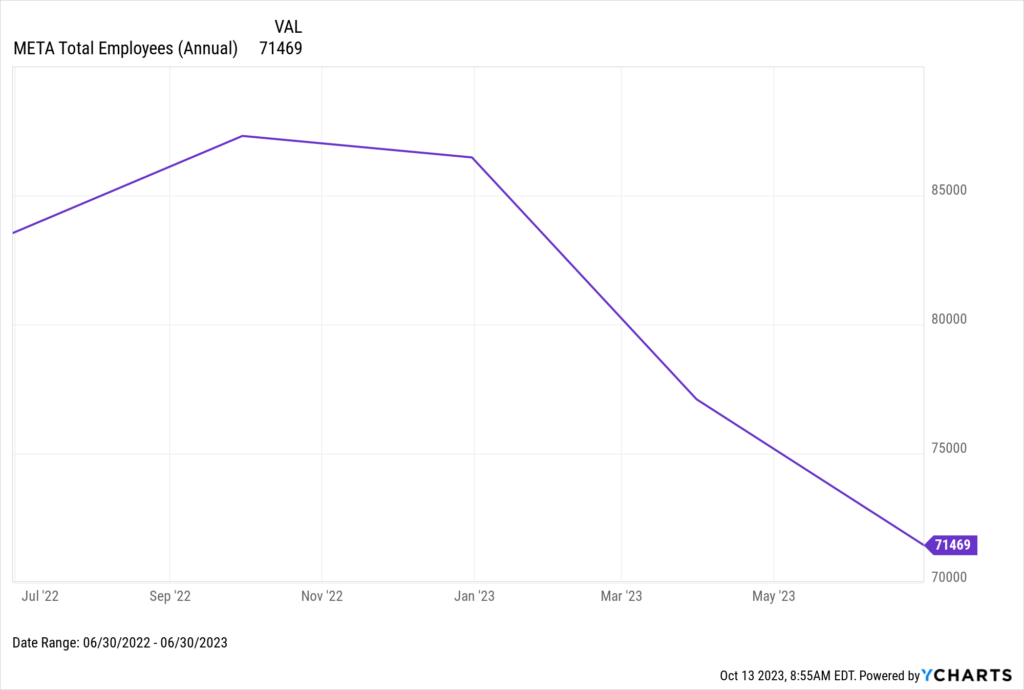
In some ways, Meta’s performance can be attributed to “addition by subtraction;” Meta underwent an overall reduction in force of 14.5% YoY, bringing headcount down to 71,469. This decline is partly due to substantial layoffs in 2023, with half of the impacted employees reflected in the headcount as of June 30, 2023.
Download Visual | Modify in YCharts
Regarding its workforce strategy, Meta intends to invest more in payroll. CFO Susan Li stated: “We anticipate growth in our payroll expenses as we evolve our workforce composition toward higher-cost technical roles.”
Last quarter, Meta reported double-digit revenue growth for the first time since Q4 of 2021. The 11% YoY revenue leap was spurred by a 12% YoY uptick in advertising revenue.
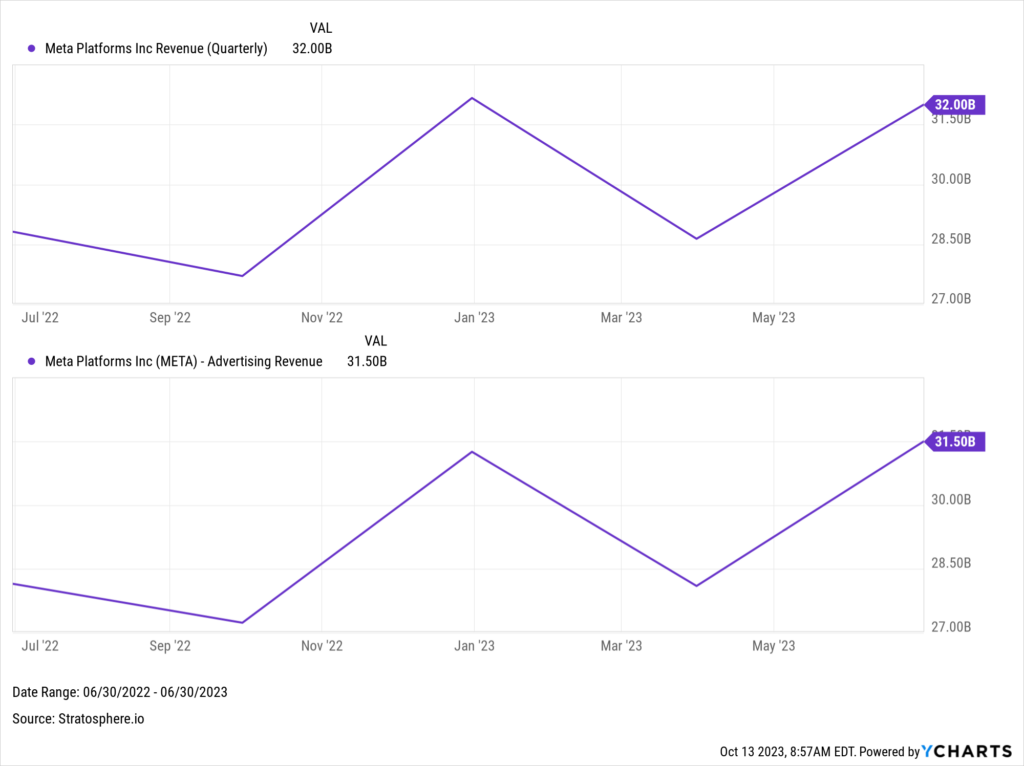
Download Visual | Modify in YCharts
On the platform side, Meta’s user base has sustained an upward trajectory. According to its latest earnings report, 3.07 billion people use its family of platforms daily, up from 2.88 billion at the same time last year. Additionally, 68% of Facebook’s Monthly Active Users (MAUs) were Daily Active Users (DAUs) for the first two quarters of the year, indicating high engagement with the platform.
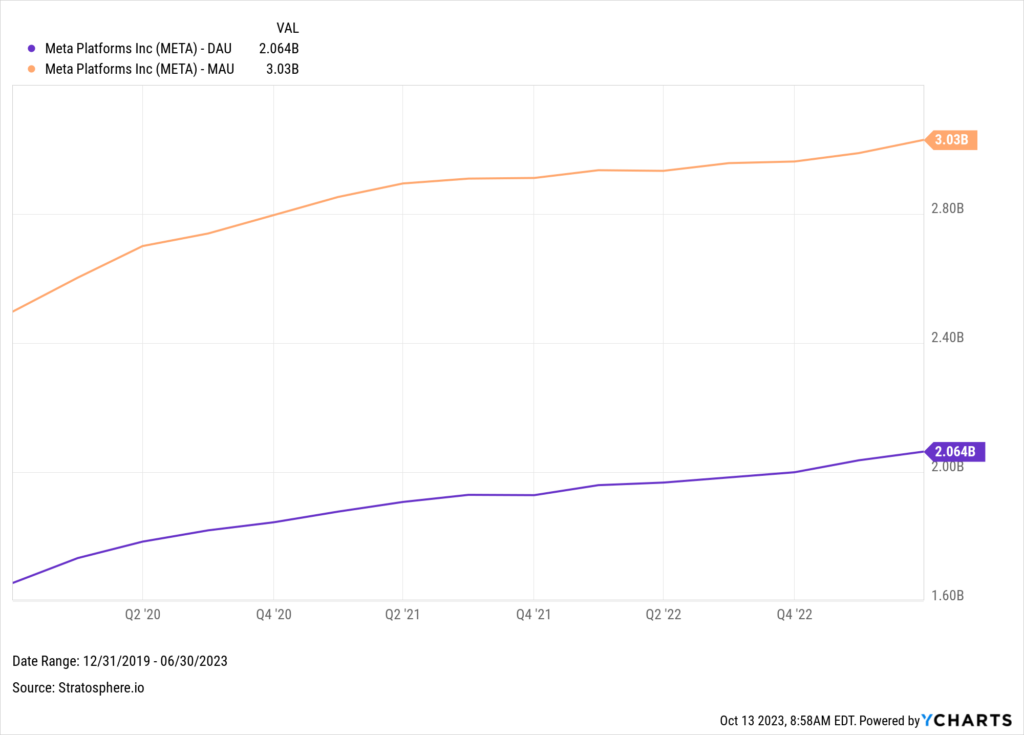
Download Visual | Modify in YCharts
Meta also seems eager to get new platforms off the ground after launching Threads earlier this year. Furthermore, it is dipping its toes into the AI waters, launching its version of a chatbot called Meta AI, which the company is deploying across its family of apps. Notably, Meta is poised to introduce 28 AIs, each boasting a unique personality, setting it apart from other chatbots released by its contemporaries on this list.
As a testament to their forward-thinking approach, Mark Zuckerberg recently joined Lex Freidman on a podcast from the Metaverse to highlight how that project has grown despite its many skeptics.
Analysts forecast a Q3 EPS of $3.58, which would signify a remarkable 118% YoY growth. Meta is expected to report earnings on October 26th.
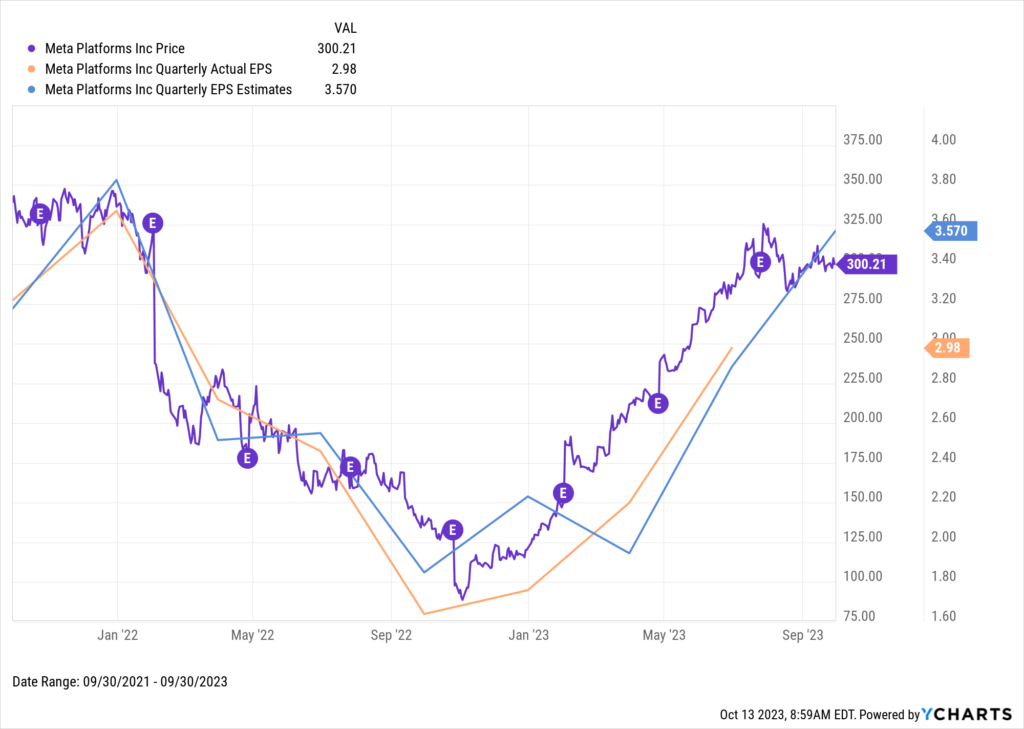
Download Visual | Modify in YCharts
Amazon
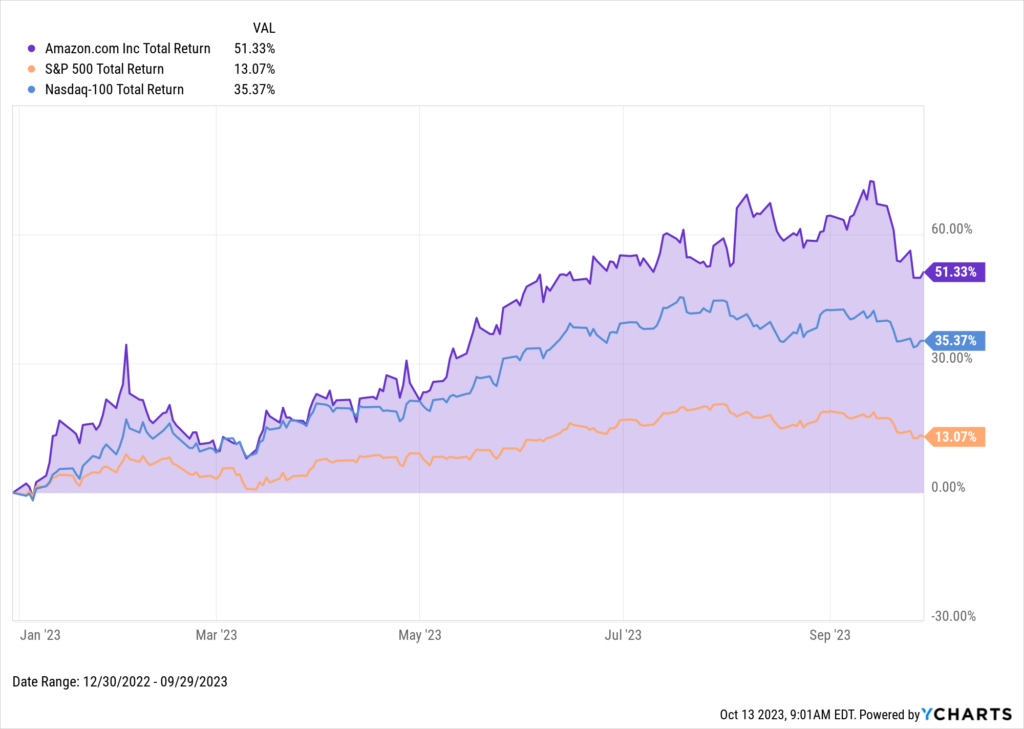
Thanks to cost-cutting initiatives, AI breakthroughs, and stellar Amazon Web Services (AWS) performance, Amazon (AMZN)’s stock is up 51.3% as of September 29th. Nonetheless, like Alphabet, recent headlines regarding Amazon have predominantly focused on an antitrust lawsuit that the FTC is pursuing.
Download Visual | Modify in YCharts
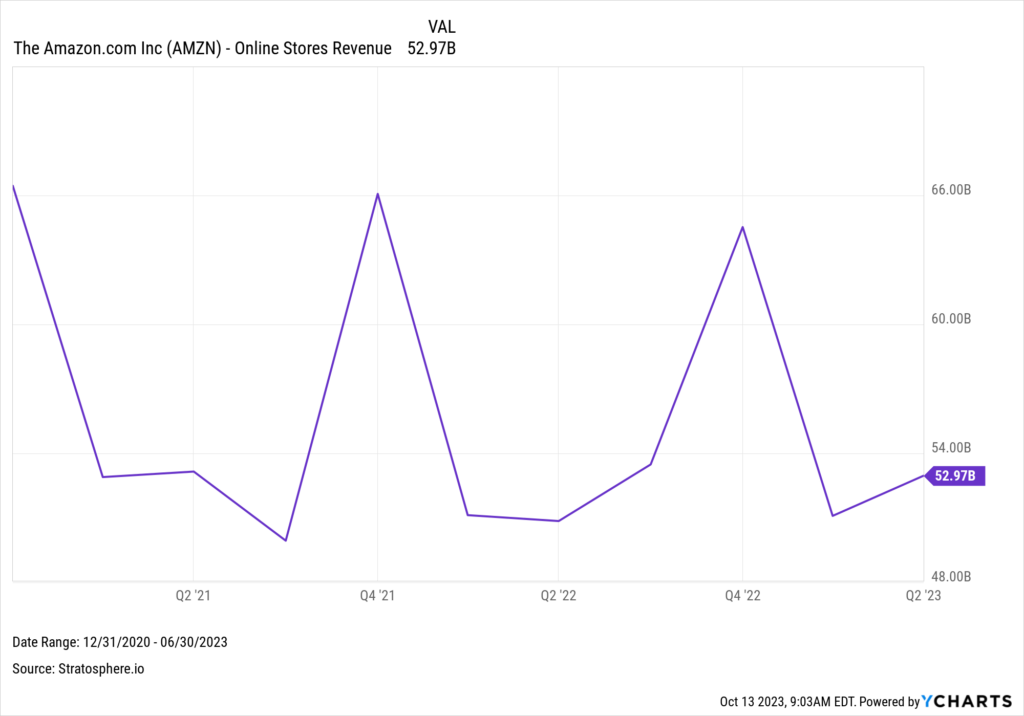
The online marketplace, a pivotal component of Amazon’s financial health that generated $53 billion in quarterly revenue, is at the center of this legal turbulence. The FTC asserts that Amazon suppresses products at lower prices on alternative sites and seeks an injunction to “pry loose Amazon’s monopolistic control.”
Download Visual | Modify in YCharts
Outside of the lawsuit, analysts tend to zoom in on Amazon Web Services (AWS) when dissecting Amazon’s overall performance. A significant milestone for AWS was the launch of Amazon Bedrock, a platform designed to enable AWS customers to cultivate enterprise-grade generative AI applications. Amazon enhanced its AI initiatives by announcing a $4 billion investment in Anthopic, a company that builds general AI systems, making AWS Anthropic’s primary cloud provider.
Andy Jassy, Amazon’s CEO, highlighted the significant role of AWS in the company’s renewed growth trajectory. Despite initial indicators of clients paring back AWS expenditures amid economic instability, Jassy observed a stabilization in this trend, stating: “While customers have continued to [cost] optimize during the second quarter, we’ve started seeing more customers shift their focus towards driving innovation and bringing new workloads to the cloud.”
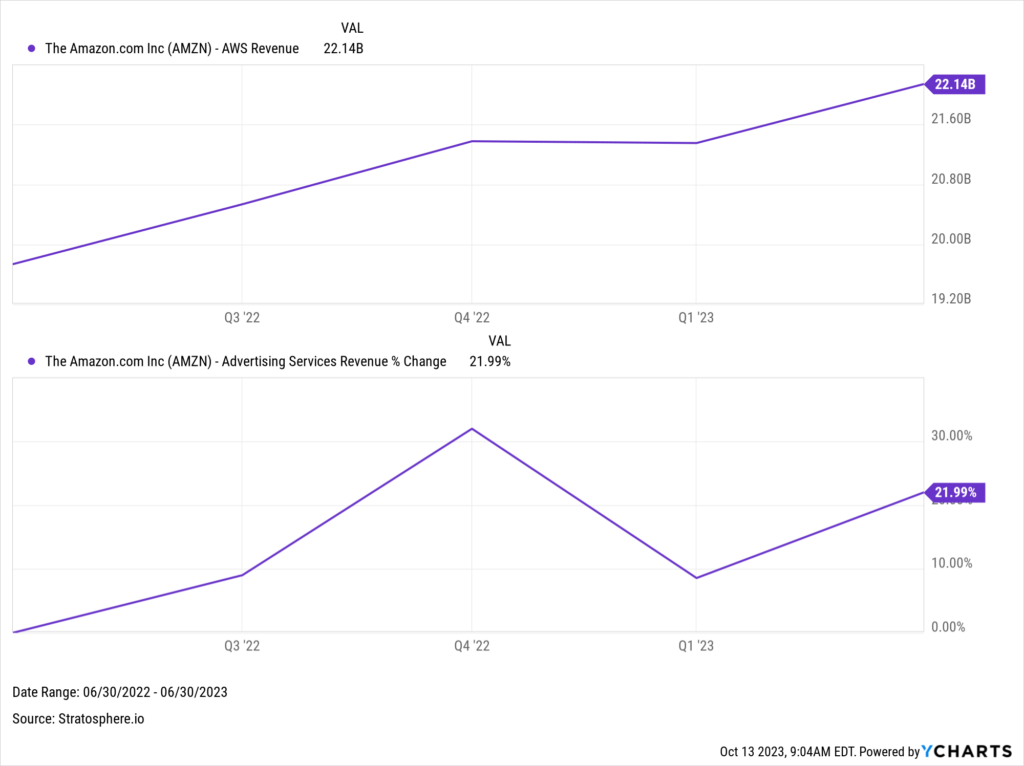
AWS sales rose 12% to $22.1B, and the segment injected $5.37B into the company’s cumulative operating profit of $7.7B.
Additionally, the advertising segment’s quarterly revenue surged 22% to $10.7B.
Download Visual | Modify in YCharts
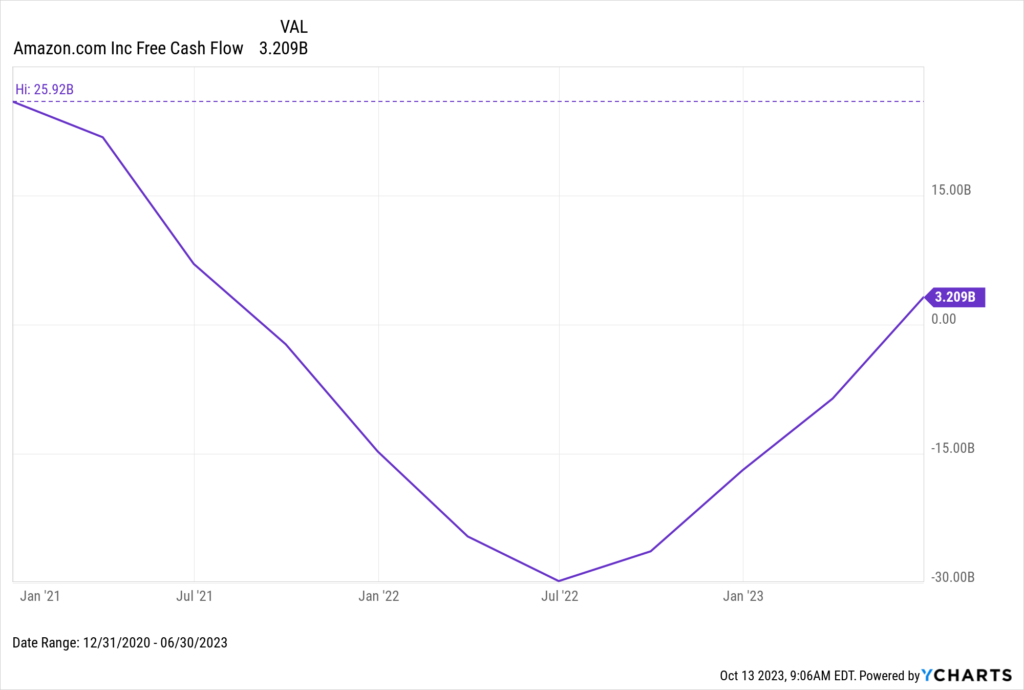
Looking at the balance sheet, Amazon managed to curtail its free cash flow (FCF) deficit, generating positive FCF for the first time since June 2021.
Download Visual | Modify in YCharts
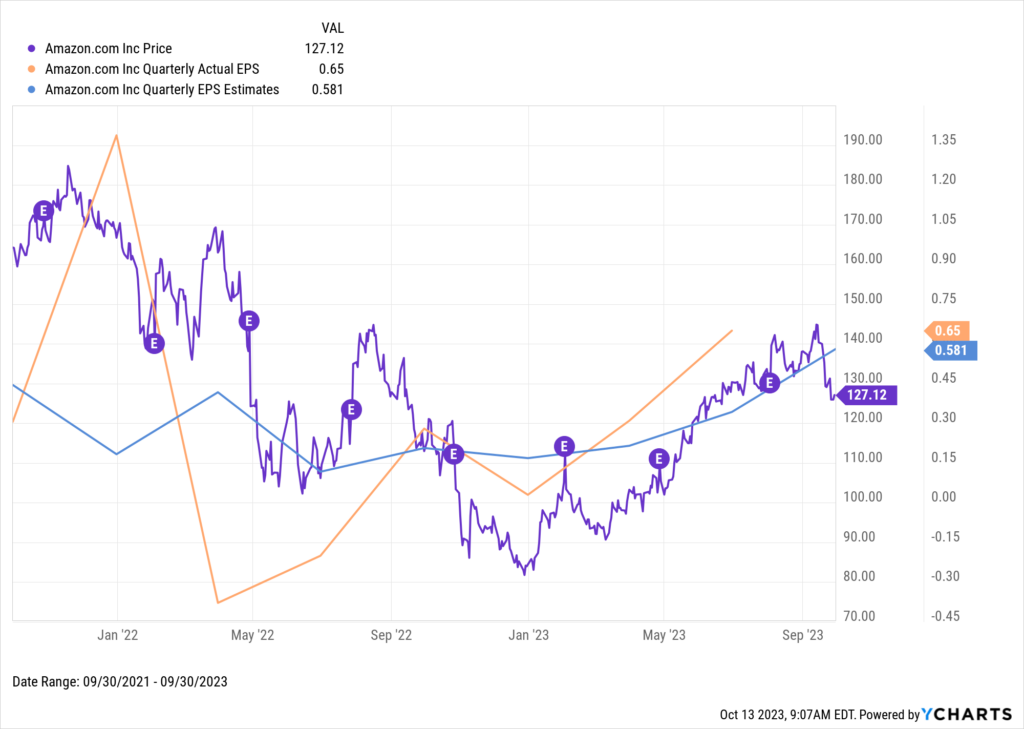
Last quarter, the company’s earnings came in at 65 cents per share, comfortably beating the expected 34 cents, representing a remarkable 425% escalation from the actual EPS of the previous year.
As Amazon prepares to announce earnings on October 27th, analysts are projecting an EPS of $0.58, implying a 107% year-over-year increase.
Download Visual | Modify in YCharts
Earnings Calendar for the Magnificent Seven
These companies have outperformed the broader market and set a solid foundation heading into the year’s final quarter. It’s evident that these industry behemoths are not just riding the wave of technological innovation, but they are the ones creating it. This earnings period will provide further insights into their growth trajectories and sector-wide trends.
The calendar below provides earnings announcement dates for the Magnificent Seven so you can stay updated on the biggest names in the market this earnings season. You can also create a similar earnings calendar in YCharts for other stocks or specific indices’ constituents.
Whenever you’re ready, there are three ways YCharts can help you:
Have questions about how YCharts can help you prepare for client meetings?
Email us at hello@ycharts.com or call (866) 965-7552. You’ll get a response from one of our Chicago-based team members.
Want to test out YCharts for free?
Start a no-risk 7-Day Free Trial.
Signup for our blog updates for more best practices to help your firm thrive
Enter Your Email to Recieve a Post-Earnings Season UpdateDisclaimer
©2023 YCharts, Inc. All Rights Reserved. YCharts, Inc. (“YCharts”) is not registered with the U.S. Securities and Exchange Commission (or with the securities regulatory authority or body of any state or any other jurisdiction) as an investment adviser, broker-dealer or in any other capacity, and does not purport to provide investment advice or make investment recommendations. This report has been generated through application of the analytical tools and data provided through ycharts.com and is intended solely to assist you or your investment or other adviser(s) in conducting investment research. You should not construe this report as an offer to buy or sell, as a solicitation of an offer to buy or sell, or as a recommendation to buy, sell, hold or trade, any security or other financial instrument. For further information regarding your use of this report, please go to: ycharts.com/about/disclosure
Next Article
Proactively Address Client Concerns During a Volatile Market EnvironmentRead More →