A Closer Look At October Flows: Where Did the Money Market Assets Go?
Without question, the biggest story of this month’s fund flow data is that $33.3B departed from Money Market funds in October, marking the first time this year that this category has seen net negative flows.
So the question is, where did it all go?
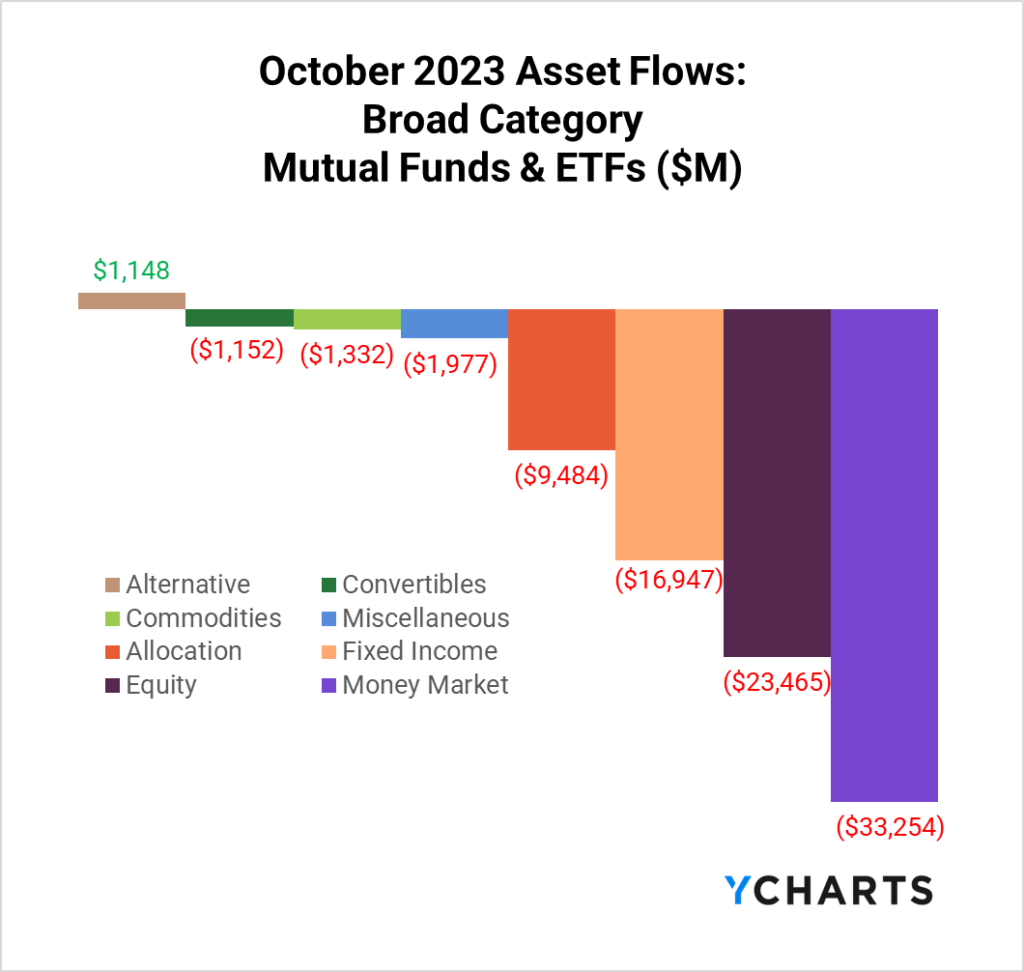
Immediately, what jumps out is that all but one broad category had negative flows, so to better understand what happened in October, YCharts took out our magnifying glass.
For a more nuanced look at monthly flows, sign up for a copy of our Fund Flows Report and Visual Deck (clients only):Passive Vs Active Fund Flows in October
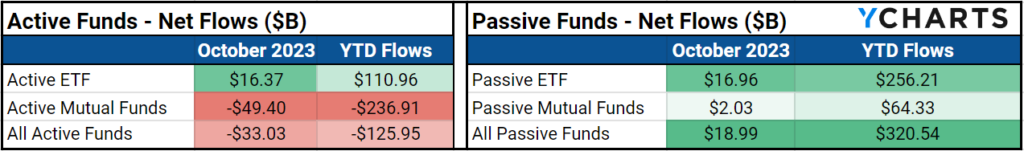
Before diving into category flows, checking in on the age-old passive vs. active flow discussion shows that despite passive funds attracting $19B and active funds losing $33B, passive ETFs ($16.96B) narrowly edged out active ETFs ($16.37B) in inflows in October.
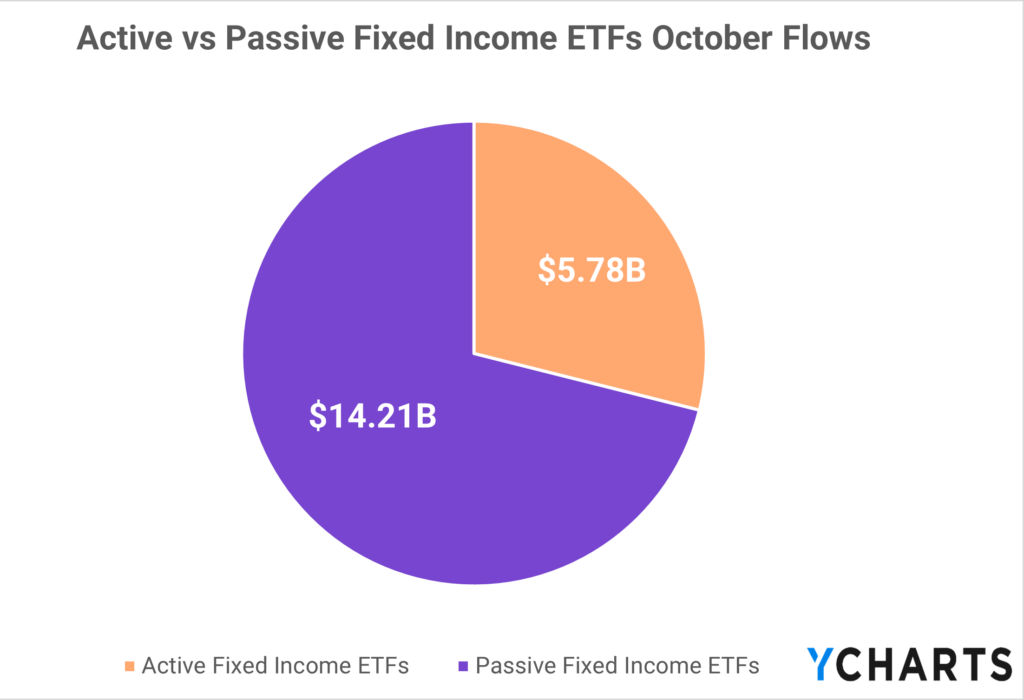
Looking closer at the divide between passive and active ETFs, active fixed-income ETFs brought in $5.78B in October. As fixed income becomes more attractive to advisors in today’s environment, this is a trend to watch to determine if advisors are finding value in an active strategy regarding the fixed-income sleeve of their client’s portfolios.
Fixed Income Fund Flows
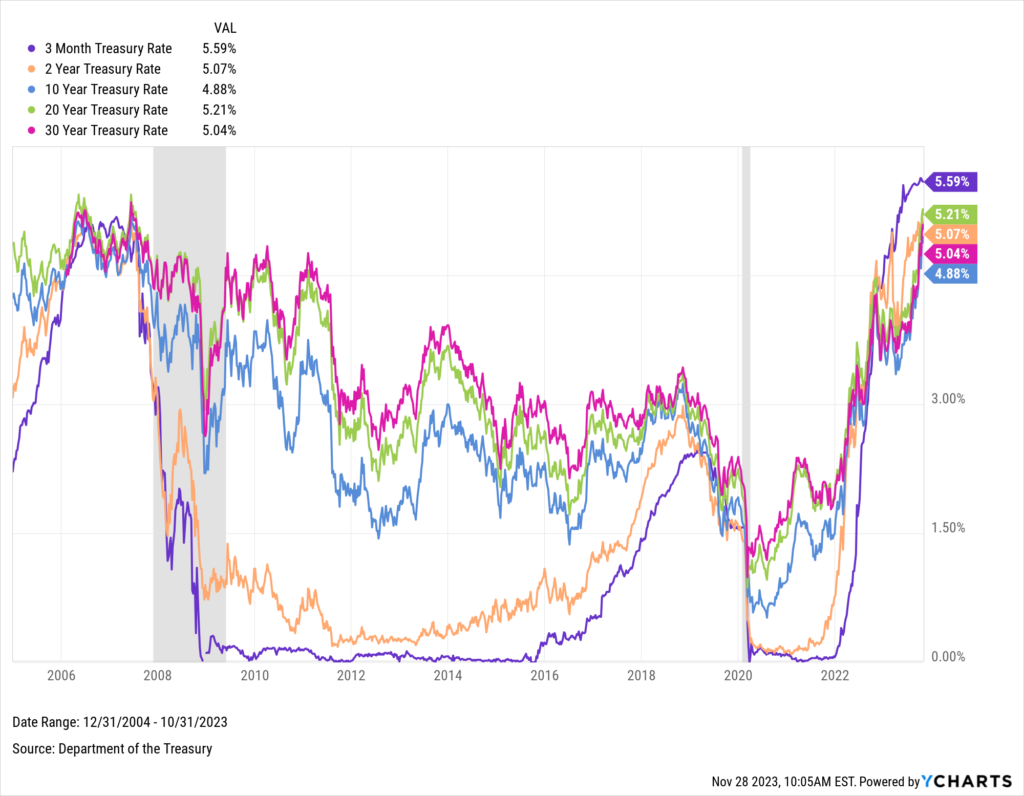
Back to the original question of where the assets from money market funds went, most would immediately look to fixed funds despite the category seeing $16.95B depart in October. With treasury yields nearing 15-year highs across various durations, several fixed-income products became more attractive in October.
Download Visual | Modify in YCharts
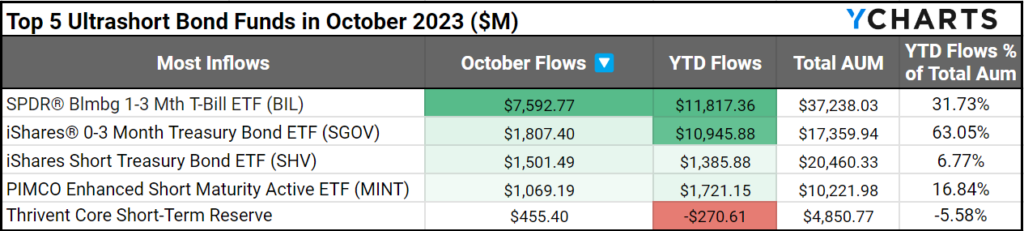
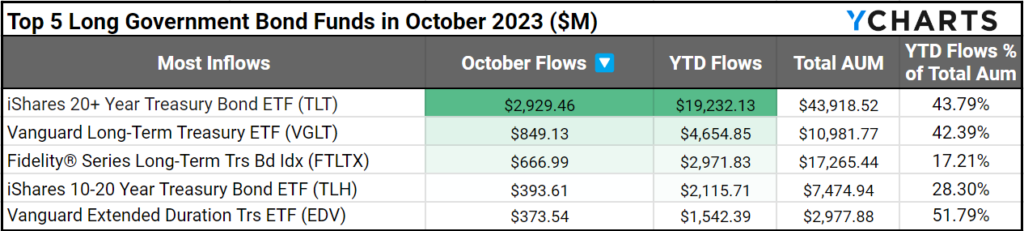
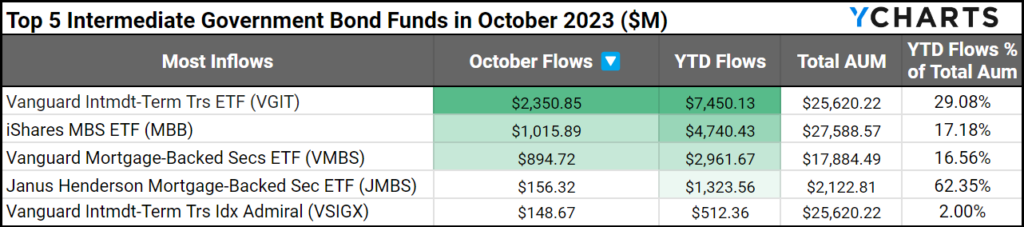
Specifically, Ultrashort ($14.3B), Long Government ($6.3B), and Intermediate Government ($3B) Bond funds were beneficiaries of treasury rates ascending.
The biggest beneficiary in the Ultrashort bond category was SPDR® Blmbg 1-3 Mth T-Bill ETF (BIL), bringing in $7.6B in assets in October.
Download Visual | Modify the Comp Table in YCharts
In the Long Government category, iShares 20+ Year Treasury Bond ETF (TLT) led the way, attracting $2.9B in October.
Download Visual | Modify the Comp Table in YCharts
In October, Vanguard Intmdt-Term Trs ETF (VGIT) paced Intermediate Government fund flows with $2.4B.
Download Visual | Modify the Comp Table in YCharts
Small Cap Value ETFs
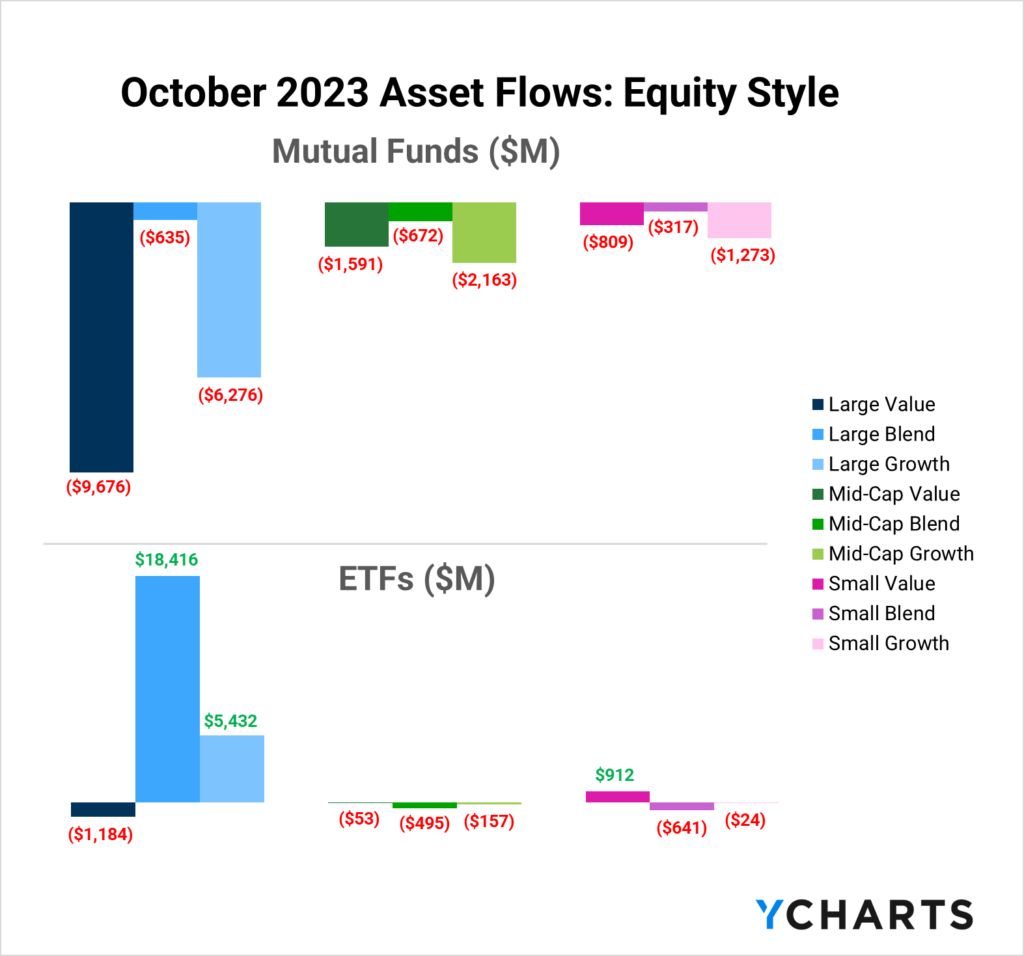
On the equity side, only Large Blend, Growth, and Small Cap Value ETFs had net positive flows in October. Considering the stories for Large Blend and Growth have been established for the year, let’s see what’s happening in the small cap value world.
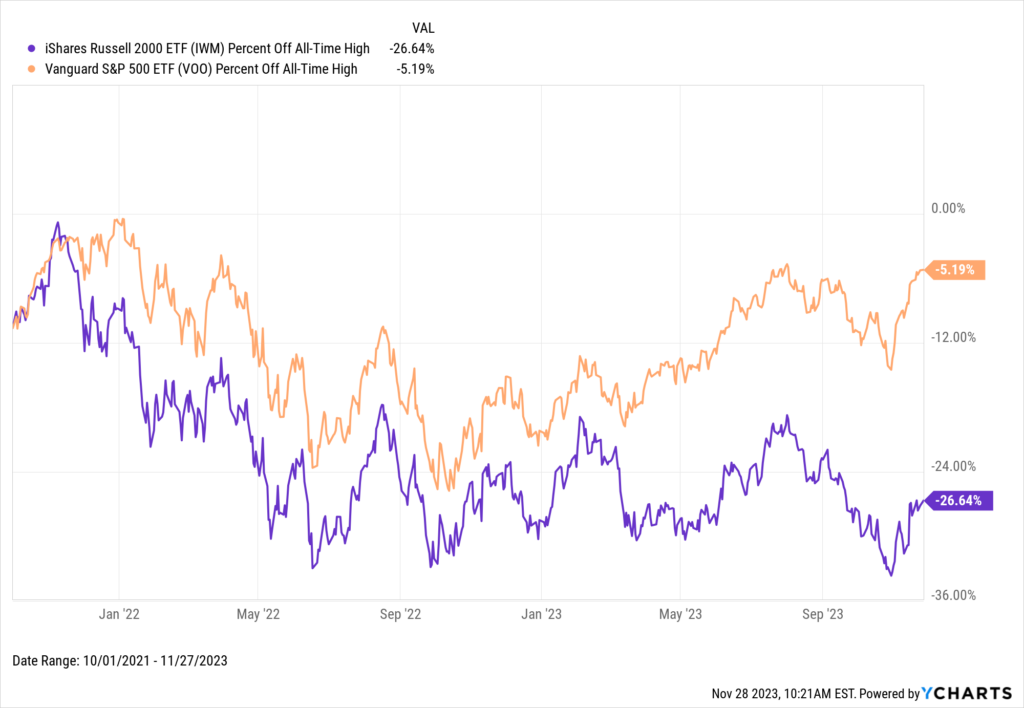
For starters, small-caps, in general, are presenting an intriguing opportunity as the Russell 2000, represented by the iShares Russell 2000 ETF (IWM), is 26.6% off its all-time high, while the S&P 500, represented by the Vanguard S&P 500 ETF (VOO), is 5.2% off its ATH. So, there could be a sense among investors that small caps have already felt their fair share of pain from a rapid rise in interest rates over the past 18 months, and there could be a rally in store for the smallest names in the market.
Download Visual | Modify in YCharts
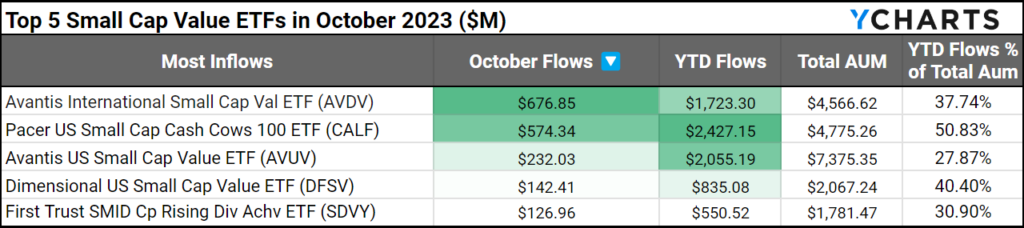
If that’s the case, Avantis International Small Cap Val ETF (AVDV), Pacer US Small Cap Cash Cows 100 ETF (CALF), and Avantis US Small Cap Value ETF (AVUV) have attracted the most assets in October.
Download Visual | Modify the Comp Table in YCharts
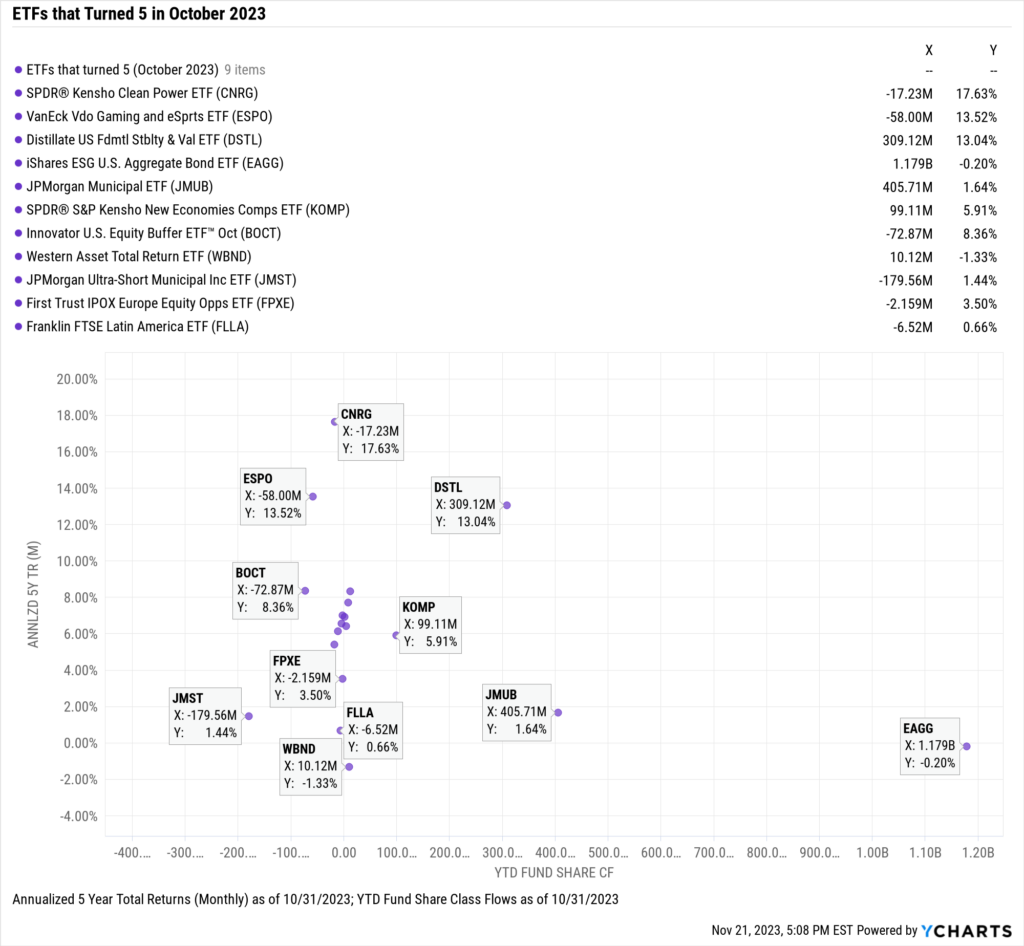
These ETFs Celebrated their 5th Inception Anniversary
The fifth anniversary of an ETF is a special one. It allows the asset manager to highlight the longer-term performance of their strategy, and more importantly, it could mean that more advisors have access to investing in a particular fund.
These ETFs had an inception date between 9/28/2018 (a Friday) and 10/31/2018. Here’s how they’re doing.
SPDR® Kensho Clean Power ETF (CNRG), VanEck Vdo Gaming and eSprts ETF (ESPO), and Distillate US Fdmtl Stblty & Val ETF (DSTL) are leading the clubhouse with 17.6%, 13.5%, and 13% annualized five-year total returns (monthly), respectively.
Meanwhile, iShares ESG U.S. Aggregate Bond ETF (EAGG) is leading the way with $1.2B in inflows year-to-date.
Use this Comp Table to Build this Scatterplot
How To Leverage Fund Flow Data as a Wholesaler
Let the trend be your friend, whether strategizing for ETF assets conversion or capitalizing on inflows into Government Bond funds. Being well-informed empowers your conversations with advisors, offering them current and relevant market insights.
Sign up to get a copy of our Fund Flows Report and Visual Deck sent to you monthly (clients only):YCharts offers several tools to help illustrate why an advisor should use your strategy as they rebalance portfolios for the end of the year and the start of 2024. From unearthing competing funds using the Fund Screener to crafting compliant-friendly Scenarios to Stress Testing your fund’s performance in similar market environments, YCharts has got you covered.
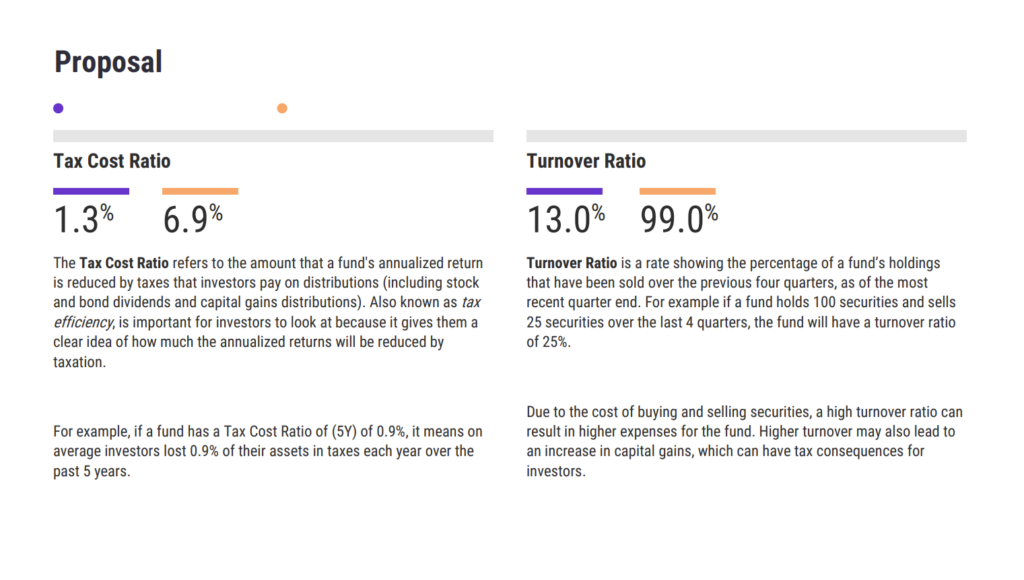
With the power of Talking Points and Proposals, you can create high-level messaging to position your fund as a superior alternative. Whether presenting your fund as an opportunity to save an advisor’s client money during tax season or simply showcasing your fund as a higher yield alternative, you can use YCharts’ Proposals and Talking Points to provide an advisor with high-level reasons why your fund is the right choice for their clients.
Start a Trial to Build Your Own Proposal
Whenever you’re ready, there are three ways YCharts can help you:
Have questions about how YCharts can help you grow AUM and prepare for meetings?
Email us at hello@ycharts.com or call (866) 965-7552. You’ll get a response from one of our Chicago-based team members.
Sign up for a copy of our Fund Flows Report and Visual Deck (clients only):
Unlock access to our Fund Flows Report and Visual Deck by becoming a client.
Dive into YCharts with a no-obligation 7-Day Free Trial now.
Disclaimer
©2023 YCharts, Inc. All Rights Reserved. YCharts, Inc. (“YCharts”) is not registered with the U.S. Securities and Exchange Commission (or with the securities regulatory authority or body of any state or any other jurisdiction) as an investment adviser, broker-dealer, or in any other capacity, and does not purport to provide investment advice or make investment recommendations. This report has been generated through application of the analytical tools and data provided through ycharts.com and is intended solely to assist you or your investment or other adviser(s) in conducting investment research. You should not construe this report as an offer to buy or sell, as a solicitation of an offer to buy or sell, or as a recommendation to buy, sell, hold or trade, any security or other financial instrument. For further information regarding your use of this report, please go to: ycharts.com/about/disclosure
Next Article
Your Complete Guide to Sector RotationRead More →