A Wholesaler’s Guide to Minimize Distributions & Maximize AUM
As Q3 2023 draws to a close, the financial markets continue to recover from last year’s drawdown. The S&P 500 is up 17.3% this year despite the Federal Reserve raising interest rates 500 basis points in less than 18 months.
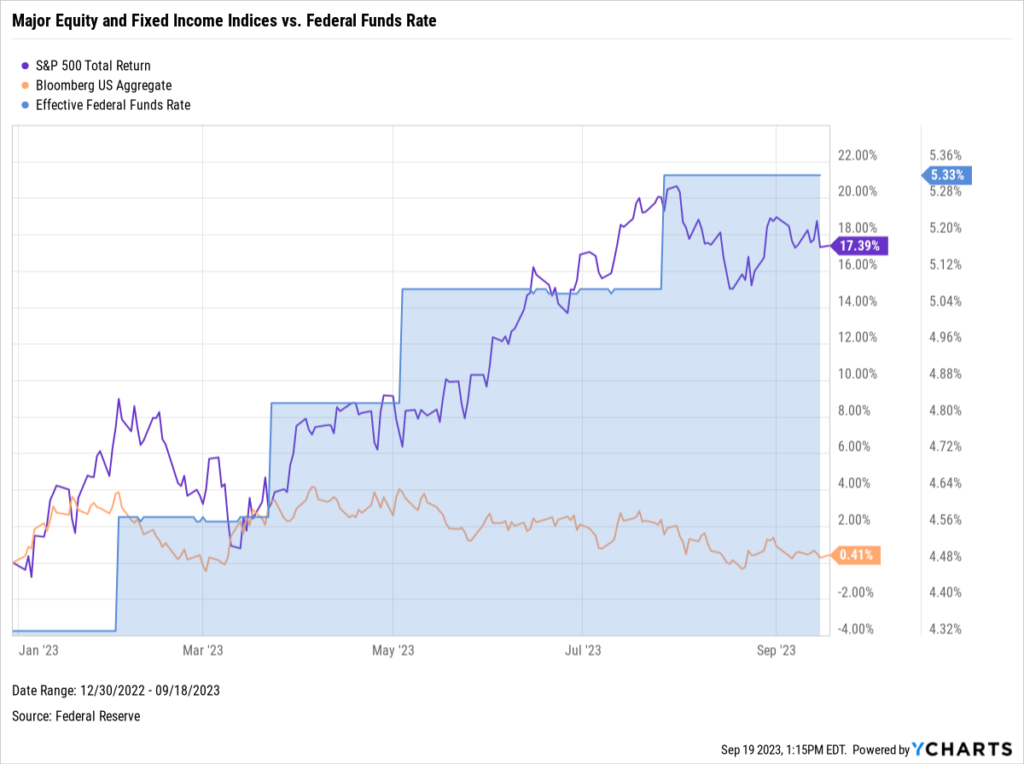
Download Visual | Modify in YCharts
Fund managers are fine-tuning their strategies to sidestep potential tax repercussions for their clients. These sizeable distributions can arise from escalated asset sales or portfolio rebalancing by fund managers aiming to leverage market gains. As a wholesaler, this is an opportunity for you to develop relationships with advisors. How can you help limit distributions and associated tax side effects for the advisors you work with?
With YCharts, you can quickly identify funds that are likely to have large capital gains distributions and recommend suitable replacements. This collaborative approach can serve as a cornerstone in building resilient, value-driven relationships with the advisors you work with.
(Disclosure: you should always check a fund manager’s website for tax information pertinent to their funds and investors.)
To learn more, read our Wholesaler Perspective on Identifying Tax Loss Harvesting Opportunities.
Leveraging Data to Find Replacement Opportunities
Until they are actually distributed, it’s difficult to know the exact value of any long or short-term capital gains that will be passed on to a fund’s investors. That said, YCharts can help you find funds that are likely to have the largest distributions to investors.
We’ll use the metrics below to identify those funds:
Potential Capital Gain — an estimated percentage of a fund’s assets that may be distributed as future capital gains; this metric is an estimate and is provided by Morningstar®
Distribution Yield — the percentage of the current share price that an investor received as distributions, including dividends and capital gains, over the past 12 months
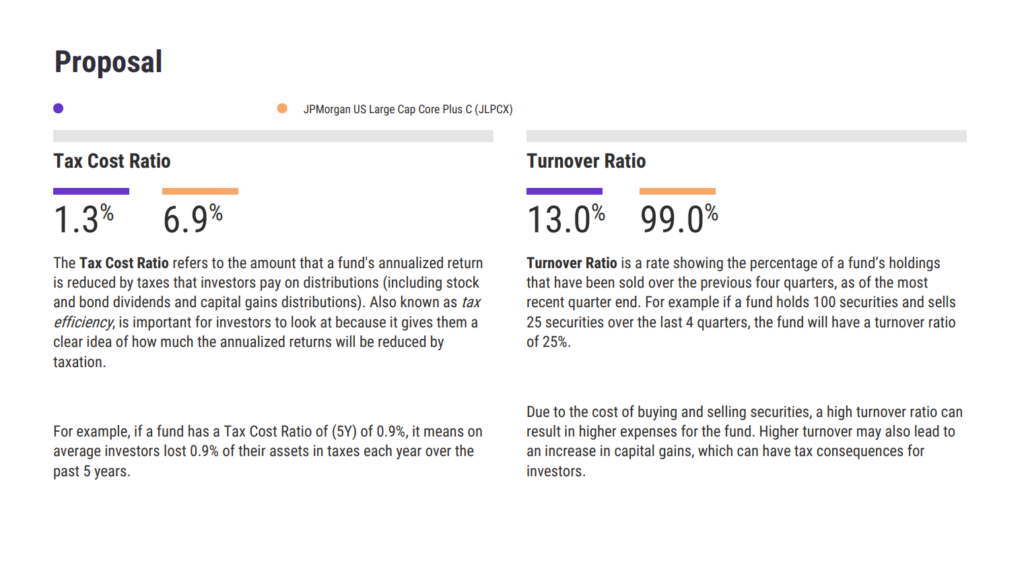
Tax Cost Ratio — the amount that a fund’s annualized return is reduced by taxes that investors must pay on distributions (including stock and bond dividends and capital gains distributions); also known as tax efficiency
Turnover Ratio — the percentage of a fund’s holdings that have been replaced over the past twelve-month period
YTD Fund Level Flows — Larger outflows suggest rising investor wariness and could be a sign of upcoming selling to meet redemptions.
Preparing for Your End-of-Year Meetings
The objective of this exercise is to identify funds that are likely to pay out large distributions, note which advisors are using those funds, position your funds as suitable alternatives, and help advisors avoid investing in a fund with an impending distribution.
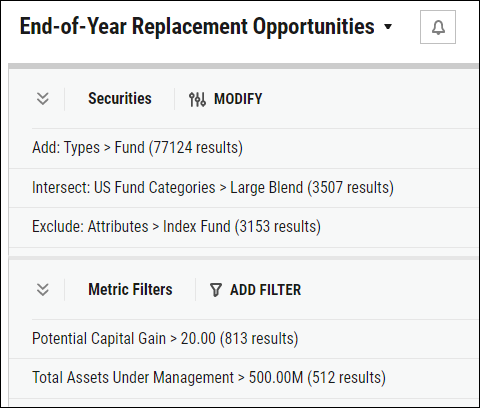
Starting in the Fund Screener, add a few filters that will narrow our universe to a more manageable list of funds that are ripe for replacement.
Per the example below, screen for funds in the Large Blend category with over $500 million in Total AUM and Potential Capital Gains over 20% of the fund’s NAV.
Exclude all index funds as their benchmark-tracking nature means they perpetually carry unrealized gains and should not be considered as part of this exercise.
Download Visual | Modify in YCharts
When working with a specific advisor, add a filter for Brokerage Availability to limit the Fund Screener results to only those funds that the advisor can access.
For example, if you are working with an advisor at Morgan Stanley, you could filter to show only funds on the Morgan Stanley Select UMA platform. Similarly, you can pull up competitor funds to see where they may be exposed.
Download Visual | Modify in YCharts
Next, add Potential Capital Gain, Distribution Yield, Turnover Ratio, and Tax Cost Ratios for several durations using the “+ Metrics Columns” button to capture as much historical information as possible. In combination, these metrics paint a complete picture of each fund’s tax efficiency.

Download Visual | Modify in YCharts
To avoid relying on a single metric when evaluating replacement opportunities, use Scoring Models to combine all of the metrics and create a single, numerical ranking to aid in your decision-making.
According to the score outlined below, funds that rank at or near number one are the least tax-efficient, and thus the best opportunities for replacement.
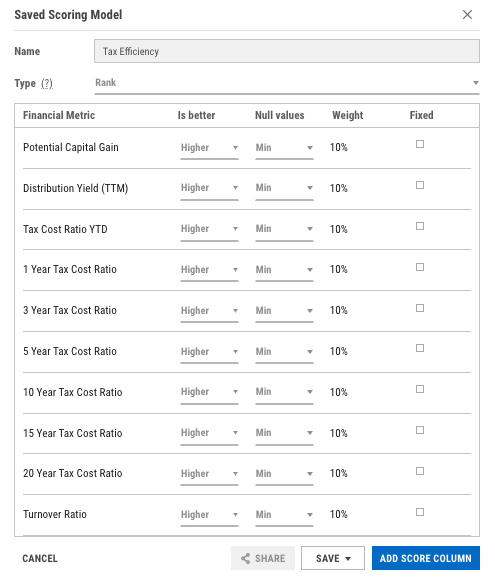
The Scoring Model above ranks each metric equally at 10%. However, you can add more or less weight to any chosen metric based on importance so long as all weights add up to 100%.
Once the Scoring Model is added to the Fund Screen, sort the results by their scores and dig into the highest-ranking funds, which are the least tax-efficient, for potential replacement opportunities.
Digging Deeper Into the Best Opportunities
The goal of this workflow is to hone in on a specific fund and its historical metrics to create an optimized strategy to avoid large distributions.
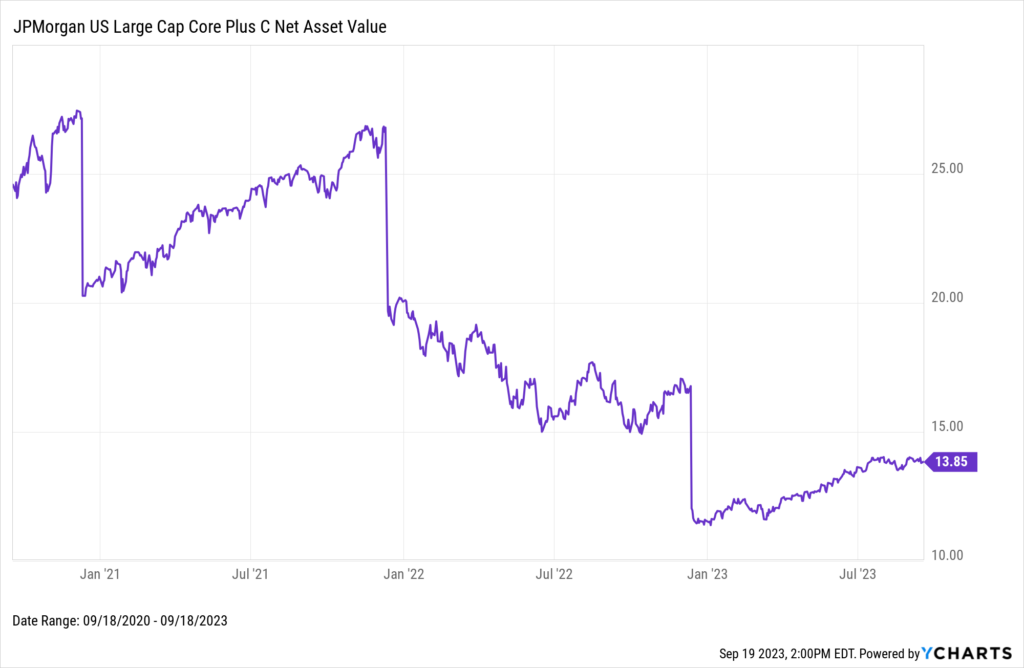
The Fund Screen and Scoring Model showed that one of the least tax-efficient funds on our list is the JPMorgan US Large Cap Core Plus I fund (JLPSX).
Notably, JLPSX has remarkably rotated 99% of its assets over the past year, with a distribution yield of 26.65% for the same period.
From the JPMorgan US Large Cap Core Plus I fund quote page, shown below, click on the “Data” tab, then type “dividend” in the metric field to see all historical distributions.
In December 2021, the fund distributed long-term capital gains of $4.84 per share and brought the fund’s net asset value down from $16.78 to about $12.04 — your advisor partners could have used a tip-off!
Viewing distributions by value and date also provides an opportunity to look for patterns. It appears that JLPSX has issued distributions between December 11th to the 13th, dating back to 2017. For advisors looking to avoid this year’s distributions, December 10th or earlier should be the target date to escape unscathed.
Download Visual | Modify in YCharts
Whether you’re prepping for a meeting with an advisor or in the middle of a conversation with a prospect, YCharts ensures you have all of this information available for you to pull up on the fly.
Aligning Interests with Advisor-Partners
With so much money in motion, as we head into the end of the year, wholesalers and financial advisors can align their interests around optimizing tax efficiencies.
By leveraging YCharts’ powerful tools and data, wholesalers can make data-driven recommendations that help their advisor-partners avoid distributions and protect their clients’ investments. By creating engaging Talking Points and utilizing the Report Builder, you can vividly illustrate the attributes that make your fund an optimal choice for replacement, aligning precisely with the pressing demands and expectations of the present financial environment.
You can significantly amplify your engagement with advisors by offering them a detailed comparison report. This can include personalized Talking Points that spotlight the unique advantages of your strategy, effectively addressing an advisor’s specific needs and positioning it as a frontrunner to be the new preferred fund. Accentuate key elements such as your fund’s low turnover ratio or superior tax efficiency.
Start a Trial to Build Your Own Proposal
The ability to easily access, analyze, and present data, are vital resources for asset managers who want to position themselves and their funds for success. With YCharts, wholesalers can identify the right funds for the right advisors at the right time, building trust and gathering assets along the way.
Connect with YCharts
To learn more, schedule time to meet with an asset management specialist, call us at (773) 231-5986, or email hello@ycharts.com.
Want to add YCharts to your technology stack? Sign up for a 7-Day Free Trial to see YCharts for yourself.
Disclaimer
©2022 YCharts, Inc. All Rights Reserved. YCharts, Inc. (“YCharts”) is not registered with the U.S. Securities and Exchange Commission (or with the securities regulatory authority or body of any state or any other jurisdiction) as an investment adviser, broker-dealer, or in any other capacity, and does not purport to provide investment advice or make investment recommendations. This report has been generated through application of the analytical tools and data provided through ycharts.com and is intended solely to assist you or your investment or other adviser(s) in conducting investment research. You should not construe this report as an offer to buy or sell, as a solicitation of an offer to buy or sell, or as a recommendation to buy, sell, hold or trade, any security or other financial instrument. For further information regarding your use of this report, please go to: ycharts.com/about/disclosure
Next Article
How Wholesalers Use YCharts to Help Identify Tax Loss Harvesting OpportunitiesRead More →