How Wholesalers Use YCharts to Help Identify Tax Loss Harvesting Opportunities
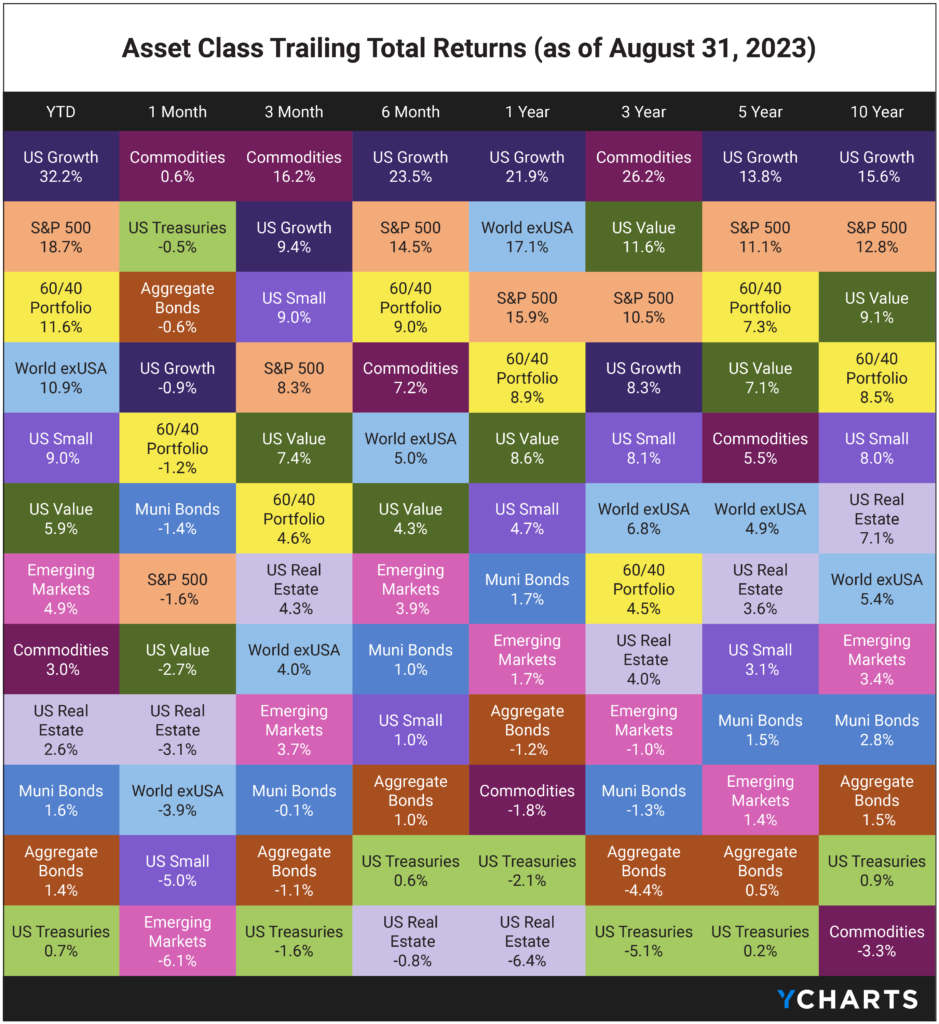
In the first three quarters of 2023, the markets have surged back from 2022’s historic downturn. The Federal Reserve seems to be nearing the end of its rigorous campaign against persistent inflation. Despite a 500bp surge in interest rates spanning less than 18 months, the stock market has exhibited remarkable resilience, with the S&P 500’s level escalating by 18.7% YTD. Meanwhile, the rate hikes have ushered in a period of enticing yields for fixed-income investors. 60/40 portfolio enthusiasts have multiple reasons to celebrate in this landscape, especially after both components of the portfolio took a hit in 2022.
Given the market’s resurgent performance, advisors might view this as an opportune moment to adopt a more nuanced approach to tax-loss harvesting. Even in prosperous times, there may be select underperforming assets, and realizing these losses can provide a valuable tax offset. This represents an opportune moment for wholesalers to actively engage with new prospects and their existing advisor-clients, proposing innovative approaches to maximizing profits and fostering wealth growth in a favorable market environment.
Tax-loss harvesting is the practice of selling certain securities at a loss with the goal of offsetting a portfolio’s capital gains to limit an investor’s tax liability. The kicker here is that excess losses not utilized during that year can be carried forward indefinitely to further reduce tax liabilities on any gains in future years. For this reason, advisors are incentivized to sell funds that will fetch hefty losses during market downturns. That’s when wholesalers come into play—to provide their advisors with replacement options to fill that holdings gap.
Below are two tax-loss harvesting workflows that wholesalers can use. Both will highlight the most valuable YCharts features for each step in the process.
Identify Fund Replacement Opportunities
Objective: Identify funds that could potentially be tax-loss harvesting candidates for advisors holding them, while ensuring that any proposed replacement funds will provide exposure coverage for the advisor’s portfolios.
Starting in the Fund Screener, add filters to narrow the universe of funds and create a targeted list of securities you could replace.
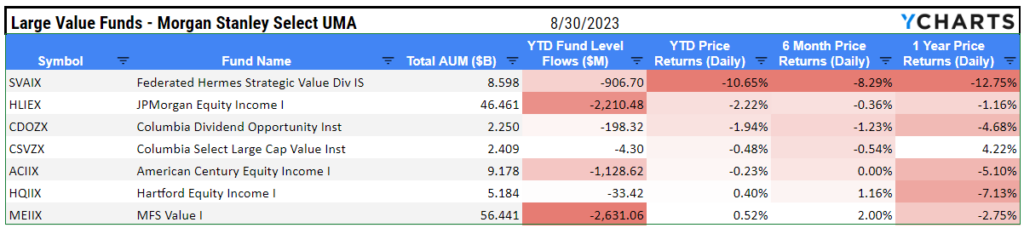
In the example below, filters were applied for Large Value funds with $2 billion or more in total AUM. For an even more targeted approach, you can use the Brokerage Availability filter to narrow the selection of funds down to their availability at certain firms (Morgan Stanley Select UMA in this example).
Next, add financial metrics of interest to provide a holistic view of the funds’ historical performance. Here, the Screener utilizes Total Assets Under Management, year-to-date Fund Levels Flows, and Price Returns, which exclude dividends and distributions for the Year-to-Date, 6-Month, and 1-Year periods.
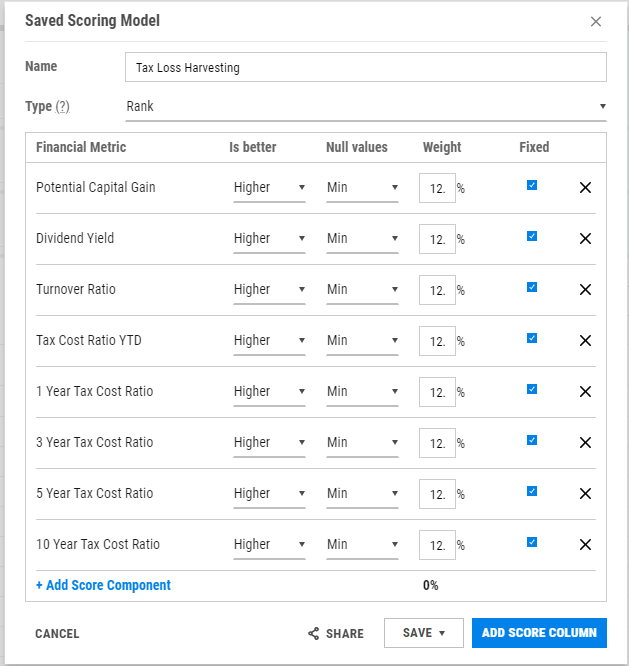
To avoid relying on a single metric when evaluating replacement opportunities, Scoring Models combine any number of quantitative metrics to create a single numerical ranking, as seen below.
Download Visual | Modify in YCharts
Based on the Screener results (as of writing), Federated Hermes Strategic Value Div IS (SVAIX) is primed for replacement with over $900M in outflows this year, poor YTD returns, and unattractive tax efficiency. As a current loss leader, replacing this fund could potentially benefit an advisor’s clients by limiting their tax liabilities down the line.
Download Visual | Modify in YCharts
After identifying a fund that might be ripe for replacement, wholesalers will need to compare its exposure to funds in their own family to ensure they are comparable. Leveraging the Quickflow tab on the quote page, you can seamlessly compare up to 12 funds based on aspects such as style, geographic region, or sector exposure.
Visually Communicate The Tax Loss Harvesting Opportunity to Your Client
Objective: Highlight funds that would be ideal tax-loss harvesting candidates and visually narrate the relationship between total returns and a fund’s net asset value (NAV).
To provide further context, use Fundamental Charts to visualize the performance of several funds over various periods. For instance, add two different metrics, such as “Total Return Level” and “Net Asset Value,” and a group of comparable funds (DIVZ, BHBFX, CHDVX, COHOX, FBPEX, MADFX, and SVAIX in this example), and separate the data into two panels by financial metric. By stripping out dividends and distributions, you can provide an advisor with a more accurate representation of the tax loss harvesting opportunity.
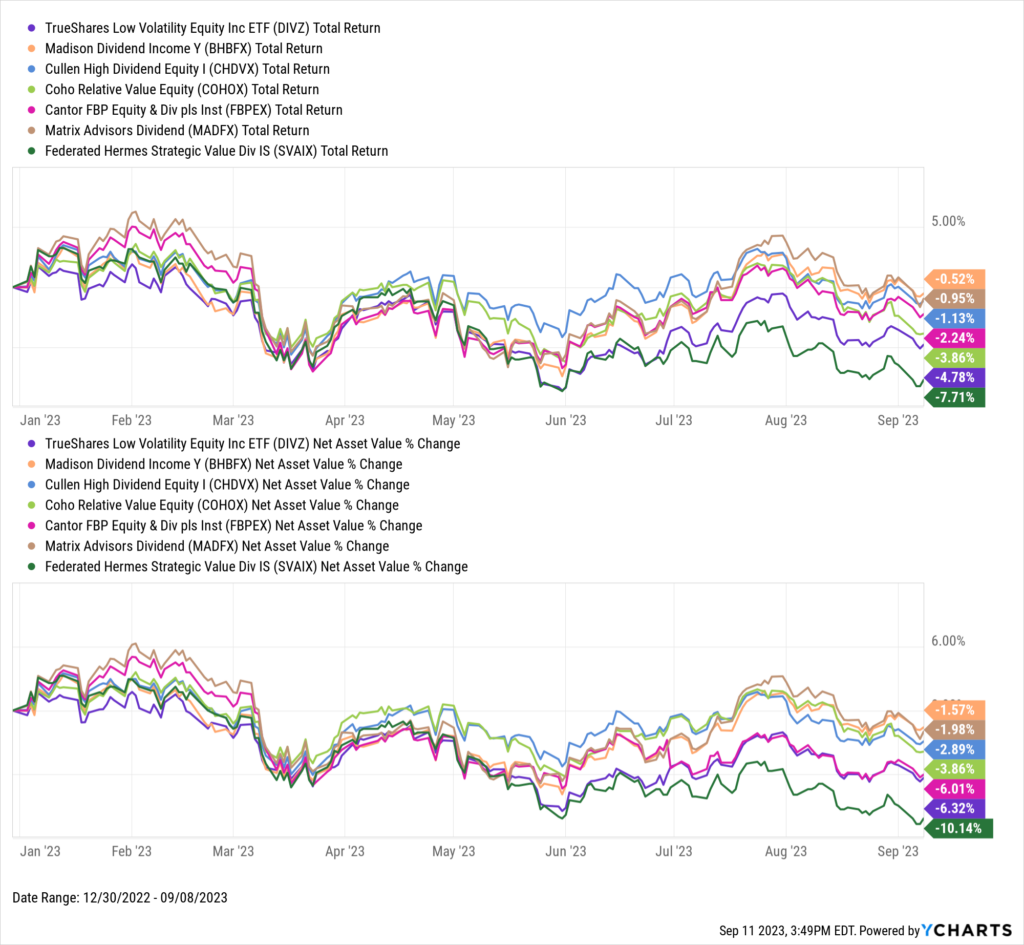
Download Visual | Modify in YCharts
Take note of the custom date range in the upper right-hand corner of the chart. Suppose an advisor wants to see the activity of one or more funds based on the date they originally purchased the security. In that case, wholesalers can dynamically update the chart during an advisor meeting.
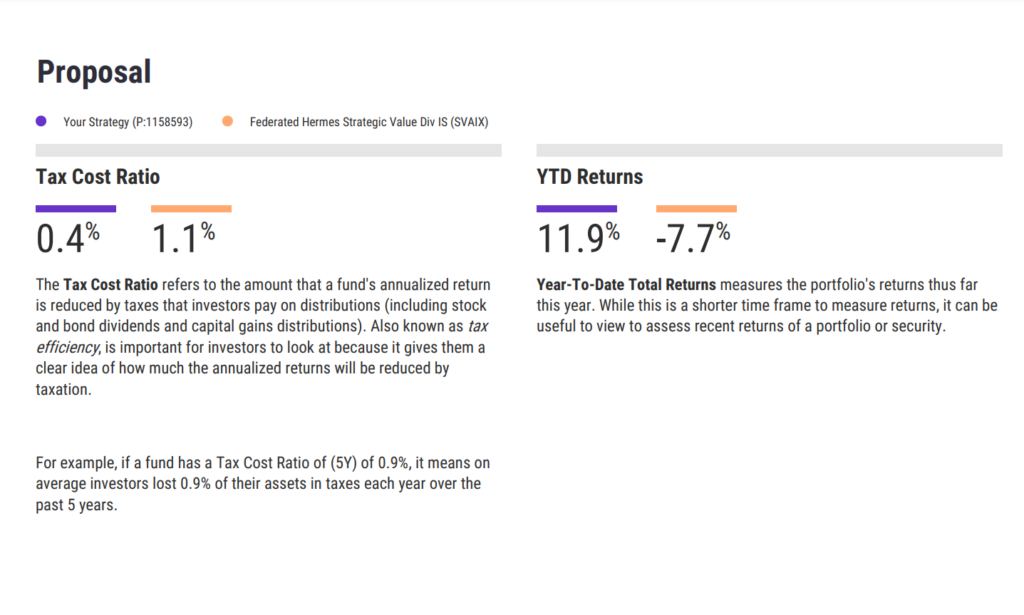
To further enhance your engagement with advisors, send them a comparison report. This report could include personalized Talking Points that emphasize your strategy’s distinct advantages to address an advisor’s needs and make it a strong contender to be the preferred replacement fund. Highlight significant facets such as your fund’s tax efficiency or its Year-To-Date (YTD) returns, as showcased in the example below, to create a compelling case (discover how to craft your personalized Talking Points by watching the video below).
Start A Free Trial to Customize Your Talking Points
Provide Advisors a Solution Before They Need It
By leveraging YCharts’ powerful tools and data, wholesalers can make data-driven recommendations that help their advisor-partners protect clients’ investments and limit tax liabilities.
Data, combined with the ability to easily access and analyze it, are vital resources for asset managers who want to position themselves and their funds for success. With YCharts, wholesalers can identify the right funds for the right advisors at the right time, building trust and growing AUM along the way.
Learn more about how you can make better tax-efficient recommendations for your advisors-clients:
Connect with YCharts
To learn more, schedule time to meet with an asset management specialist, call us at (773) 231-5986, or email hello@ycharts.com.
Want to add YCharts to your technology stack? Sign up for a 7-Day Free Trial to see YCharts for yourself.
Disclaimer
©2022 YCharts, Inc. All Rights Reserved. YCharts, Inc. (“YCharts”) is not registered with the U.S. Securities and Exchange Commission (or with the securities regulatory authority or body of any state or any other jurisdiction) as an investment adviser, broker-dealer, or in any other capacity, and does not purport to provide investment advice or make investment recommendations. This report has been generated through application of the analytical tools and data provided through ycharts.com and is intended solely to assist you or your investment or other adviser(s) in conducting investment research. You should not construe this report as an offer to buy or sell, as a solicitation of an offer to buy or sell, or as a recommendation to buy, sell, hold or trade, any security or other financial instrument. For further information regarding your use of this report, please go to: ycharts.com/about/disclosure
Next Article
NEW on YCharts: Proposals & Talking PointsRead More →