3 Ways to Identify Your Fund’s Strengths Against Competitors
In an uncertain market environment, wholesalers can’t go quiet hoping their fund’s performance will be enough to keep advisors happy. Instead, the best wholesalers are proactively hunting for ways to provide value to advisors, building new relationships and strengthening their existing ones.
With YCharts, wholesalers can quickly build comp sets and visuals layered with data to help advisors make better allocation decisions in choppy markets.
Proactively Identify Replacements for Underperforming Holdings
After a challenging 2022 and a seesaw start to 2023, some advisors may be looking to update the funds utilized in their models or client portfolios. This presents an opportunity for wholesalers to secure face time with advisors and position their own funds as replacement opportunities.
Suppose you ask for an advisor’s holdings after showing them YCharts’ portfolio construction capabilities, and they agree to share their portfolio offerings. Pull that list into YCharts Comp Tables and use the pre-built Metric Set “Ranked in Category” to identify the top performers, laggards, and most importantly, your top replacement targets.

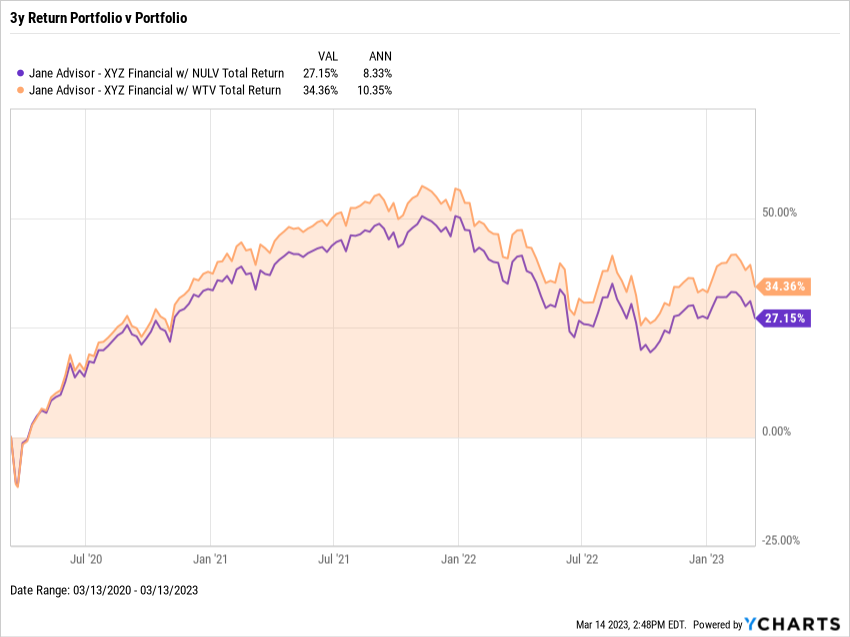
In this scenario, assume you’ve identified Nuveen ESG Large-Cap Value ETF (NULV) as a potential replacement based on its weakening Total NAV Returns relative to its category, Large Value Equity.
Using YCharts Quickflows and the “Find Funds Ranked in Category” option, wholesalers can identify comparable, better-performing replacement funds in a matter of clicks. Among funds in the Large Value Equity category, the WisdomTree Value ETF (WTV) has consistently led the pack through recent downturns.

To illustrate how the portfolio would have performed with WTV instead of NULV, use YCharts Model Portfolios to replicate the advisor’s portfolio and swap out the holdings. Then, leverage Fundamental Charts to drive home the point with a compelling visual comparison. If or when an advisor has follow-up questions about other metrics they watch closely, you can access that data and update the chart on the fly, maintaining momentum in the conversation.
Compare Funds to Find Your Competitive Advantage
The goal of a fund comparison is to differentiate your products from competitors’ and to showcase your funds’ strengths. Armed with this knowledge and supporting collateral, wholesalers can make better, data-driven recommendations to advisors and position their funds for AUM growth.
The example below gives a “hit list” of corporate bond mutual funds that a wholesaler might have encountered over the past quarter. Using the “Fund Flow Comparison” option in Quickflows, you can see that Invesco Corporate Bond R5 (ACCWX) has attracted the most net assets year-to-date. Conversely, a group of PIMCO funds saw the most outflows during the same period.

To successfully position your fund, it’s important to know the pros and cons of your competition in the same category. Use the ”Credit Quality Exposure” Quickflow to show that Calvert Income A (CFICX), for example, has the most significant exposure to non-rated bonds among its peers—an impactful talking point for advisors utilizing this fund in their portfolios.
Connect with YCharts
To learn more, schedule time to meet with an asset management specialist, call us at (773) 231-5986, or email hello@ycharts.com.
Want to add YCharts to your technology stack? Sign up for a 7-Day Free Trial to see YCharts for yourself.
Disclaimer
©2022 YCharts, Inc. All Rights Reserved. YCharts, Inc. (“YCharts”) is not registered with the U.S. Securities and Exchange Commission (or with the securities regulatory authority or body of any state or any other jurisdiction) as an investment adviser, broker-dealer, or in any other capacity, and does not purport to provide investment advice or make investment recommendations. This report has been generated through application of the analytical tools and data provided through ycharts.com and is intended solely to assist you or your investment or other adviser(s) in conducting investment research. You should not construe this report as an offer to buy or sell, as a solicitation of an offer to buy or sell, or as a recommendation to buy, sell, hold or trade, any security or other financial instrument. For further information regarding your use of this report, please go to: ycharts.com/about/disclosure
Next Article
The Current State of the Job MarketRead More →