The Current State of the Job Market
Unemployment in the US is around the lowest it’s been in over 50 years. Hiring activity is trending up, job growth continues to be strong, and despite certain areas of the economy such as the tech sector experiencing above-average rate of layoffs (Meta Platforms (META) recently announced additional layoffs), overall layoff and discharge rates remain at a relatively normal level.
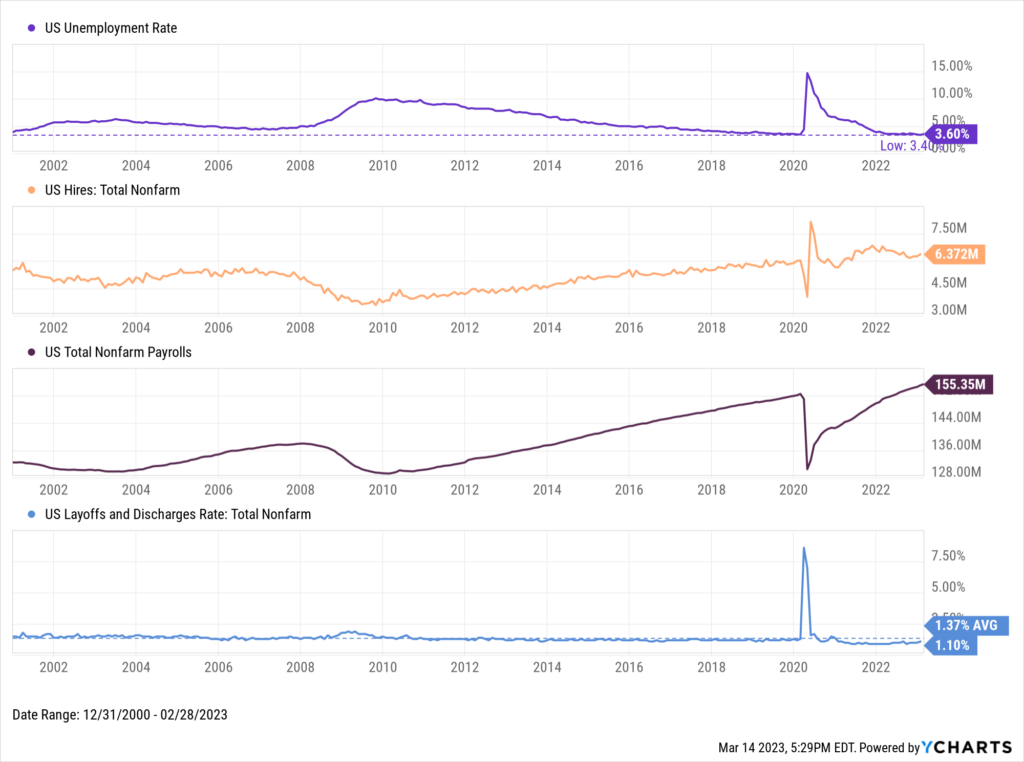
Download Visual | Modify in YCharts
So why has there been so much concern about a tight labor market? The number of Americans not in the labor force has climbed to nearly 100 million, despite a near-record amount of job openings coming available. The labor force participation rate is lower than pre COVID-19 levels as well.
It begs the question: does America really have a labor shortage? As each individual data point tells its own story, it’s worth piecing it all together to better understand the full picture of the US employment situation.
How Tight Is the Labor Market?
Comparing the Unemployment Rate and Labor Force Participation Rate
The Bureau of Labor Statistics defines the unemployment rate as “the number of unemployed people as a percentage of the labor force.” The labor force participation rate, however, is defined as the percentage of the “population 16 years and older that is working or actively looking for work.”
The US Unemployment Rate fell to 3.6% in February 2023. The last time unemployment fell as low was June 2019. Before that, December 1969. With a total labor force of 166.25 million people, that equates to around 5.9 million unemployed Americans.
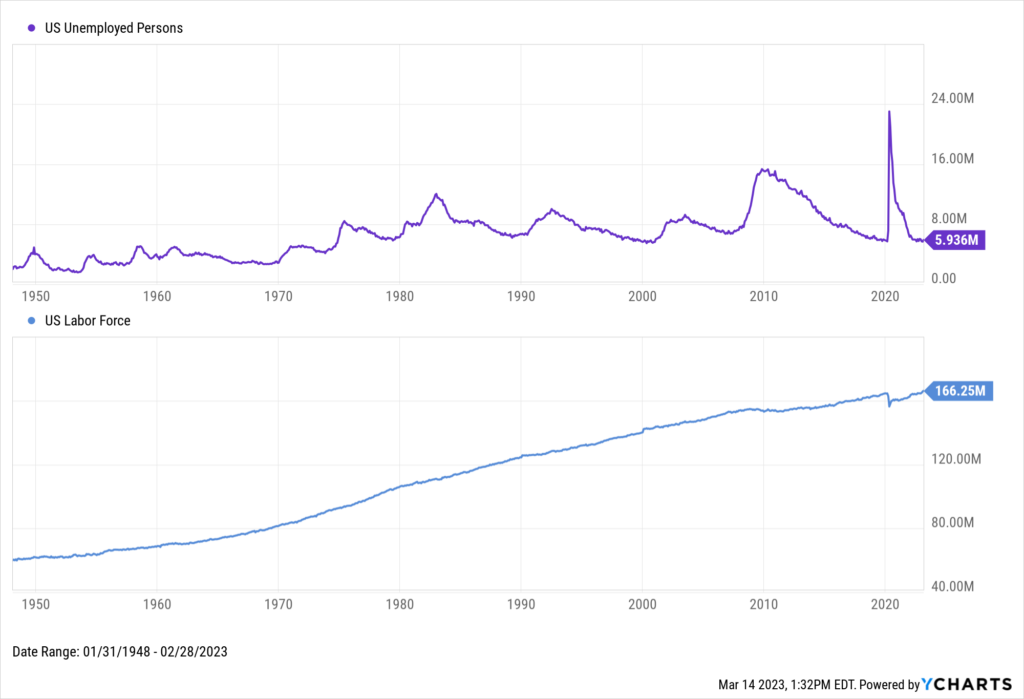
Download Visual | Modify in YCharts
Then there’s the US Labor Force Participation Rate, which is a full percentage point less than when COVID-19 first struck, and almost five percentage points below the all-time high back in March 2000. Though labor force participation is higher today than back in 1969, the steady decline over the last two decades means a smaller proportion of the population is working, or even picking up the classifieds section of the newspaper.
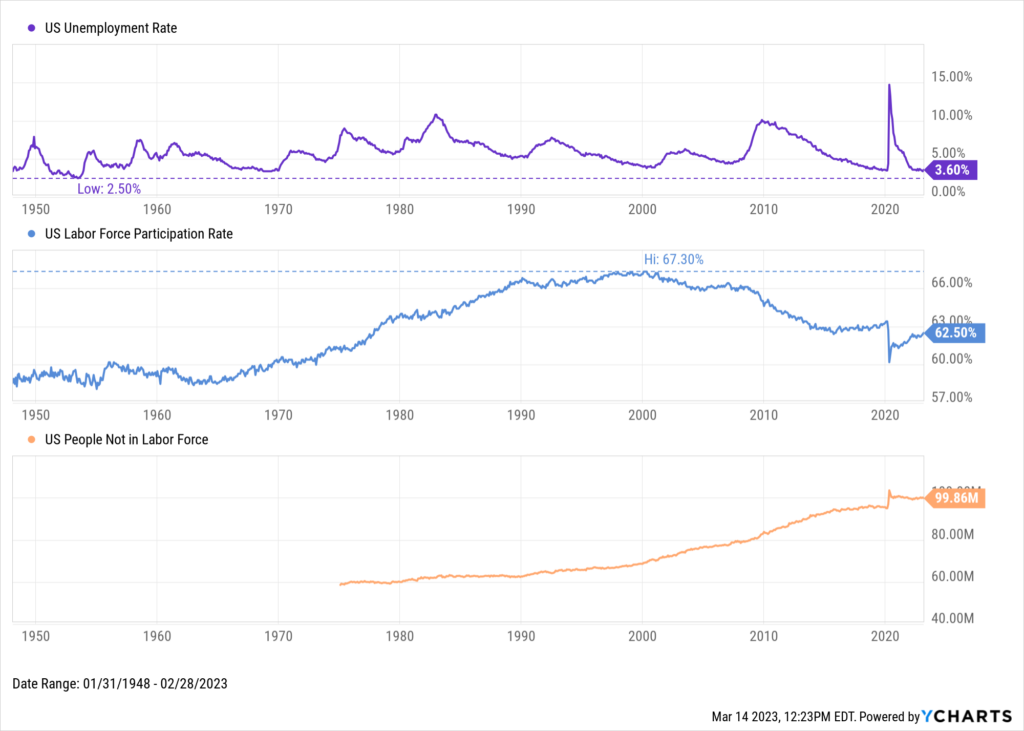
Download Visual | Modify in YCharts
A Record Number of Available Jobs
A tight labor market occurs when job openings are high but available workers are scarce. Today’s job market has a record number of vacancies despite lower labor force participation and a higher number of people not in the labor force. There are currently almost two job openings for every unemployed person.
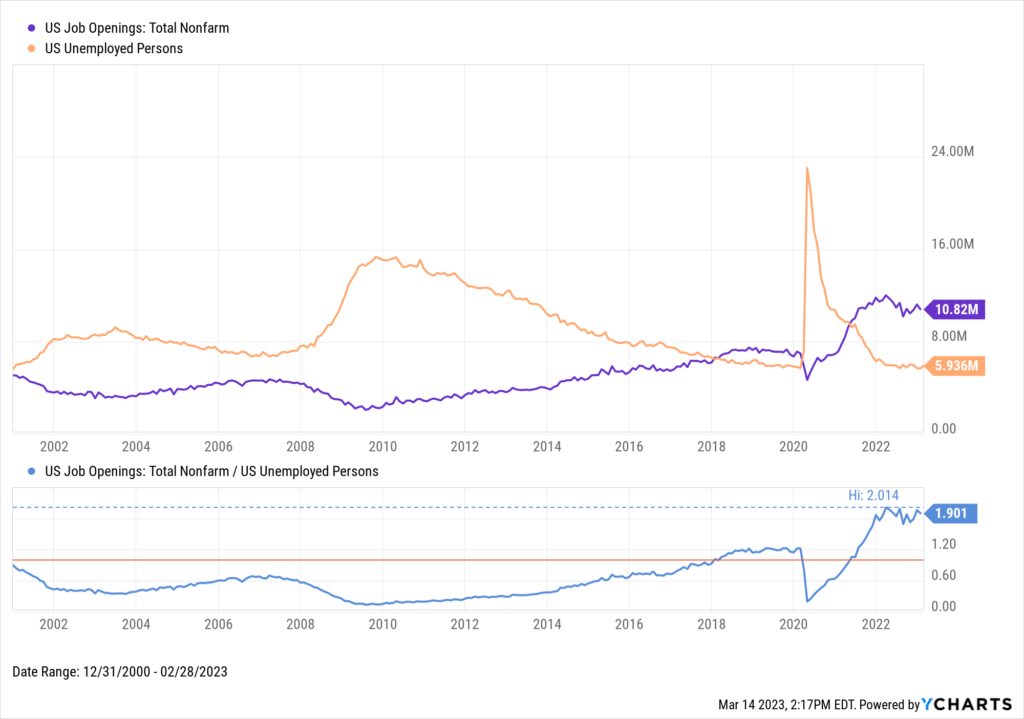
Download Visual | Modify in YCharts
The last time the job opening-to-unemployment ratio rose above 1 was in 2018. The labor market loosened significantly at the start of the pandemic, but rapidly tightened up again in the year following. Why might have the labor market gotten so tight, so fast?
Possible Reasons for a Tight Labor Market
Stalling Wage Growth
One effect of a tight labor market can be higher wages as employers compete to fill open roles. While the annualized rate of US Average Weekly Earnings has increased by 5.2% over the last three years, US Real Average Weekly Earnings reveals that inflation-adjusted pay is essentially unchanged over that time. Perhaps some of the working-age population is staying out of the job market due to lacking real wage growth, concluding that working a job might simply not be worth it?
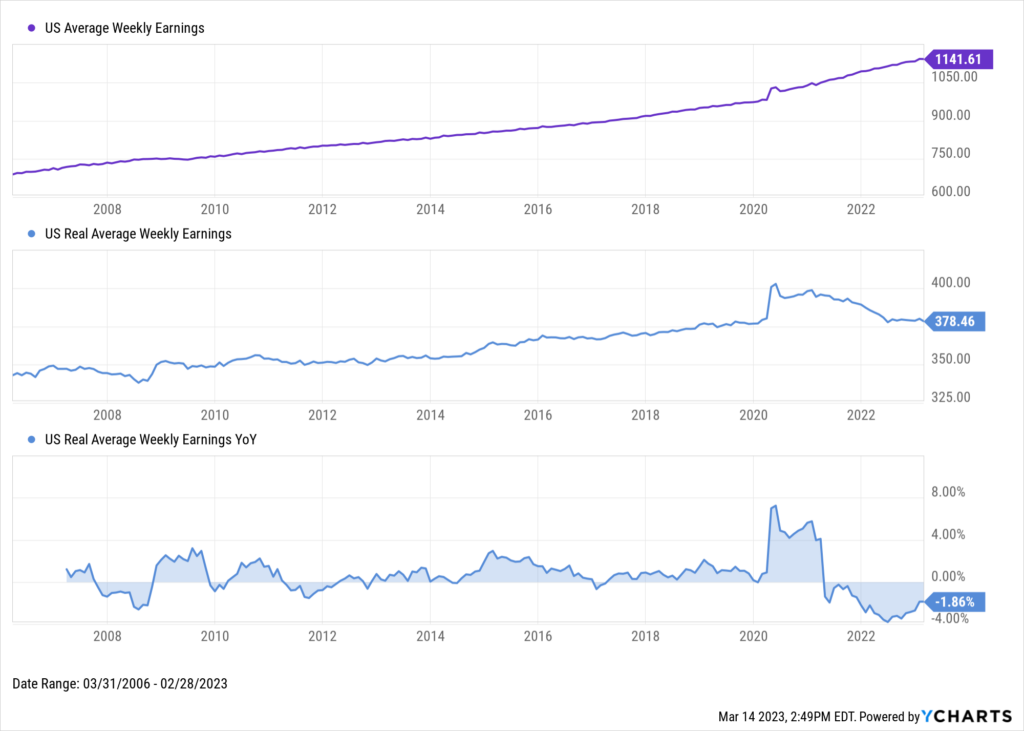
Download Visual | Modify in YCharts
New Business Starts
Monthly US Business Applications surged at the onset of COVID-19, reaching a peak of more than double its long-term average in July 2020. At the end of 2021, Josh Brown, co-founder and CEO of Ritholtz Wealth Management, joined YCharts to discuss the defining charts of that year, and observed “an explosion in people registering new companies.”
That explosion has persisted. New businesses are being created at a rate well above average seen before the pandemic. When comparing the increase in new business applications to the surge in US Quits, it’s quite possible many of these newly-minted proprietors were formerly employed—and are no longer looking for a job.
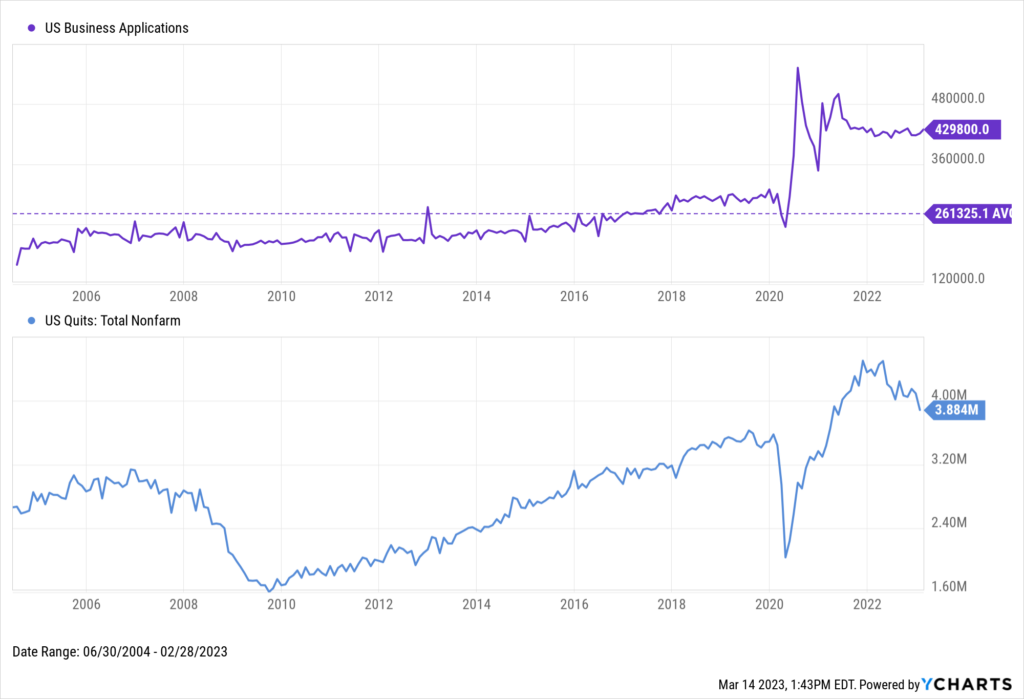
Download Visual | Modify in YCharts
More Retirements
Labor force participation has just about fully recovered across the 20 to 24 years-old, 25 to 34, 35 to 44, and 45 to 54 age groups. The one outlier is the “55 and Over” bracket, for which labor force participation has failed to recover since the start of the pandemic. In that time, perhaps a higher percentage of the older population has chosen to enter, or go back into, retirement.
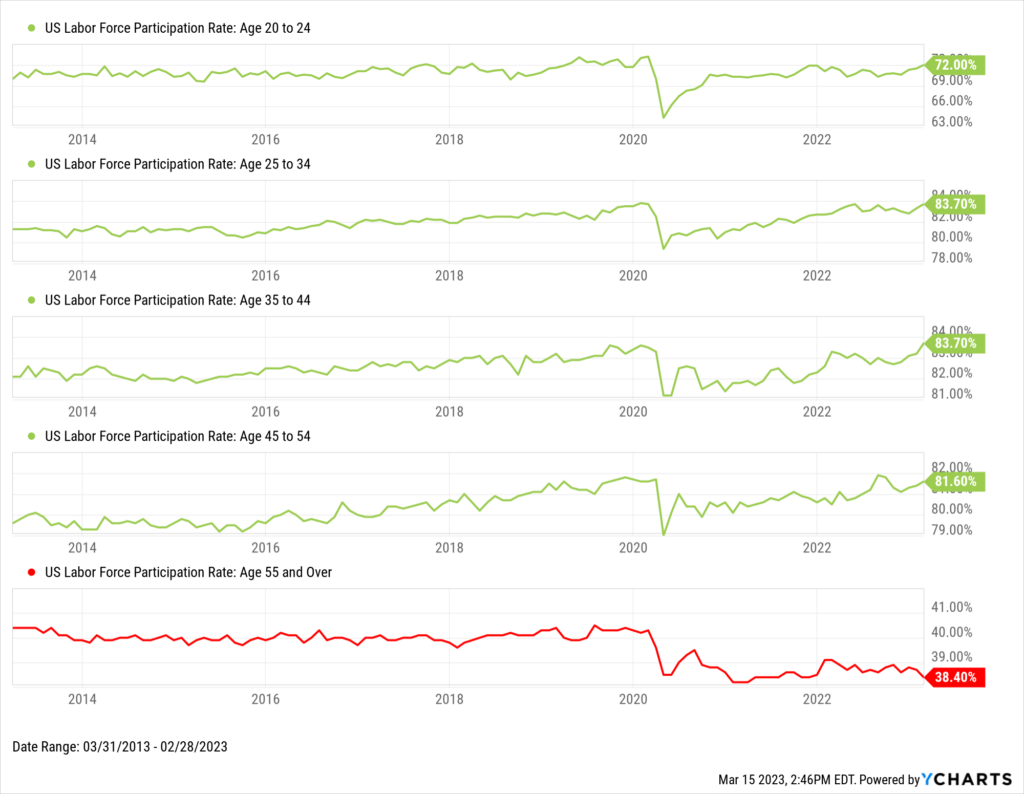
Download Visual | Modify in YCharts
The Bottom Line
The labor market has certainly gone through ups-and-downs in the last few years.
Despite low unemployment, it appears the US labor market is in a tightened state as the amount of available jobs greatly exceeds the number of unemployed persons. In addition to increasing new business applications, a higher quit rate, and more people exiting the labor force, the economy has also experienced a whopping 26 straight months of new jobs added, along with several key interest rate hikes by the Federal Reserve as it seeks to achieve the second part of its dual-mandate: maximum sustainable employment.
What do you think it will take to smooth out the employment situation?
Connect with YCharts
To get in touch, contact YCharts via email at hello@ycharts.com or by phone at (866) 965-7552
Interested in adding YCharts to your technology stack? Sign up for a 7-Day Free Trial.
Disclaimer
©2023 YCharts, Inc. All Rights Reserved. YCharts, Inc. (“YCharts”) is not registered with the U.S. Securities and Exchange Commission (or with the securities regulatory authority or body of any state or any other jurisdiction) as an investment adviser, broker-dealer, or in any other capacity, and does not purport to provide investment advice or make investment recommendations. This report has been generated through application of the analytical tools and data provided through ycharts.com and is intended solely to assist you or your investment or other adviser(s) in conducting investment research. You should not construe this report as an offer to buy or sell, as a solicitation of an offer to buy or sell, or as a recommendation to buy, sell, hold or trade, any security or other financial instrument. For further information regarding your use of this report, please go to: ycharts.com/about/disclosure
Next Article
How Wholesalers Can Increase Sales Before, During & After Advisor MeetingsRead More →