How Wholesalers Can Increase Sales Before, During & After Advisor Meetings
The role of a wholesaler has evolved with advisors no longer expecting a round of golf and a steak dinner. Instead, they want data-driven consultants who will bring value to their clients. To set yourself apart from the competition, you need to build a relationship with your prospects by first demonstrating that you are up-to-date on the newest trends and are someone they can go to whenever they need.
With intuitive, powerful tools and data coverage for more than 50,000 mutual funds and ETFs and over 10,000 SMAs, YCharts enables both internals and externals to develop strategies and expertly illustrate their funds’ value to advisor partners.
To demonstrate how the platform helps wholesalers, we’ve broken down ways distribution teams are using YCharts at every stage of their interactions with advisors.
Identify Prospects and Prepare for Advisor Meetings
Every asset manager knows that one of the most difficult parts of the job is getting some time with a prospect on the books. What if you could identify the exact moment they would need you?
Even before hopping on the phone or visiting an advisor’s office, internals and externals can set themselves up for success with some quick research in YCharts.
Continually monitor your funds and those of your competitors using fully customizable Dashboards and Watchlists. Prepare for advisor meetings by reviewing fund groupings based on categories, families, or brokerage availability and get acquainted with key stats like performance, expense ratio, assets under management, and asset flows for target funds.
Shown below, the sortable Data tab quickly compares similar large growth funds on expenses, flows, and performance. The American Funds Growth Fund of Amer A (AGTHX) had 1-year outflows of almost $5.7 billion, while the JPMorgan Large Cap Growth R6 (JLGMX) saw almost $8.8 billion of inflows.
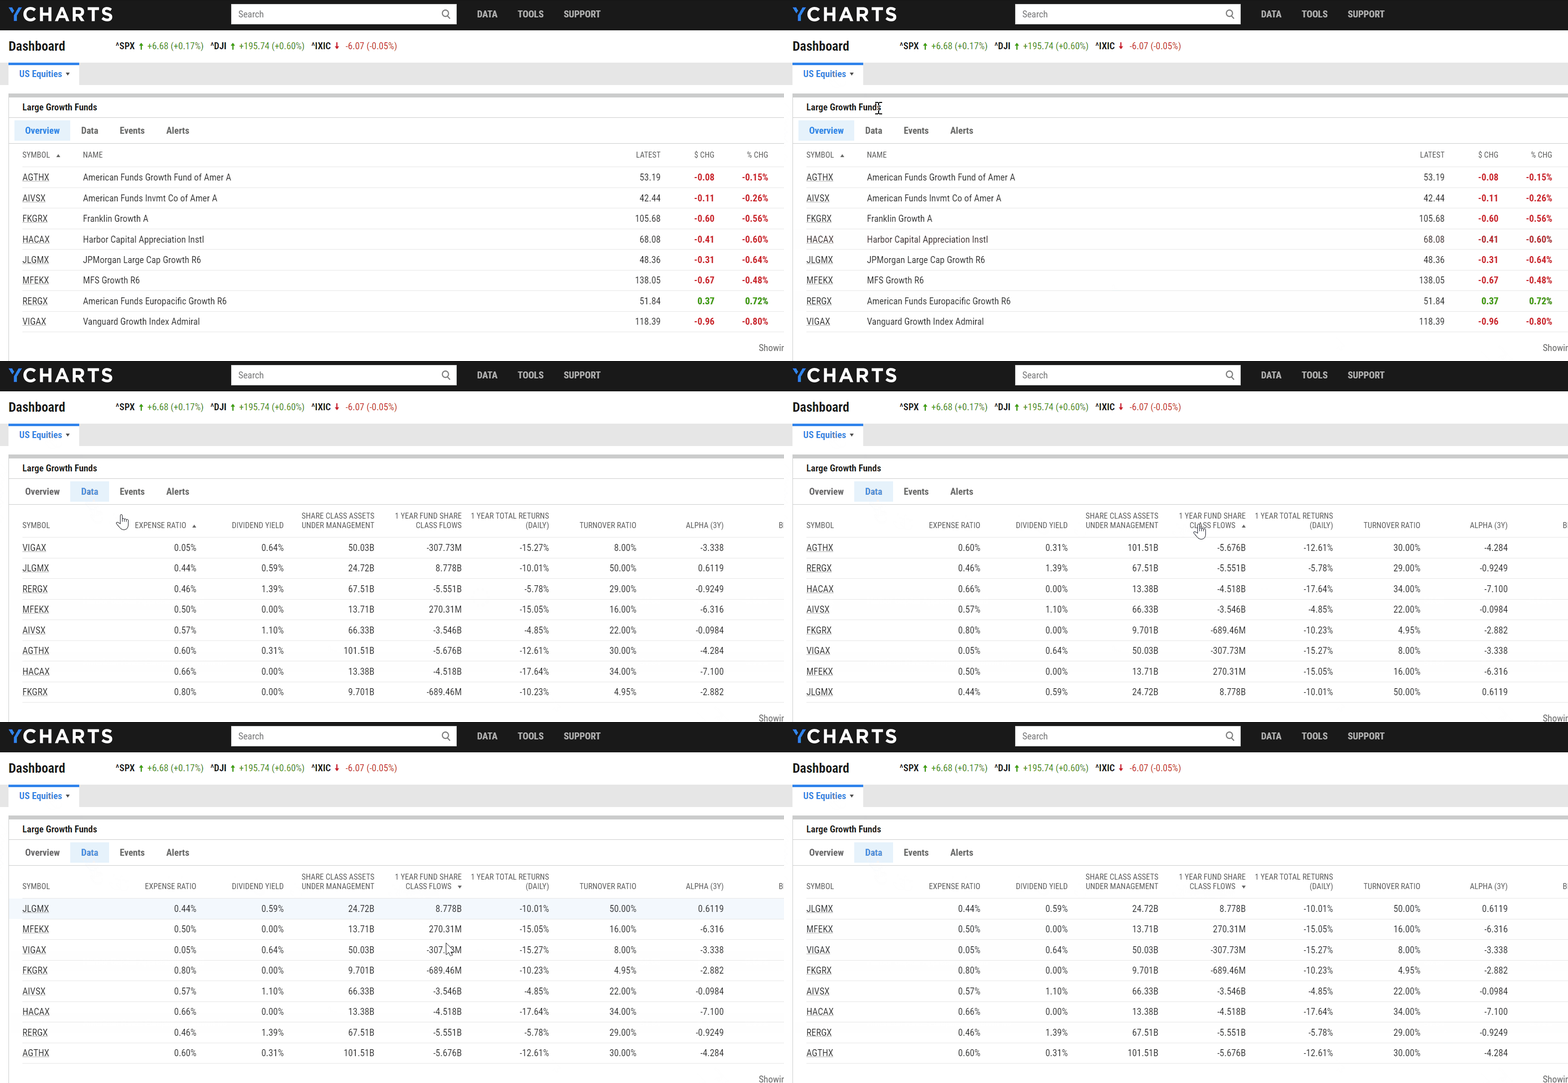
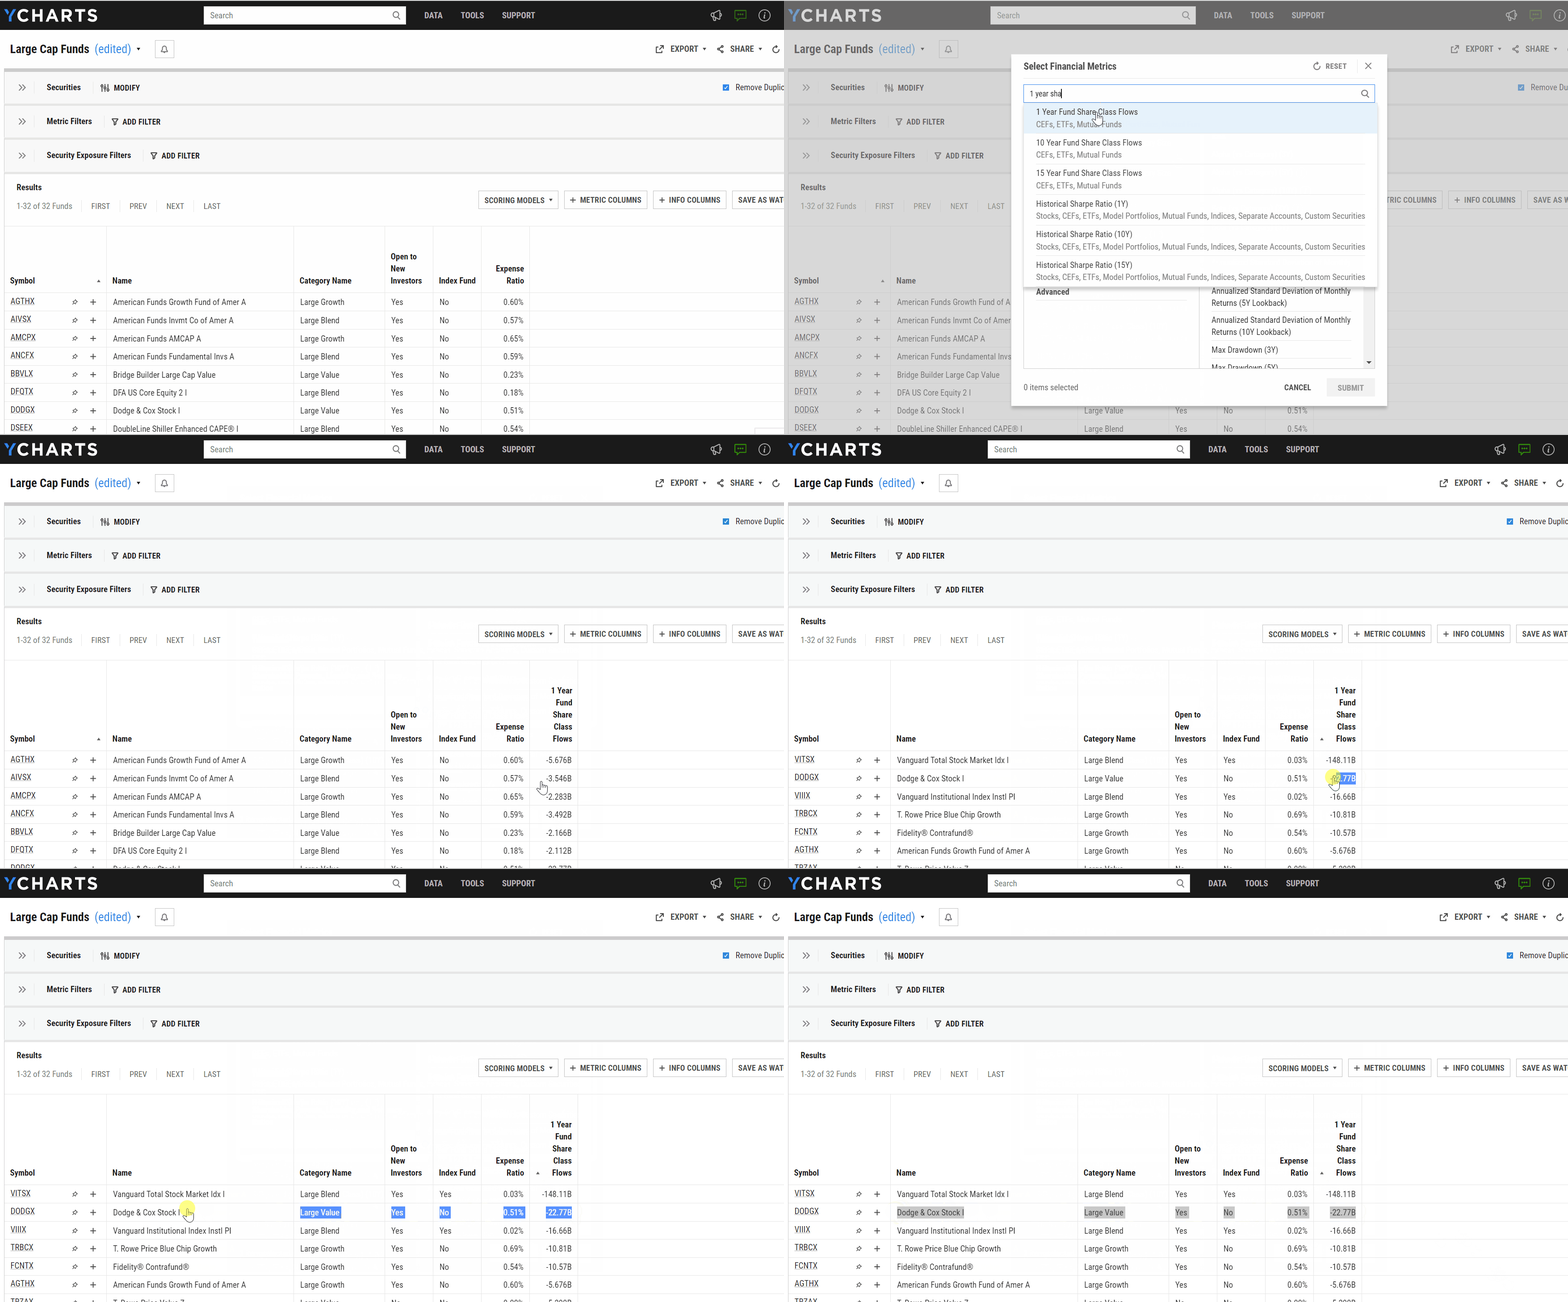
When a competitor’s fund is seeing large net outflows, it’s the perfect time to meet with advisors to position your own fund as an alternative. Use YCharts’ Fund Screener to identify funds that are losing assets by sorting 1-year fund flows from least to greatest.
The next step is to schedule time with prospects you know are using those funds and strike while the iron is hot.
Visualize Comparatives On the Fly
With YCharts, you won’t have to lug around binders of stale information. Instead, you’ll have the opportunity to tell a story and educate advisors on the benefits of choosing your fund over their current holdings.
When meeting with advisors, using data and visuals from a third-party site like YCharts helps establish trust. Instead of using static marketing materials, externals can utilize YCharts’ Fundamental Charts to perform fund comparisons that are both objective and dynamic.
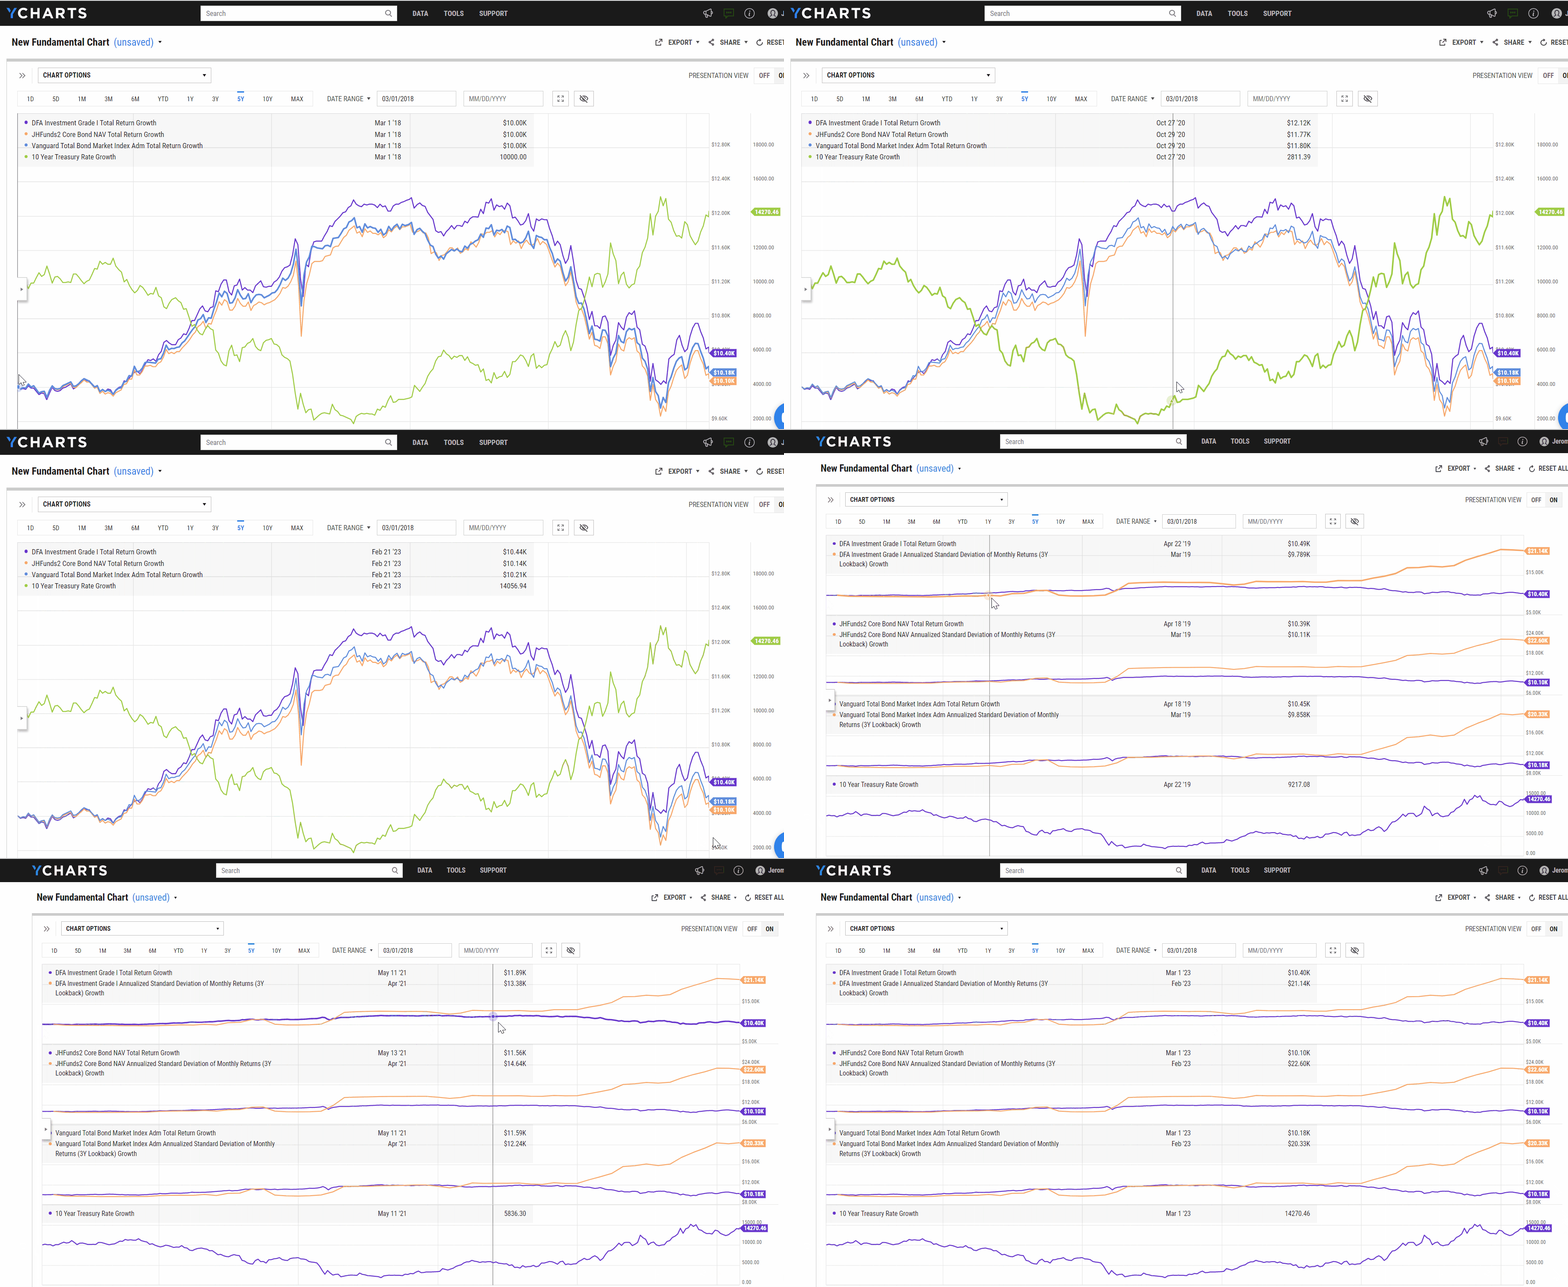
The example below shows how a few similar funds (DFAPX, JHCDX, and VBTLX) performed during a rising interest rate environment and includes the 10 Year Treasury Rate (in green) to explain the funds’ performance. Next, dig deeper by looking at each fund’s performance (purple) and its standard deviation (orange), or add other fund metrics you’d like to compare.
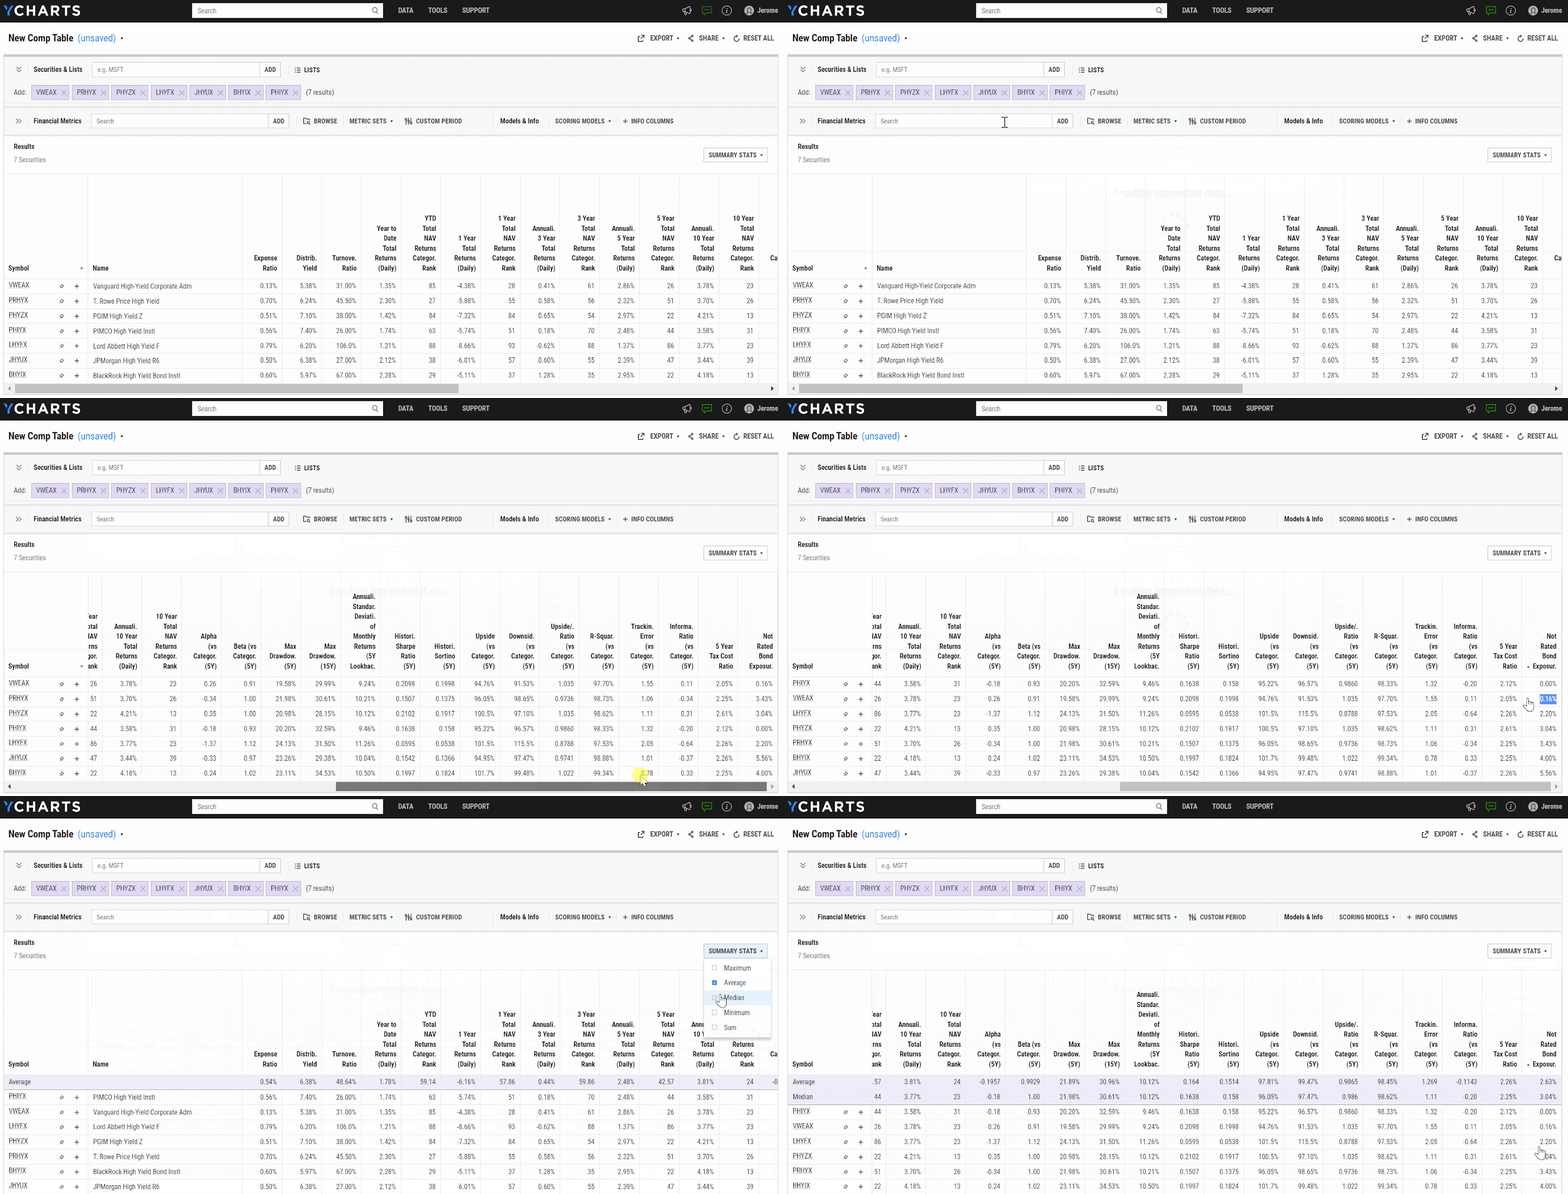
To paint a more data-oriented picture, wholesalers can use Comp Tables to curate a list of metrics for comparing their fund against its peers. Better yet, let the advisor do the “driving” by asking what metrics are important to them, then add those to the comparison table too.
This level of customization enhances conversations with advisors by letting distribution teams control the narrative. It also enables a free flow of information and the ability to react on-the-fly based on the prospect’s interests.
Below is a Comp Table view of several high yield bond funds, their asset allocations, and credit quality exposures. Comparing and contrasting the data, side-by-side, for each fund allows wholesalers to highlight significant differences between their funds and others, such as how the Vanguard High-Yield Corporate Fund (VWEAX) below has a 0.16% exposure to non-rated bonds, and the peer group’s average is 2.63%.
Maintain Momentum with Post-Meeting Communications
You’ve done the hard part by securing a meeting with an advisor and impressed them with your fund offerings, so let’s bring it home and keep the conversation going. You want to show them that you will continue to provide them value even after a meeting.
Immediately after leaving a prospect’s office, externals can take the insights they’ve gained and put them to good use in YCharts.
Externals and internals can work together to replicate the prospect’s current fund utilization in YCharts’ Model Portfolios, then compare it to their own fund family. This is a quick and easy way to follow up, continuing the conversation beyond the face-to-face meeting. Here are the holdings for an example portfolio in YCharts:
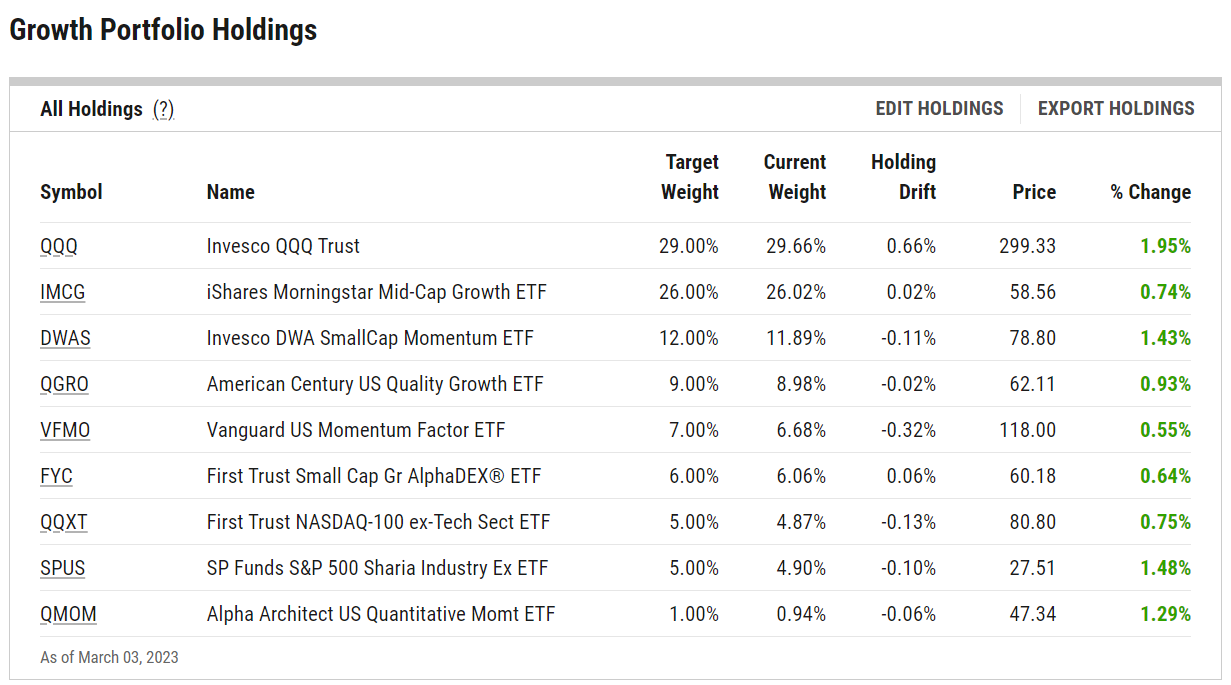
In this example, assume you identified the First Trust Small Cap Gr AlphaDEX ETF (FYC) as an opportunity for replacement. Rotate FYC out, and replace it with the AdvisorShares Dorsey Wright Micro-Cp ETF (DWMC).
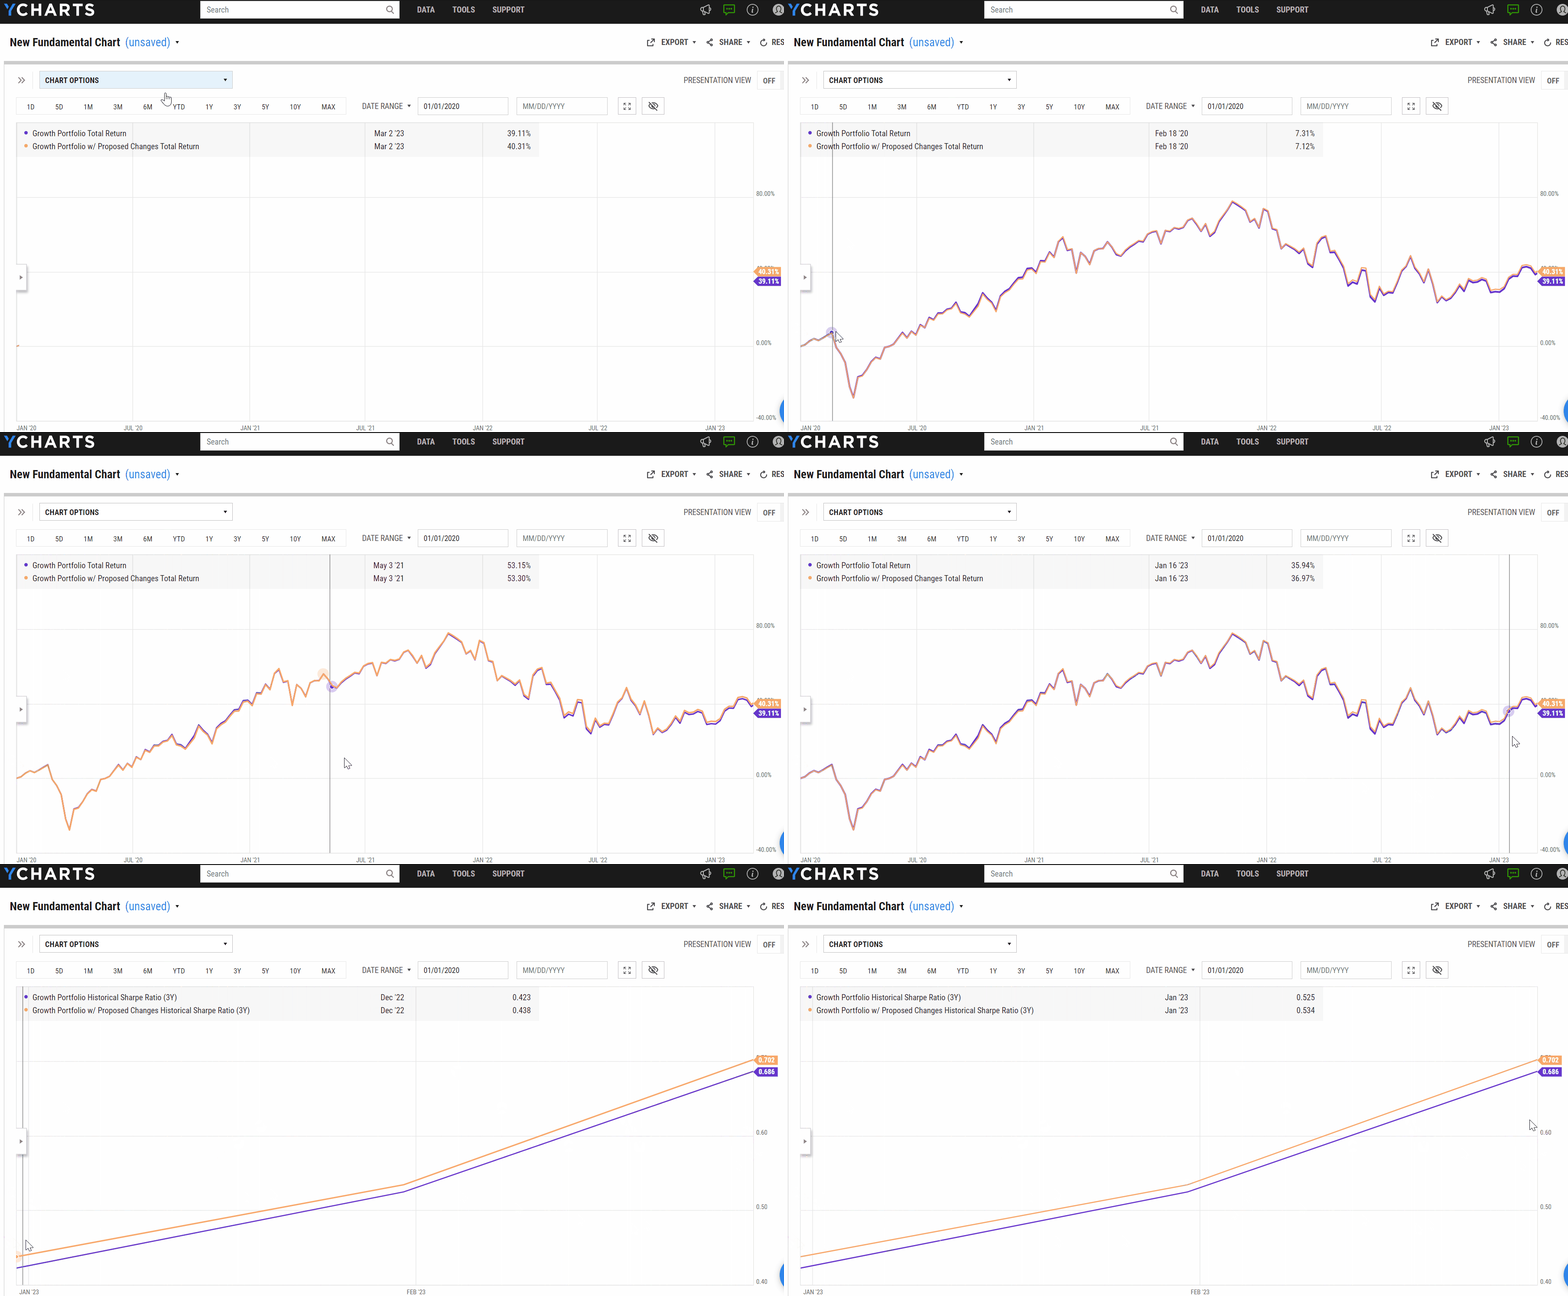
Next, as shown below, the advisor’s current portfolio (purple) and the version with DWMC replacing FYC, called Growth Portfolio w/Proposed Changes (orange), are shown. This replacement exercise added more than a point of total return and improved the portfolio’s Sharpe Ratio.
Understand the Current Investment Landscape
Stay up-to-date on market trends that are impacting funds. The best way to be a valuable asset to any advisor is demonstrating that you are informed and a consistent source of knowledge.
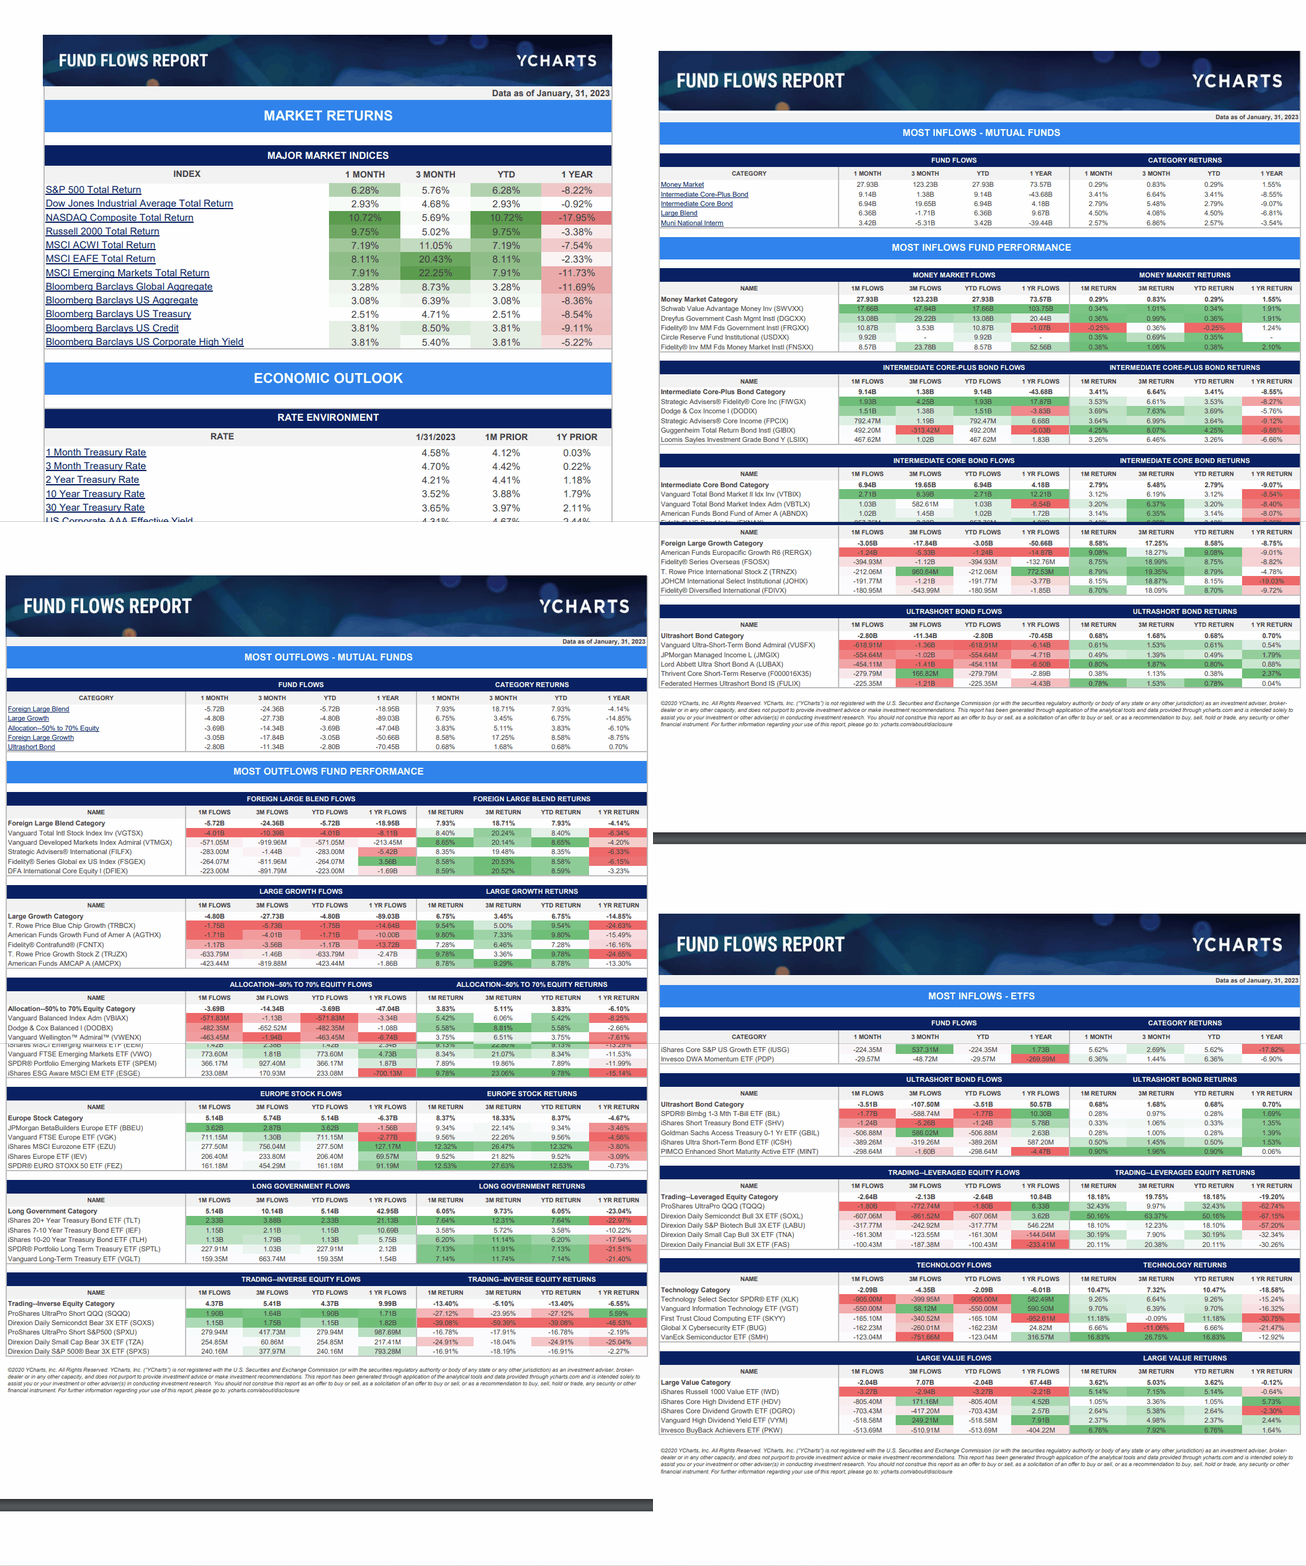
Distributed monthly, the YCharts Fund Flows Report breaks down which fund categories have seen the biggest inflows and outflows over the last month and other historical periods. The report also breaks down which individual mutual funds and ETFs within those categories attracted or lost the most assets.
The report not only provides a holistic understanding of market trends, but also more detailed metrics related to fund categories and individual funds, broad market returns, and an economic outlook.
Click to subscribe to the Fund Flows Report
The features and functionalities described here only scratch the surface of how YCharts helps wholesalers stay informed of the market, prepare for meetings efficiently, educate their prospects, and continue the conversation with their prospects effectively. Connect with us to learn more.
Connect with YCharts
To learn more, schedule time to meet with an asset management specialist, call us at (773) 231-5986, or email hello@ycharts.com.
Want to add YCharts to your technology stack? Sign up for a 7-Day Free Trial to see YCharts for yourself.
Disclaimer
©2023 YCharts, Inc. All Rights Reserved. YCharts, Inc. (“YCharts”) is not registered with the U.S. Securities and Exchange Commission (or with the securities regulatory authority or body of any state or any other jurisdiction) as an investment adviser, broker-dealer, or in any other capacity, and does not purport to provide investment advice or make investment recommendations. This report has been generated through application of the analytical tools and data provided through ycharts.com and is intended solely to assist you or your investment or other adviser(s) in conducting investment research. You should not construe this report as an offer to buy or sell, as a solicitation of an offer to buy or sell, or as a recommendation to buy, sell, hold or trade, any security or other financial instrument. For further information regarding your use of this report, please go to: ycharts.com/about/disclosure
Next Article
Can the S&P 500’s CAPE Ratio Predict a Market Crash?Read More →
