Embracing Market Turmoil: Staying Invested vs. Exiting During Financial Crises
The 2008 financial crisis and the 2020 pandemic were like roller coaster rides that nobody wanted a ticket for. Financial advisors faced the Herculean task of soothing their clients’ frayed nerves as they watched their balances dip into the red.
Overwhelmed with emotion, some of these clients likely considered jumping ship during these tumultuous times. However, abandoning the ride could have caused even more damage to their portfolios in the long run.
In our free Top 10 Visuals for Clients & Prospects deck, we bring to life key concepts that frequently pop up in many client and prospect conversations, including the power of staying invested through the lowest of downturns.
Download the free Slide Deck for more insights:The Perils of Market Timing in the 2008 Financial Crisis
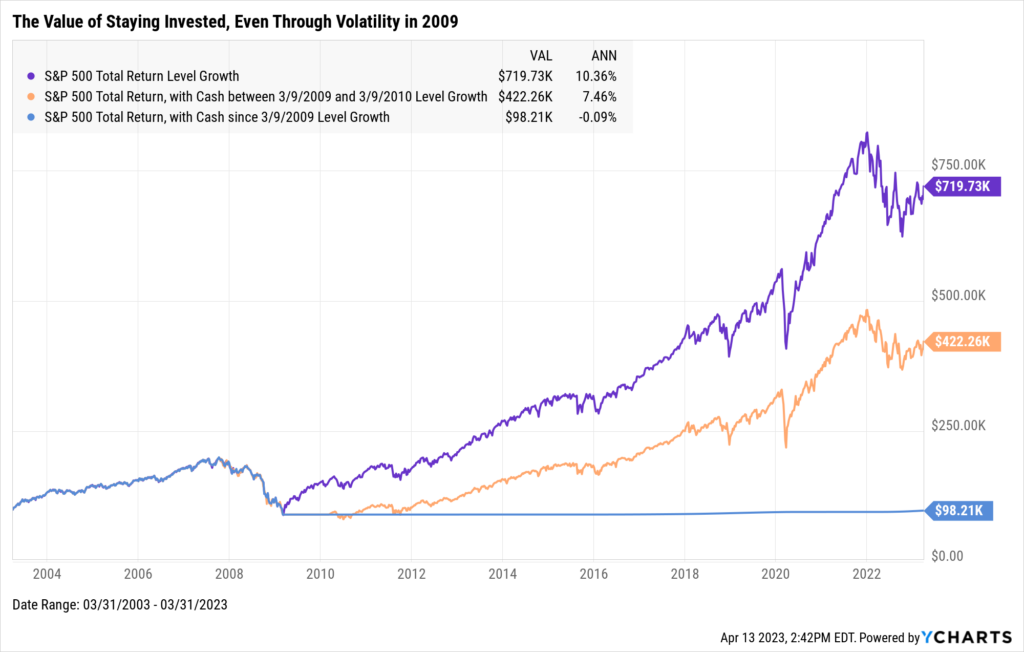
Navigating a market downturn can feel like trying to catch a falling knife, and pinpointing the bottom is no easy feat. But, even if you could, re-entering the market could leave a lasting scar on your long-term returns.
Picture, for example, an all-stock (S&P 500) portfolio spanning 20 years (from Q2 2003 to Q1 2023). If you cashed out at the nadir of the 2008 Financial Crisis and jumped back a year later, you’d be looking at a 7.4% annualized return. Not too shabby. But if you’d just hung in there throughout the turmoil, a buy-and-hold strategy would have resulted in nearly three extra percentage points (2.9%) of return per year for an annualized return of 10.36%.
Now imagine you bailed at the bottom of the ’08 crisis but never plunged back into the market. That’s when you’d really feel the sting, with a dismal -0.9% annualized return gnawing away at your portfolio.
Download: The Top 10 Visuals for Clients and Prospects
How Staying Invested Prevailed Over Market Timing During the Pandemic
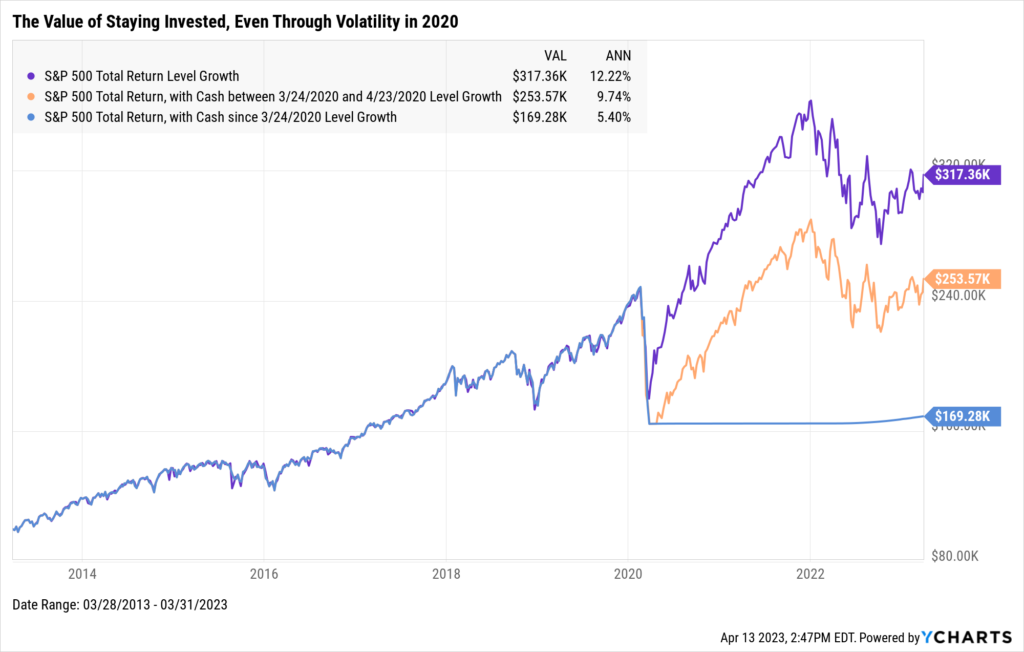
A more recent example is what would’ve happened if you went in and out of the market in 2020. Let’s take that same $100,000 investment, using ten years from Q2 2013 to Q1 2023. If you hopped out of the market for one month at the 2020 pandemic crash’s depths, you’d be looking at a 9.74% annualized return.
Again, a fine result, but missing just that one single month in the market meant leaving 2.48% on the table every year compared to the buy-and-hold strategy, which would have netted you a 12.22% annualized return. Those who decided to park their cash at the bottom for good forewent a staggering 6.82% in annualized returns. Talk about FOMO.
Download: The Top 10 Visuals for Clients and Prospects
Download the free Slide Deck for more insights:Connect with YCharts
To get in touch, contact YCharts via email at hello@ycharts.com or by phone at (866) 965-7552
Interested in adding YCharts to your technology stack? Sign up for a 7-Day Free Trial.
Disclaimer
©2023 YCharts, Inc. All Rights Reserved. YCharts, Inc. (“YCharts”) is not registered with the U.S. Securities and Exchange Commission (or with the securities regulatory authority or body of any state or any other jurisdiction) as an investment adviser, broker-dealer, or in any other capacity, and does not purport to provide investment advice or make investment recommendations. This report has been generated through application of the analytical tools and data provided through ycharts.com and is intended solely to assist you or your investment or other adviser(s) in conducting investment research. You should not construe this report as an offer to buy or sell, as a solicitation of an offer to buy or sell, or as a recommendation to buy, sell, hold or trade, any security or other financial instrument. For further information regarding your use of this report, please go to: ycharts.com/about/disclosure
Next Article
How Does Manager Tenure Impact Fund Performance?Read More →