How Does Manager Tenure Impact Fund Performance?
Alpha, beta, historical returns, historical standard deviation, discount or premium to NAV…there are hundreds upon hundreds of quantitative and qualitative metrics that can be leveraged in the fund selection process.
But what about the managers who are behind the funds? Does fund manager tenure play a role in delivering better returns in bull markets or minimizing drawdowns amidst volatility?
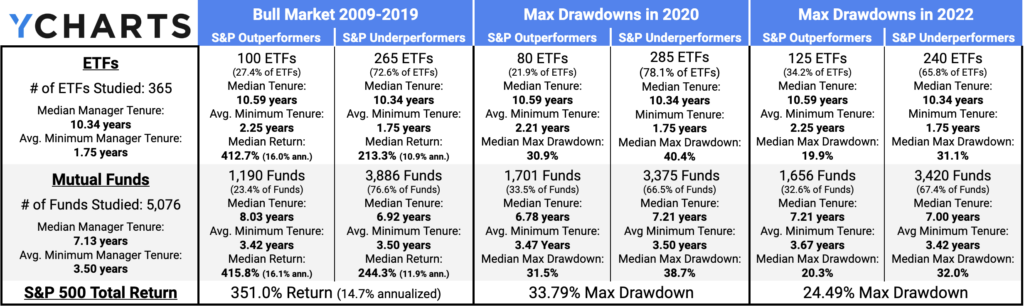
Using the YCharts Fund Screener, we identified US-Domiciled Equity funds with a minimum of 15 years since fund inception. This criteria narrowed our universe of 77,000 funds down to 365 equity ETFs and 5,076 equity Mutual Funds.
Using the S&P 500 Total Return as a benchmark, we examined how many of these funds outperformed the index in a bull market environment (2009-2019) as well as minimized drawdowns during periods of volatility (2020, 2022). We also incorporated manager tenure metrics to see if higher or lower median tenure was a trait among outperforming or underperforming funds. Below are the findings.
Which Funds Performed the Best in a Bull Market Environment?
The S&P 500 delivered a 14.7% annualized total return between 2009 and 2019. Of the 365 ETFs studied, 27.4% (100 ETFs) posted a better return than the S&P 500 between 2009 and 2019. Out of the 5,076 mutual funds, 23.4% (1,190 funds) outperformed the S&P 500 index over that same time frame.
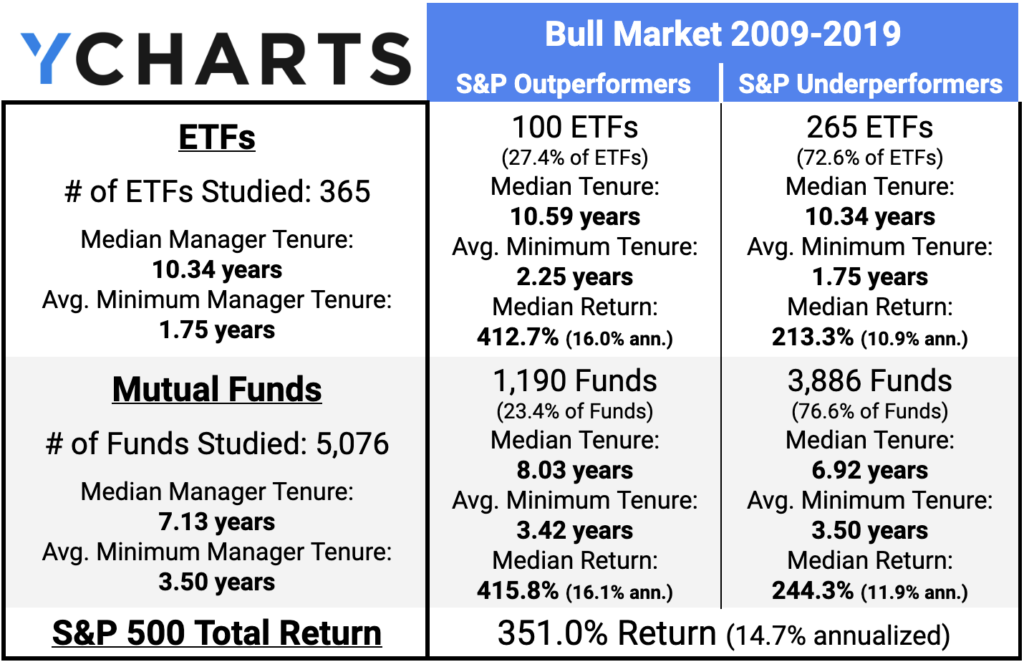
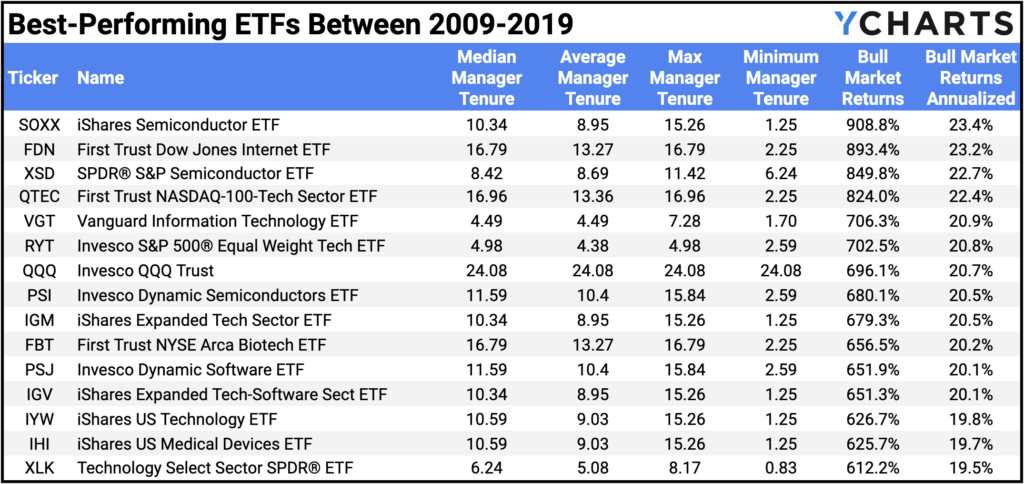
The median manager tenure among outperforming ETFs was 0.25 years longer than the overall median of studied ETFs (10.59 years vs. 10.34 median). Below are the 15 ETFs that outperformed the S&P 500 the most between 2009-2019:
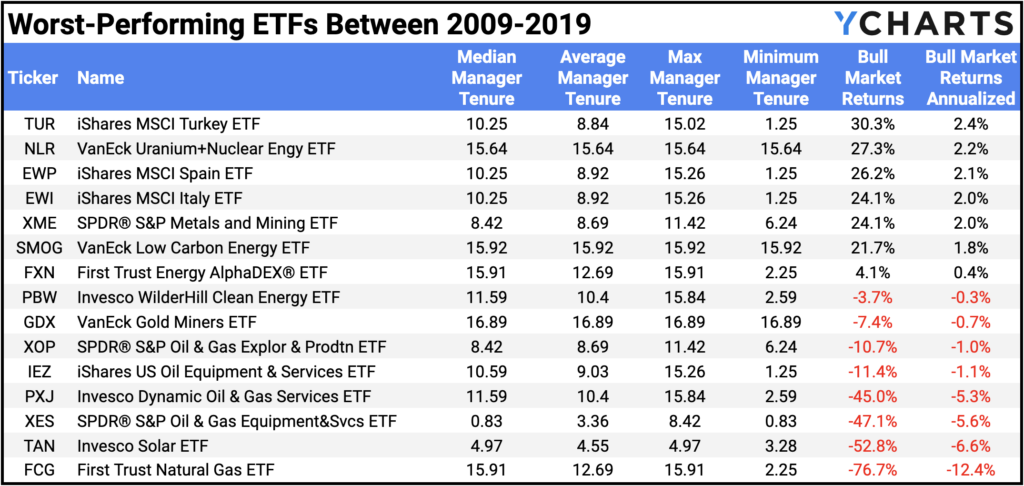
Below are the 15 worst-performing ETFs between 2009-2019:
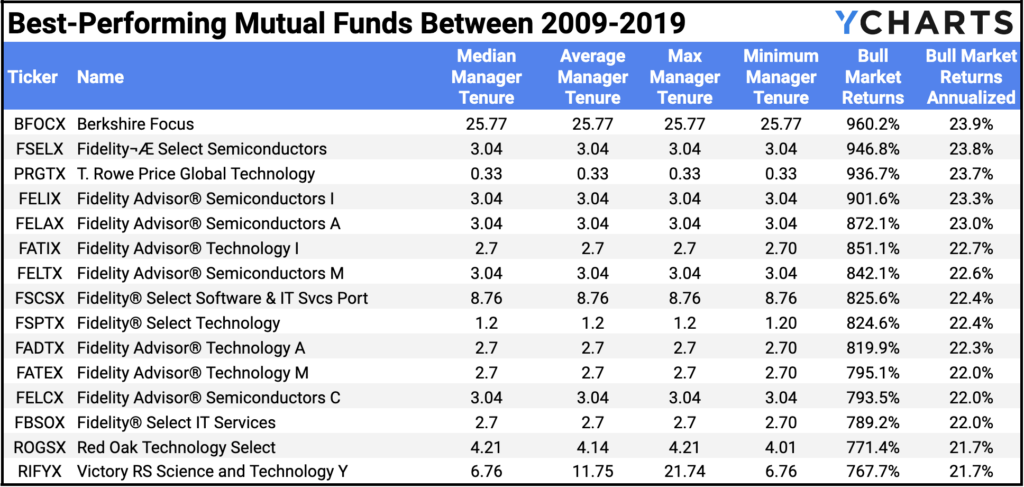
The median manager tenure among outperforming mutual funds was 0.9 years longer than the overall median of studied mutual funds (8.03 years vs. 7.13 median). Below are the 15 mutual funds that outperformed the S&P 500 the most between 2009-2019:
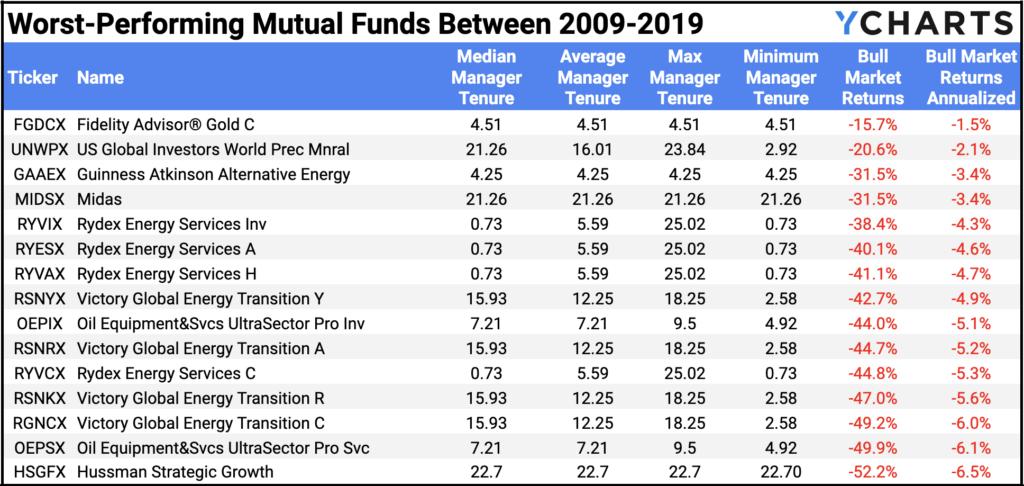
Below are the 15 worst-performing mutual funds between 2009-2019:
Which Funds Provided the Best Downside Protection in 2020?
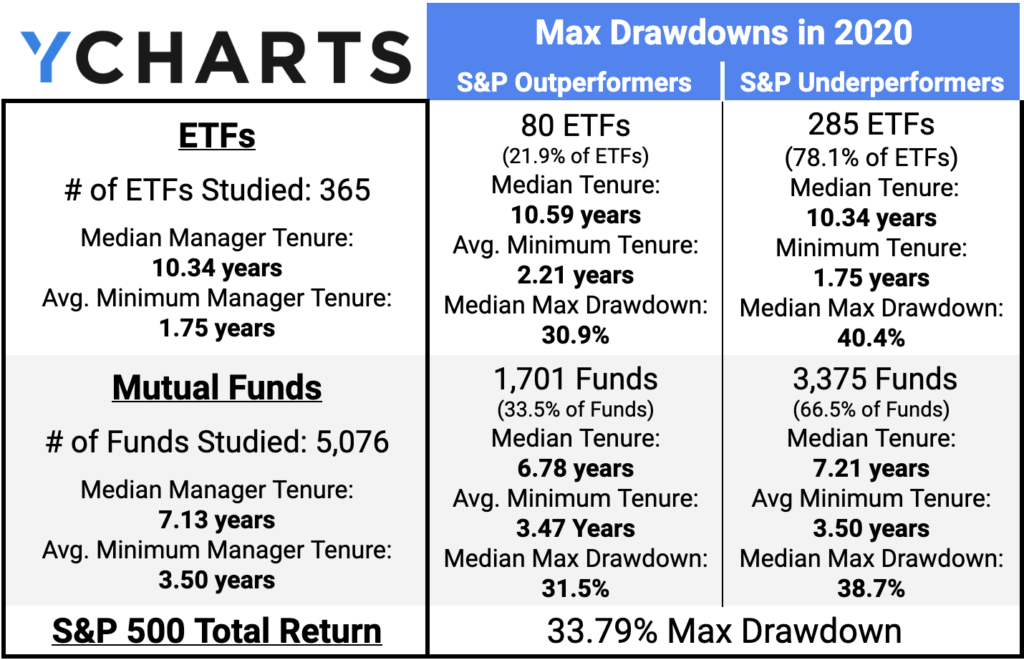
The S&P 500’s max drawdown in 2020 was 33.8%. Of the 365 ETFs studied, 21.9% (80 ETFs) recorded a smaller max drawdown than the S&P 500 in 2020. Out of the 5,076 mutual funds, 33.5% (1,701 mutual funds) logged a less severe max drawdown than the S&P 500.
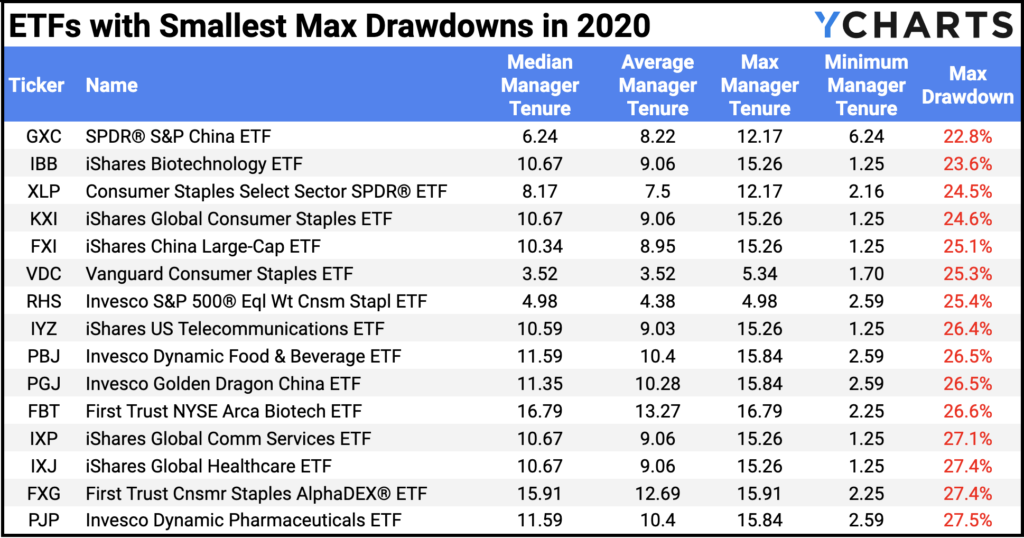
The median manager tenure among ETFs with a lesser max drawdown was 0.25 years longer than the overall median of studied ETFs (10.59 years vs. 10.34 median). Below are the 15 ETFs that bested the S&P 500 in terms of max drawdown in 2020:
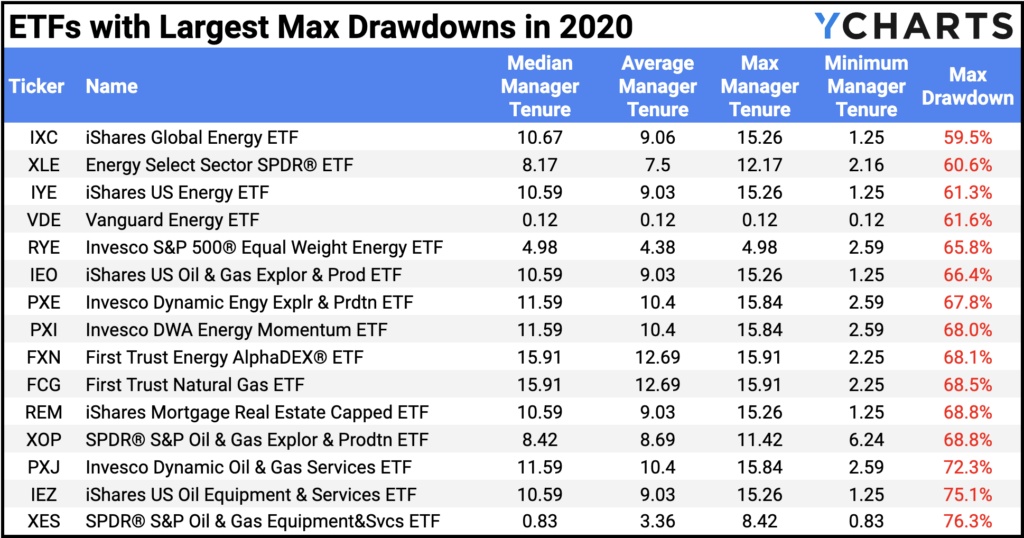
Below are the 15 ETFs with the largest max drawdowns in 2020:
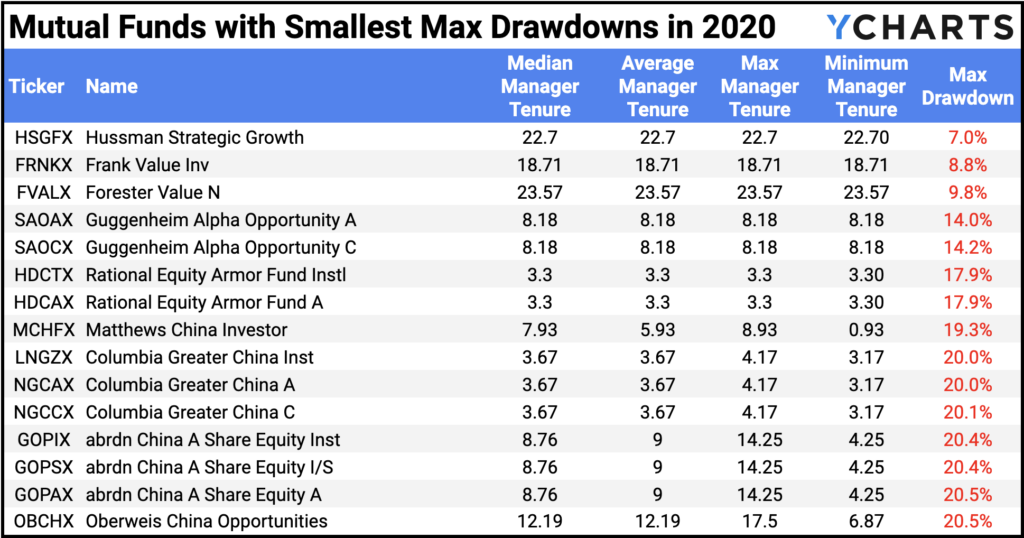
The median manager tenure among mutual funds with a lesser max drawdown was 0.35 years shorter than the overall median of studied mutual funds (6.78 years vs. 7.13 median). Below are the 15 mutual funds that bested the S&P 500 in terms of max drawdown in 2020:
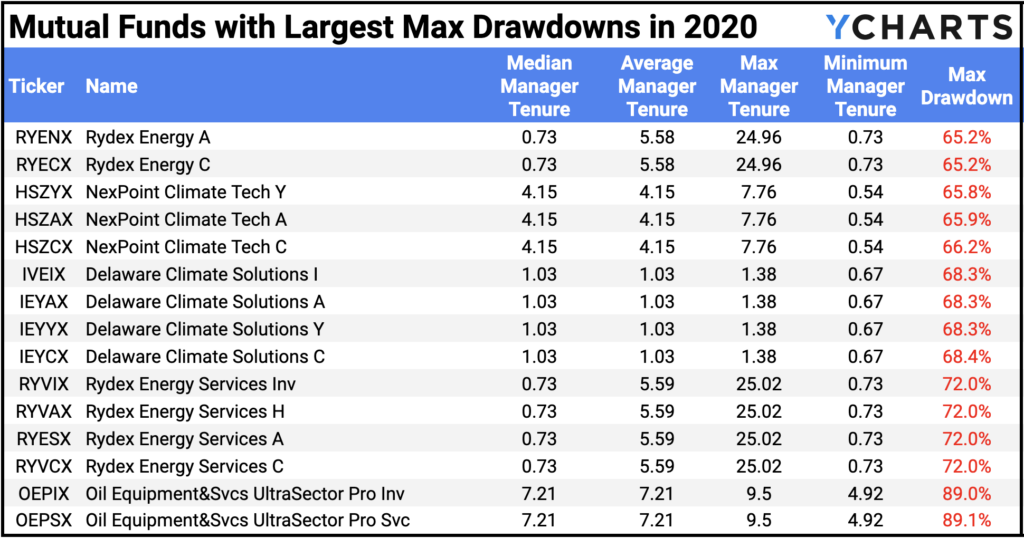
Below are the 15 worst-performing mutual funds between 2009-2019:
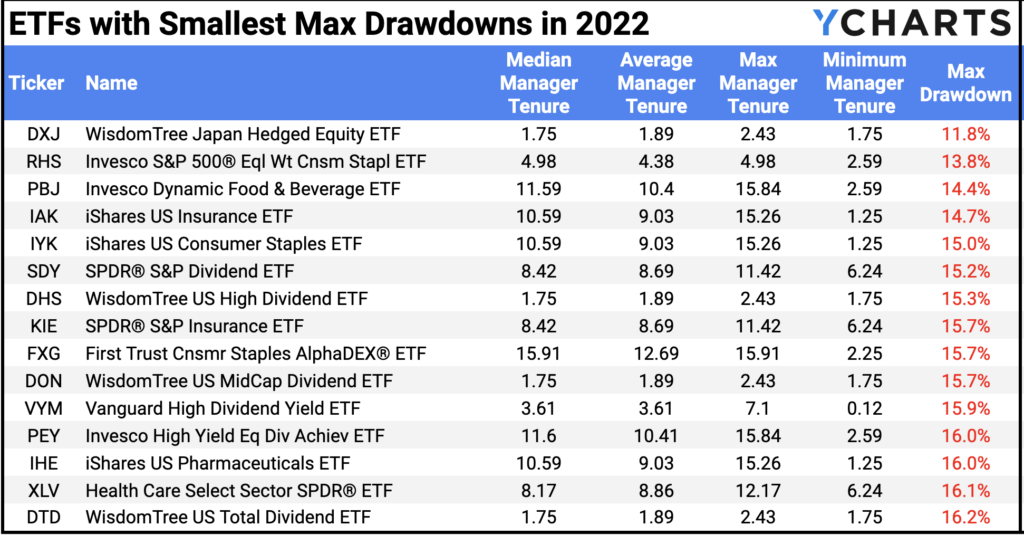
Which Funds Provided the Best Downside Protection in 2022?
The S&P 500’s max drawdown in 2022 was 24.5%. Of the 365 ETFs studied, 34.2% (125 ETFs) recorded a smaller max drawdown than the S&P 500 in 2022. Out of the 5,076 mutual funds, 32.6% (1,656 mutual funds) logged a less severe max drawdown than the S&P 500.
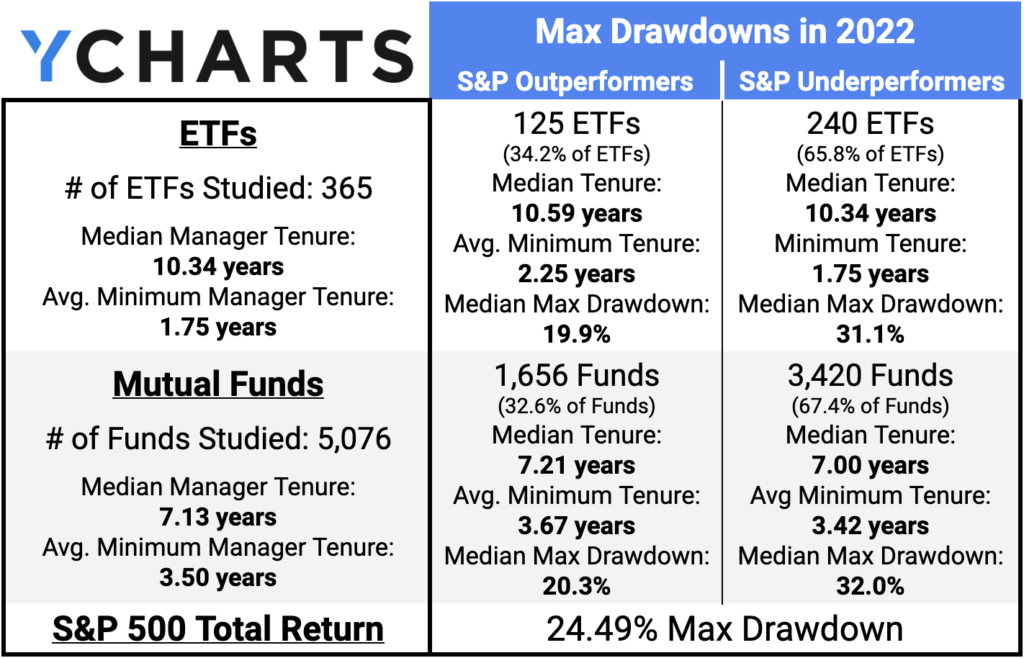
The median manager tenure among ETFs with a lesser max drawdown was 0.25 years longer than the overall median of studied ETFs (10.59 years vs. 10.34 median). Below are the 15 ETFs that bested the S&P 500 in terms of max drawdown in 2022:
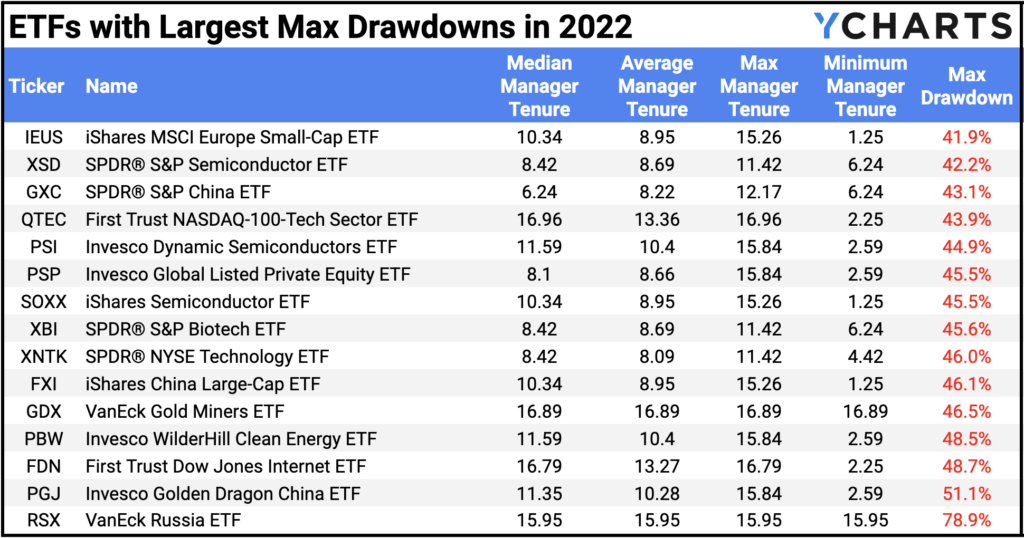
Below are the 15 ETFs with the largest max drawdowns in 2022:
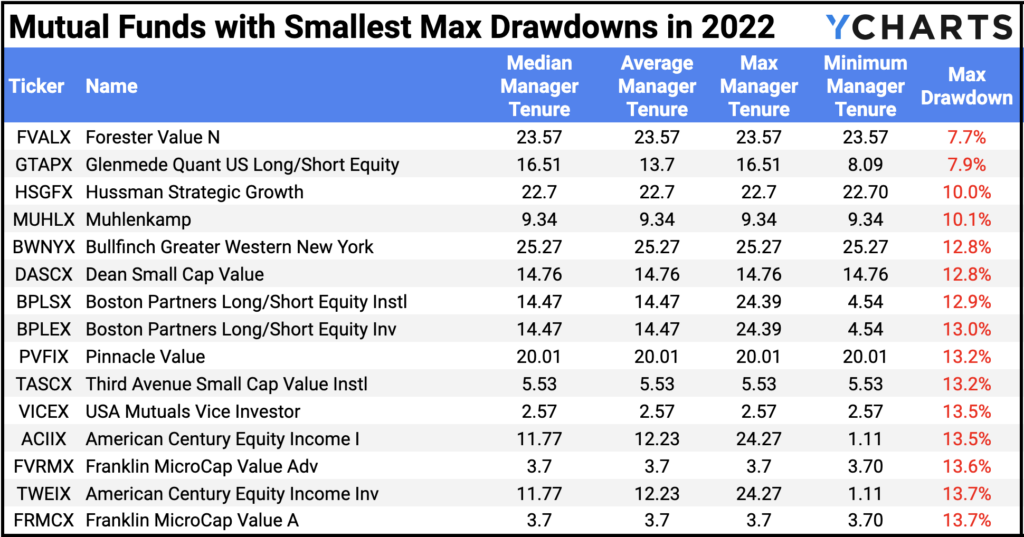
The median manager tenure among mutual funds with a lesser max drawdown was 0.08 years longer than the overall median of studied mutual funds (7.21 years vs. 7.13 median). Below are the 15 mutual funds that bested the S&P 500 in terms of max drawdown in 2022:
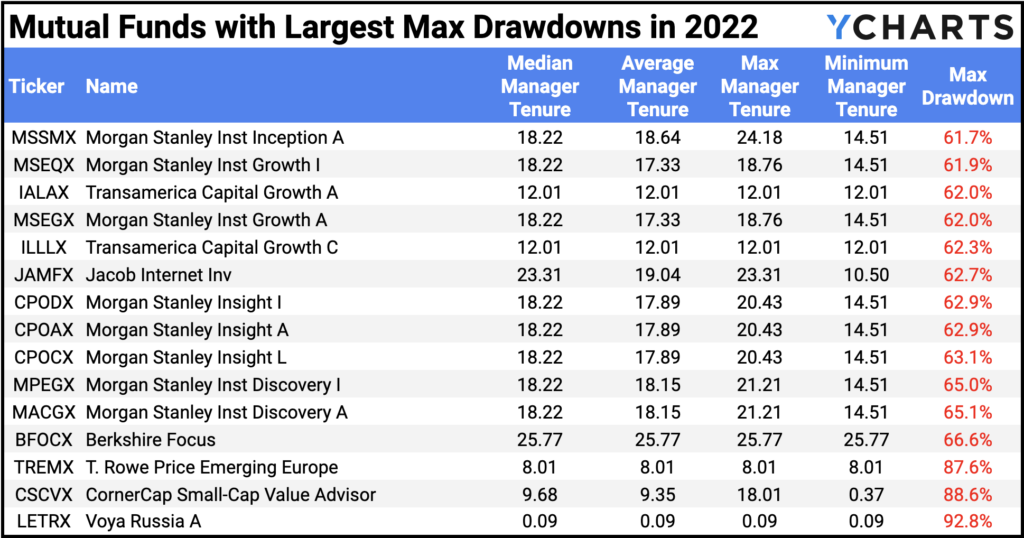
Below are the 15 mutual funds with the largest max drawdowns in 2022:
Does Fund Manager Tenure Make a Difference?
Overall, median manager tenure was slightly longer among ETFs and Mutual Funds that outperformed the S&P 500 between 2009-2019 and had a lower max drawdown than the index in 2020 and 2022. Underperforming mutual funds between 2009-2019 and 2022 were found to have a shorter median manager tenure.
It seems factoring manager experience in the fund selection process doesn’t hurt, especially as fewer funds were able to outperform the S&P in terms of bull market returns and minimizing drawdowns.
Connect with YCharts
To get in touch, contact YCharts via email at hello@ycharts.com or by phone at (866) 965-7552
Interested in adding YCharts to your technology stack? Sign up for a 7-Day Free Trial.
Disclaimer
©2023 YCharts, Inc. All Rights Reserved. YCharts, Inc. (“YCharts”) is not registered with the U.S. Securities and Exchange Commission (or with the securities regulatory authority or body of any state or any other jurisdiction) as an investment adviser, broker-dealer or in any other capacity, and does not purport to provide investment advice or make investment recommendations. This report has been generated through application of the analytical tools and data provided through ycharts.com and is intended solely to assist you or your investment or other adviser(s) in conducting investment research. You should not construe this report as an offer to buy or sell, as a solicitation of an offer to buy or sell, or as a recommendation to buy, sell, hold or trade, any security or other financial instrument. For further information regarding your use of this report, please go to: ycharts.com/about/disclosure
Next Article
Monthly Market Wrap: April 2023Read More →