Monthly Market Wrap: April 2023
Welcome back to the Monthly Market Wrap from YCharts, where we break down the most important trends for advisors and their clients in this monthly market review. As always, feel free to download and share any visuals with clients and colleagues, or on social media.
Speaking of visuals: be sure to download our free Monthly Market Wrap slide deck, containing all charts featured in the Market Wrap + more.
Get the Monthly Market Wrap slide deck sent straight to your inbox. Download Here:April 2023 Market Summary
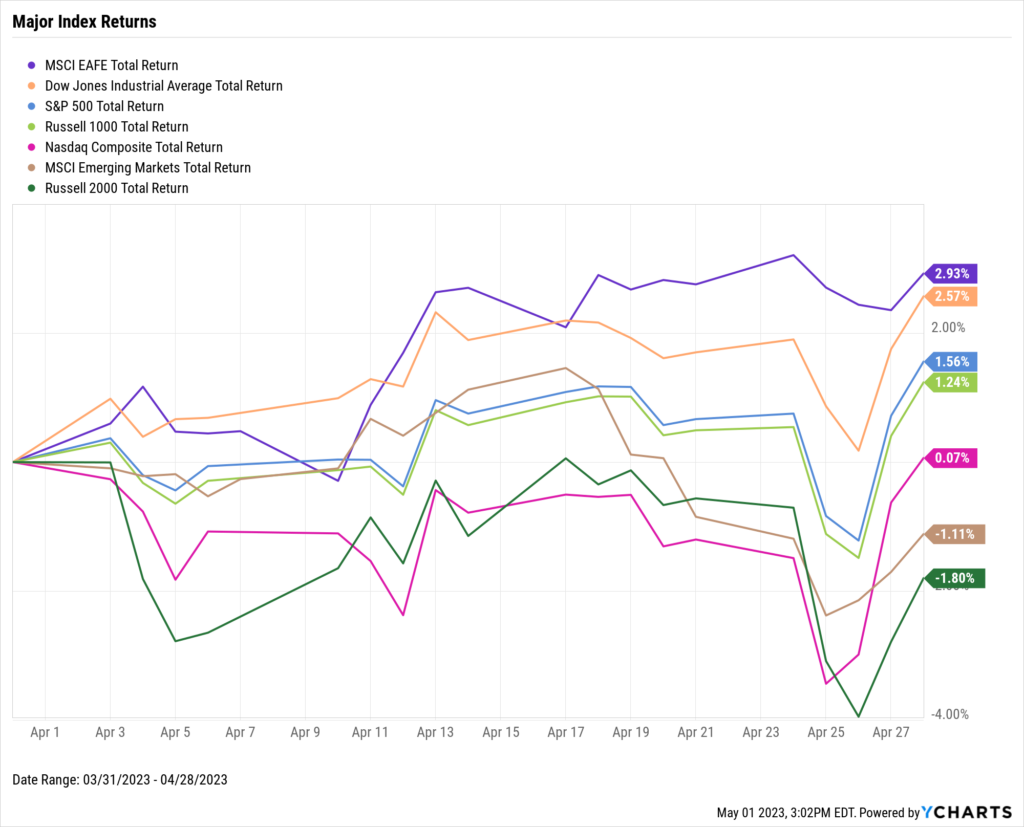
April was another positive month for stocks, with the exception of the small-cap Russell 2000 index. The Dow Jones Industrial Average rose 2.6%, the S&P 500 added 1.6%, and the NASDAQ eked out a 0.1% gain. The global equity picture was mixed; Developed Markets notched 2.9% higher, while Emerging Markets fell 1.1%. The Russell 2000 slipped 1.8%, marking its third consecutive monthly decline.
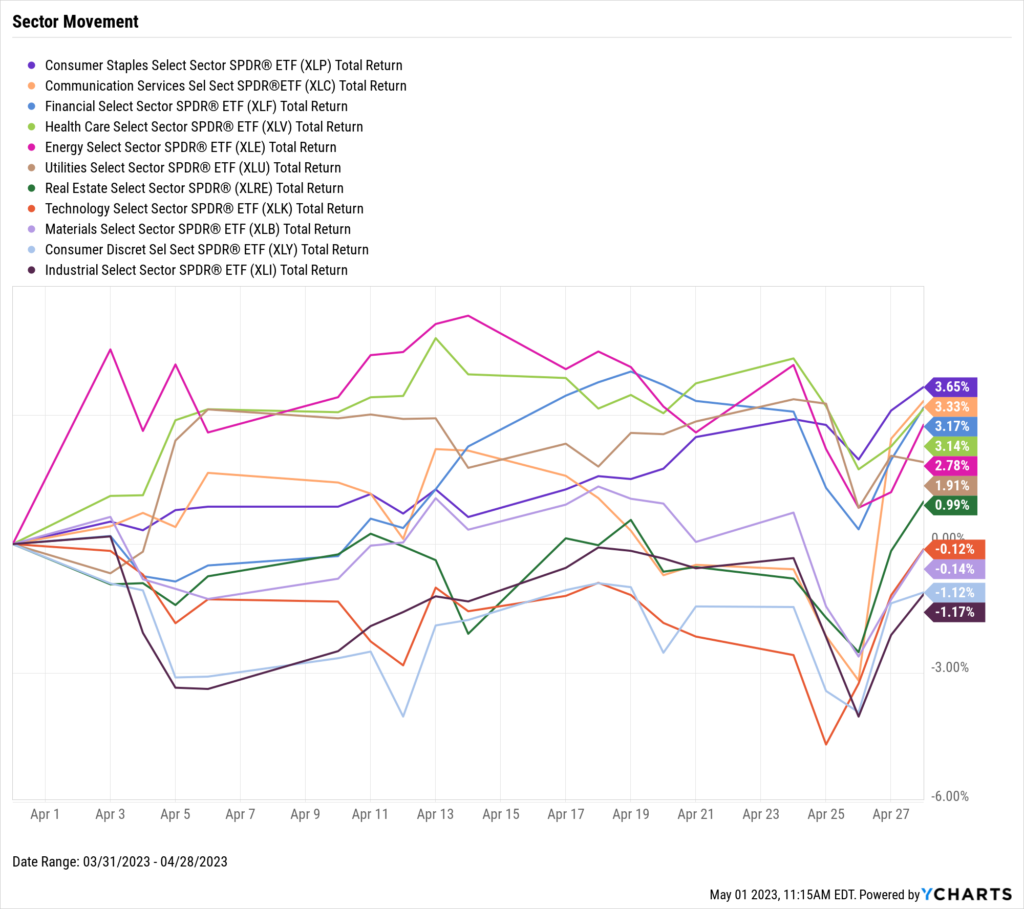
Seven of the 11 US stock sectors were positive in April, and four rose 3% or higher (Consumer Staples, Communication Services, Financials, and Health Care). April was a down month for cyclically-sensitive sectors, as Technology, Materials, Consumer Discretionary, and Industrials all took a breather.
Signs pointed to tamer inflation in April as the YoY US Producer Price Index fell all the way to 2.75%. US Inflation broke below 5% as US Core Inflation hovered around 5.5%. The price of WTI crude oil rose 3.9% to $78.64 per barrel and Brent shot up 6.4% to $84.23. This caused the average price of regular gas to increase almost a quarter per gallon, to $3.77 at the end of April.
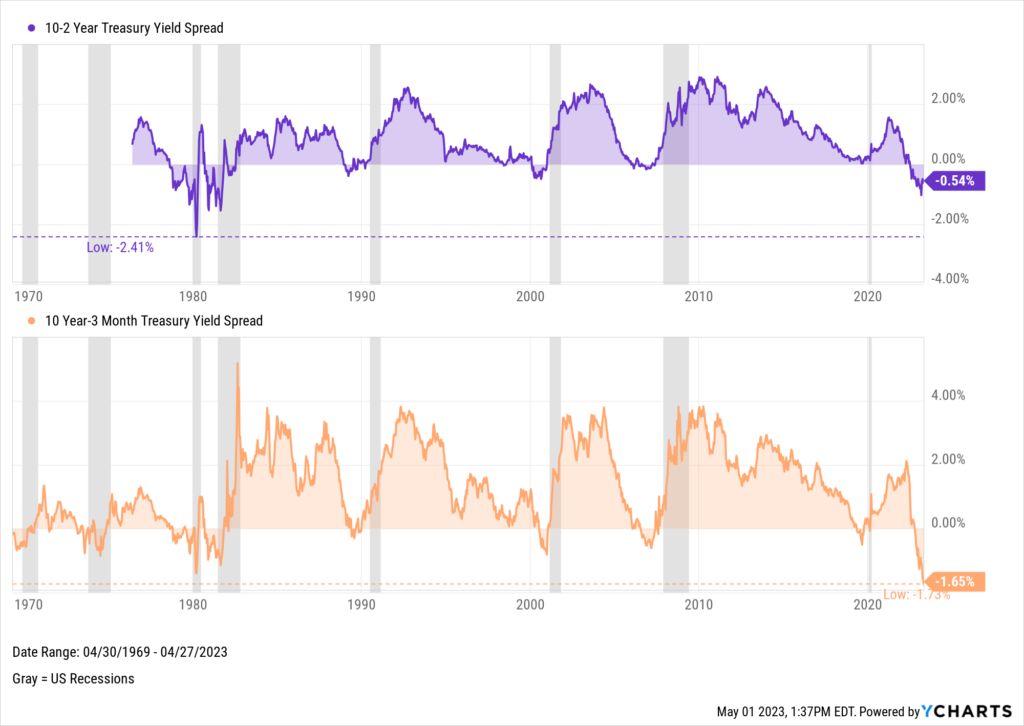
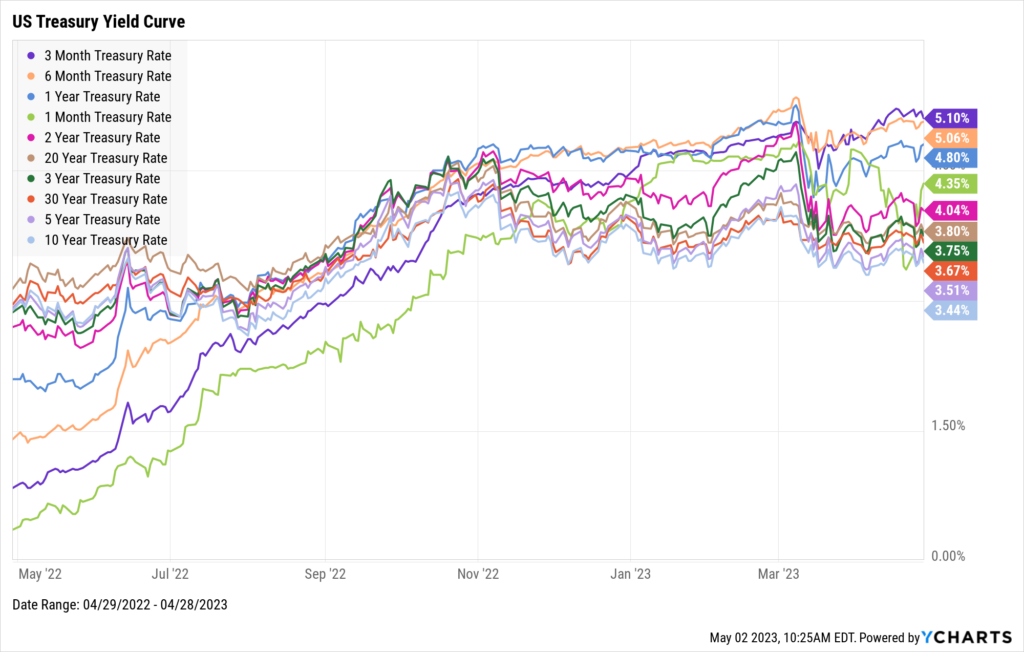
US Treasury yields broke 5% once again. The 3-Month and 6-Month Treasury Bills were the two durations to surpass 5% in April, at 5.18% and 5.06% respectively. April marked the 3-Month’s highest level for the since February 2007. The 5-Year’s yield of 3.51% was the lowest on the curve. Lastly, the 10 Year-3 Month Treasury Yield spread sunk to -1.65%, marking the spread’s largest inversion in history.
Jump to Fixed Income Performance
Want access to full-year charts and data as well? Download our Monthly Market Wrap Slide Deck for more:Off the YCharts! The Gaps Widen Further
If you use inverted yield spreads to forecast recessions, then April was a month worth paying attention to.
The 10 Year-3 Month Treasury Yield spread was inverted by as much as 173 basis points in April, marking its largest inversion ever. In March, the 10-2 Year Spread was flipped upside down by over 100 basis points and remained firmly inverted throughout April.
Every recession since 1970 has been preceded by at least one of these yield spreads inverting. Is a US recession lurking around the corner?
Download Visual | Modify in YCharts
Equity Performance
Major Indexes
Download Visual | Modify in YCharts | View Below Table in YCharts
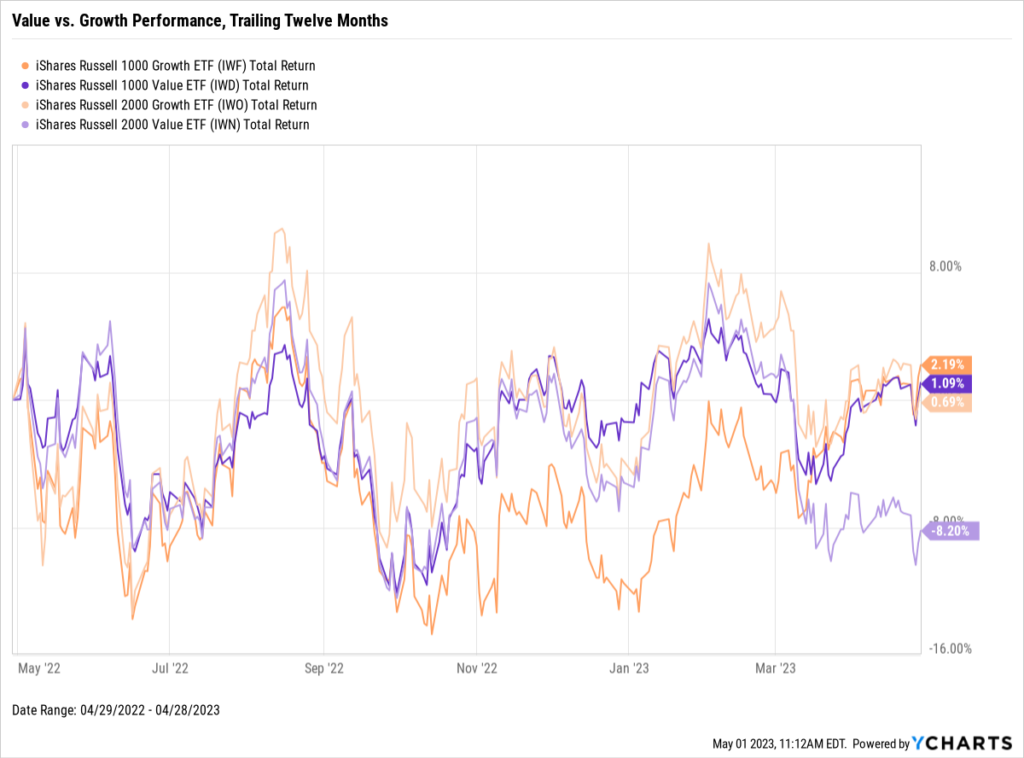
Value vs. Growth Performance, Trailing Twelve Months
Download Visual | Modify in YCharts | View in Comp Tables
US Sector Movement
Download Visual | Modify in YCharts | View Below Table in YCharts
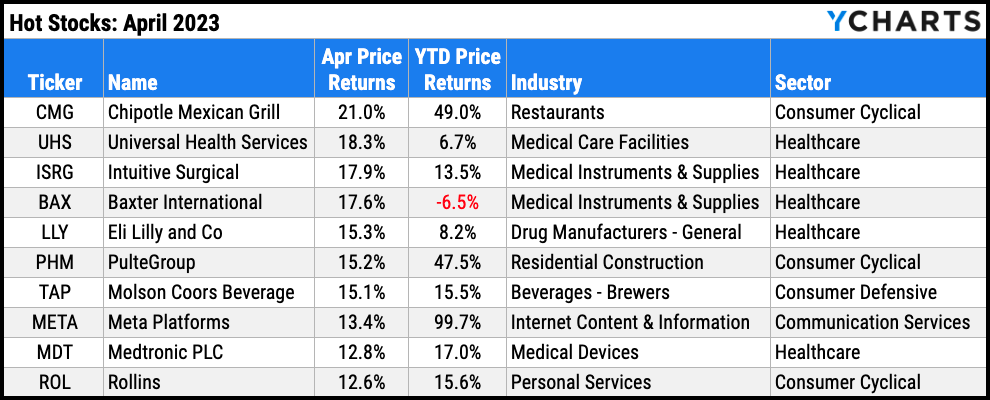
Hot Stocks: Top 10 S&P 500 Performers of April 2023
- Chipotle Mexican Grill (CMG): 21.0% gain in April
- Universal Health Services (UHS): 18.3%
- Intuitive Surgical (ISRG): 17.9%
- Baxter International (BAX): 17.6%
- Eli Lilly and Co (LLY): 15.3%
- PulteGroup (PHM): 15.2%
- Molson Coors Beverage Co (TAP): 15.1%
- Meta Platforms (META): 13.4%
- Medtronic PLC (MDT): 12.8%
- Rollins (ROL): 12.6%
Download Visual | Modify in YCharts
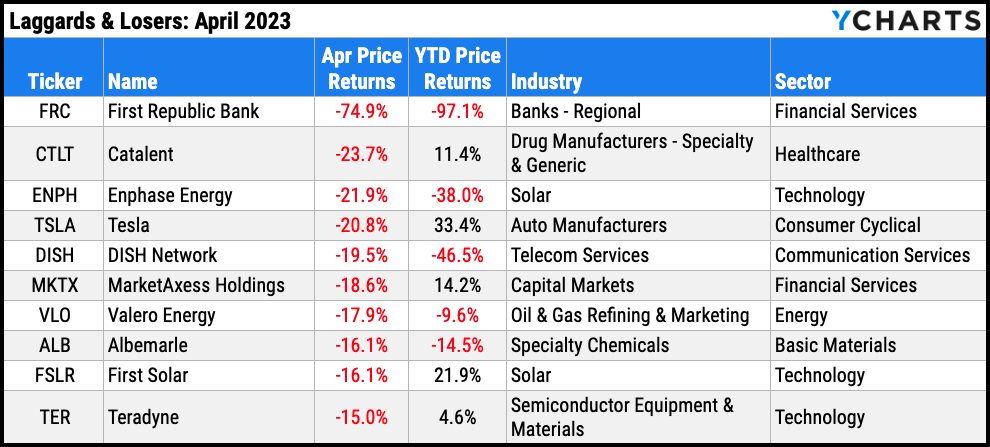
Laggards & Losers: 10 Worst S&P 500 Performers of April 2023
- First Republic Bank (FRC): -74.9% decline in April
- Catalent (CTLT): -23.7%
- Enphase Energy (ENPH): -21.9%
- Tesla (TSLA): -20.8%
- DISH Network (DISH): -19.5%
- MarketAxess Holdings (MKTX): -18.6%
- Valero Energy (VLO): -17.9%
- Albemarle (ALB): -16.1%
- First Solar (FSLR): -16.1%
- Teradyne (TER): -15.0%
Download Visual | Modify in YCharts
Featured Market & Advisor News
I Bond Rate Drops To 4.3% As Cooling Inflation Drags Yield Lower (FA-Mag)
Revolutionizing Client Relationships: A Guide to Using ChatGPT and YCharts for Financial Advisors (YCharts)
Pessimism about retirement rises amid inflation (InvestmentNews)
Value vs Growth: Current Trends, Top Stocks & ETFs (YCharts)
The Rush Into Money Funds Is Slowing, But They’re Still Growing (WealthManagement.com)
Economic Update — Reviewing Q1 2023 (YCharts)
Economic Data
Employment
March’s unemployment rate retreated back to 3.5%, and the labor force participation rate saw an increase of 0.1 percentage point for the fourth month in a row, bringing it to 62.6%. 236,000 jobs were added in March, which was near nonfarm payroll expectations of 239,000 for the month.
Consumers and Inflation
US Inflation cooled further in March to 4.98%, though US Core Inflation hovered at 5.59%. The last time YoY Core Inflation exceeded YoY Inflation was January 2021. The US Consumer Price Index was flat month-over-month, as was US Personal Spending. The FOMC meets Wednesday, May 3rd to decide on any changes it will make to the Target Federal Funds Rate, which was raised by 25 bps at the Fed’s March 22nd meeting to 5%. That meeting marked the first time the Fed Funds Rate reached 5% since August 2007.
Production and Sales
April’s US ISM Manufacturing PMI came in at 47.1, a rebound of 0.8 points but still putting the index firmly in contraction territory. US Retail and Food Services Sales declined 1% MoM, two months removed from its highest monthly increase since March 2021. The YoY US Producer Price Index rapidly cooled to 2.75% in March.
Housing
US New Single-Family Home Sales surged 9.6% in March, though US Existing Home Sales slipped 2.4%. Nonetheless, the Median Sales Price of Existing Homes rose by 3.3% to $375,700. Mortgage rates stayed about flat through April; 15-Year and 30-Year Mortgage Rates ended the month at 5.71% and 6.43%, respectively.
Commodities
The price of gold was flat MoM despite exceeding $2,000 per ounce within April. Gold clocked in at $2,048.50 midway through April, but ended the month back at $1,979.70. Oil prices rebounded; the price of WTI per barrel rose 3.9% to $78.64 and Brent surged 6.4% to $84.23. Both types of crude oil are down over 36% from their highs set in March of 2022. Higher oil prices led to the average price of regular gas increasing 24 cents per gallon, to $3.77 at the end of April.
Cryptocurrencies
The crypto bull run continued in April as the price of Bitcoin rose 4.7% in April, while Ethereum added 5.2%. Year-to-date, Bitcoin is up 76.4%, Ethereum is 56.9% higher, and neither has recorded a down month so far in 2023.
Fixed Income
US Treasury Yield Curve
1 Month Treasury Rate: 4.35%
3 Month Treasury Rate: 5.10%
6 Month Treasury Rate: 5.06%
1 Year Treasury Rate: 4.80%
2 Year Treasury Rate: 4.04%
3 Year Treasury Rate: 3.75%
5 Year Treasury Rate: 3.51%
10 Year Treasury Rate: 3.44%
20 Year Treasury Rate: 3.80%
30 Year Treasury Rate: 3.67%
Download Visual | Modify in YCharts
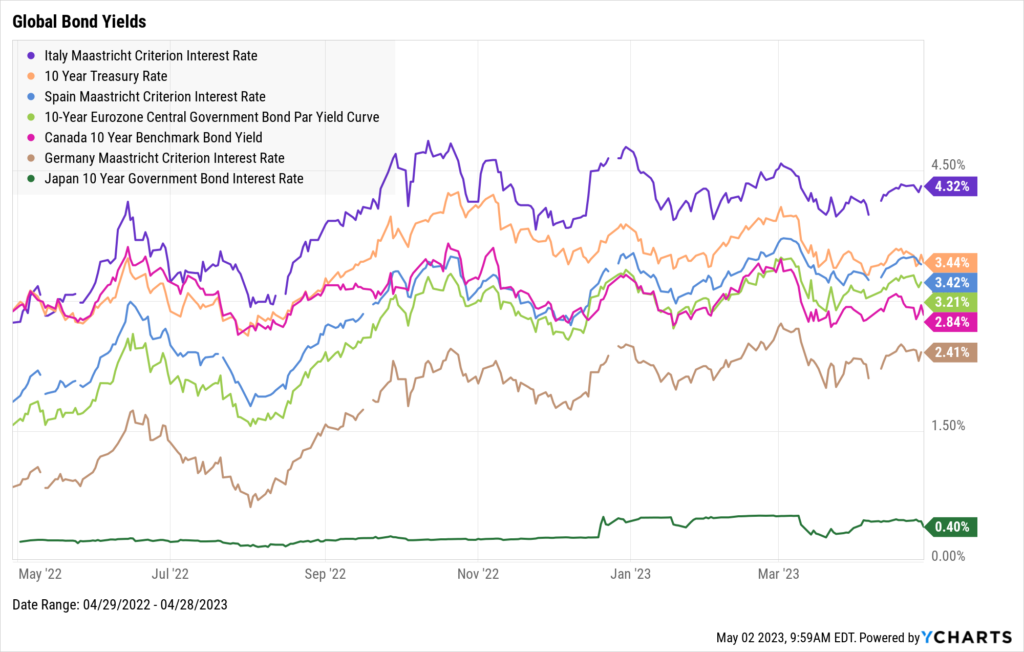
Global Bonds
Italy Long Term Bond Interest Rate: 4.32%
10 Year Treasury Rate: 3.44%
Spain Long Term Bond Interest Rate: 3.42%
10-Year Eurozone Central Government Bond Par Yield: 3.21%
Canada 10 Year Benchmark Bond Yield: 2.84%
Germany Long Term Bond Interest Rate: 2.41%
Japan 10 Year Government Bond Interest Rate: 0.40%
Download Visual | Modify in YCharts
Have a great May! 📈
Get the Monthly Market Wrap slide deck sent straight to your inbox. Download Here:Next Article
Revolutionizing Client Relationships: A Guide to Using ChatGPT and YCharts for Financial AdvisorsRead More →