Day 1 of Trump Tariffs: Market Reactions and What Advisors Need to Watch

Introduction: Tariffs Are Back — and So Is Volatility
April 2, 2025, marks the formal launch of President Trump’s reciprocal tariff regime, targeting major U.S. trading partners with a wave of elevated duties. The policy is designed to match foreign countries’ tariffs on U.S. goods with equivalent U.S. tariffs on their imports. This “mirror trade” approach is already having ripple effects across global equity markets, currency pairs, commodity pricing, and investor sentiment.
For asset managers and advisors, the early hours of this policy shift carry critical signals. Not just for macro outlooks, but for active portfolio adjustments, tactical positioning, and client communication strategies. This blog outlines the early-day market responses, provides a detailed tariff comparison table, and maps the unfolding implications for portfolio strategy using YCharts tools.
See how markets reacted after 1-week
Explore our full analysis on sector shifts, investor behavior, and what advisors should watch next.
The Tariff Table: Who’s Impacted Most?
The table below outlines the top 20 countries the U.S. trades with, along with their tariff rates on U.S. products and how U.S. tariffs have changed beginning April 2, 2025.
Source: USTR, World Bank, March 2025
Early Market Reaction: Where Did the Capital Move?
Equities
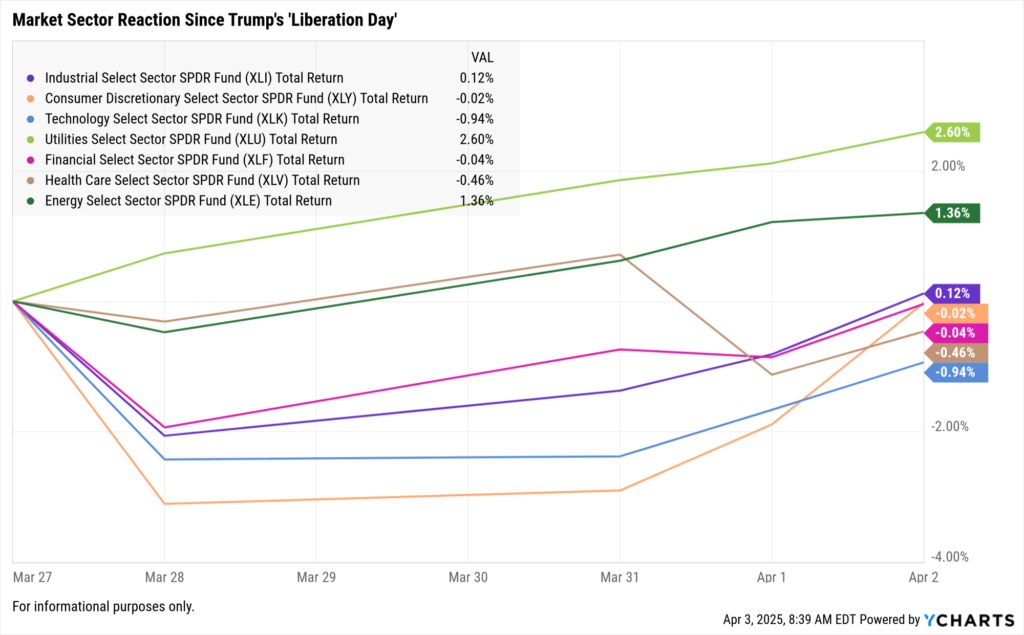
As of April 2, 2025, market sectors are showing a mixed but revealing reaction to Trump’s tariff announcement. Over the five trading days leading up to and including April 2, sector performance reflects investors recalibrating exposure toward defensives, energy, and domestic supply chains.
Analysis:
- Utilities and Energy led the market, as investors rotated toward income-generating and inflation-hedged sectors.
- Industrials held ground, benefiting from expected reshoring and infrastructure demand.
- Consumer Discretionary and Financials were flat, reflecting neutral sentiment amid uncertainty.
- Technology posted the steepest decline, likely impacted by exposure to global hardware supply chains and export risks.
Small-cap indexes (like the Russell 2000) continued to slightly outperform large-caps, reinforcing the theme of domestic economic insulation. Semiconductor and large-cap tech stocks remain bifurcated—NVIDIA and Broadcom extended losses (-1.2% and -0.9%, respectively), while Super Micro Computer gained +1.4%, signaling selective risk appetite for AI- and infrastructure-aligned names.
Currencies
The U.S. dollar gained 0.3% against the euro and 0.5% against the Japanese yen on April 2, 2025, as investors priced in lower global trade volumes and potential capital flight to the U.S.
The Mexican peso fell 0.6% amid uncertainty over nearshoring incentives and potential retaliatory tariffs.
The British pound was flat, but volatility spiked slightly ahead of expected UK policy commentary on U.S. trade policy.
Commodities
WTI crude closed at $80.13 per barrel, down 1.8%, amid growing concerns over a global demand cooldown triggered by protectionist policies.
Gold climbed to $2,089 per ounce (+0.9%), extending its gains as institutional investors moved into defensives.
Copper dropped 2.2%, reflecting global growth concerns and potential disruptions in industrial manufacturing trade flows.
Implications for Asset Managers and Advisors
1. Sector Exposure and Rotation Strategy
The new tariff structure affects global revenue-generating companies disproportionately. Managers should assess holdings in industrials, autos, semiconductors, and luxury retail for overweight exposure to countries facing elevated tariffs.
Use YCharts’ Holdings Overlap Tool to:
Identify overlapping exposure across funds to high-risk geographies
Quantify concentration risk in multinational-heavy ETFs
Use YCharts’ Fundamental Charts to:
Chart revenue breakdown by region for impacted tickers
Compare sector relative performance under trade shock scenarios
2. Repricing Risk in Earnings Forecasts
Many S&P 500 companies have not yet updated forward guidance post-tariffs. Asset managers should proactively simulate EPS risk where margin compression is likely due to import cost spikes.
Use YCharts’ Scenario & Stress Testing to:
Model downside earnings impact across sectors
Stress portfolios under elevated input costs or reduced foreign demand
3. Watchlist: Key Data and Earnings to Track
Q1 earnings (beginning mid-April) will be the first post-tariff datapoint
PMI data and import/export volumes from Census Bureau and ISM
Chinese retaliatory announcements expected in the coming days
Create a YCharts Dashboard to:
Track market volatility (VIX), tariff-sensitive ETFs (e.g., XLI, XRT), and key international indices (e.g., Nikkei, DAX, Hang Seng)
How YCharts Can Help Advisors Navigate a Trade-Driven Market
Spot overlapping exposures to multinational companies across ETFs, mutual funds, and custom portfolios.
Track margins, revenue breakdowns, and trade-related KPIs (e.g., cost of goods sold) over time.
Model multiple scenarios including prolonged trade escalation, sector rotation into defensives, or margin shocks.
Package tariff insights, portfolio impacts, and visuals into client-ready reports that tell a data-driven story.
Stay on top of global trade metrics, GDP forecasts, CPI shifts, and export/import trends.
What’s Next: Upcoming Tariffs and the April 3 Auto Shake-Up
While the reciprocal tariffs on general goods took effect April 2, 2025, a second wave of sector-specific tariffs is already on the calendar. On April 3, 2025, the U.S. will implement a 25% tariff on imported passenger vehicles and automotive parts from a range of countries that have maintained historically high tariffs or non-tariff barriers against U.S. auto exports.
Countries Affected:
Germany, Japan, and South Korea are primary targets due to long-standing imbalances in vehicle trade.
Tariffs will apply to both assembled vehicles and components, including EV batteries, drivetrains, and software-linked subsystems.
Market Implications:
U.S. automakers with global supply chains may face higher input costs for vehicles assembled domestically using imported parts.
Foreign automakers (Toyota, BMW, Hyundai) may see pressure on U.S. sales and potential retaliatory tariffs abroad.
Domestic parts suppliers and small-cap automotive service firms may benefit from near-term reshoring incentives and cost advantages.
Beyond Autos: Other Tariffs Expected in Q2 2025
Pharmaceutical APIs: Proposed 10% tariff on active pharmaceutical ingredients from India and China, expected by mid-May.
Green tech components: Tariffs on imported solar panels and wind turbines expected by June, aimed at boosting domestic manufacturing.
What Advisors Should Monitor
Corporate Guidance: Q1 earnings calls will be key for hearing how auto manufacturers and large multinationals plan to navigate new tariff costs.
Supply Chain Indicators: Watch import/export data and logistics indexes for signs of slowdowns, inventory buildups, or port congestion.
Policy Signaling: Keep an eye on retaliatory announcements from key partners. Germany and Japan have both hinted at potential WTO challenges or reciprocal action.
How Advisors Can Prepare
Run auto sector exposure screens using YCharts to identify portfolios overweight in impacted names.
Stress test global exposure using Scenario Analysis to evaluate downside risk under 20%+ input cost assumptions.
Consider thematic ETFs focused on domestic manufacturing, nearshoring, or small-cap U.S. industrials likely to benefit.
Use Custom Reports to summarize client-level exposure and proactively communicate how you’re positioning portfolios for tariff resilience.
Conclusion: Day 1 Is Only the Beginning
Trump’s reciprocal tariffs have reshaped the global investment landscape overnight. While many effects will unfold in the coming weeks, Day 1 data already points to a recalibration of sector leadership, earnings risk, and macro exposure.
For asset managers and advisors, the priority is clear: monitor tariff sensitivity, reassess portfolio composition, and communicate proactively with clients about what this trade shift means.
This blog will be continuously updated as more data becomes available, including sector rotation trends, retaliatory measures, and earnings commentary from companies exposed to the new tariff regime.
Whenever you’re ready, here’s how YCharts can help you:
1. Looking to Move On From Your Investment Research and Analytics Platform?
2. Want to test out YCharts for free?
Start a no-risk 7-Day Free Trial.
Disclaimer
©2025 YCharts, Inc. All Rights Reserved. YCharts, Inc. (“YCharts”) is not registered with the U.S. Securities and Exchange Commission (or with the securities regulatory authority or body of any state or any other jurisdiction) as an investment adviser, broker-dealer or in any other capacity, and does not purport to provide investment advice or make investment recommendations. This report has been generated through application of the analytical tools and data provided through ycharts.com and is intended solely to assist you or your investment or other adviser(s) in conducting investment research. You should not construe this report as an offer to buy or sell, as a solicitation of an offer to buy or sell, or as a recommendation to buy, sell, hold or trade, any security or other financial instrument. For further information regarding your use of this report, please go to: ycharts.com/about/disclosure
Next Article
Monthly Market Wrap: March 2025Read More →