Decoding the Fed’s Holding Pattern: Interest Rate Implications for Markets and the Economy Q2 2025
Introduction: The Fed Holds Steady—What Now?
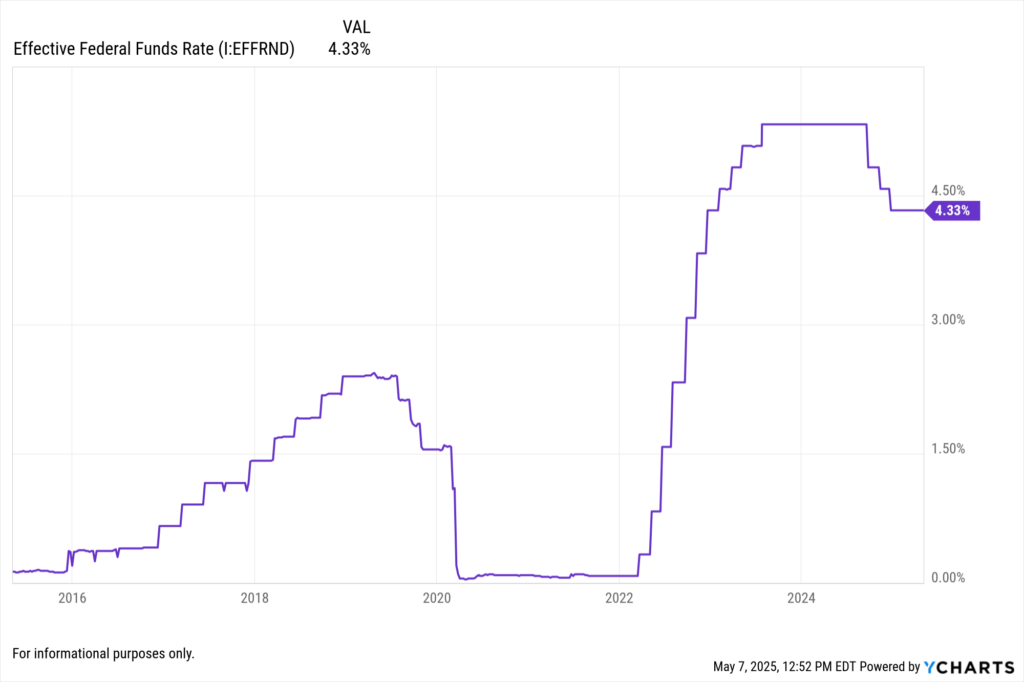
The Federal Reserve concluded its May 2025 FOMC meeting by maintaining the interest rate at 4.25% to 4.50%, a move widely anticipated by markets. Amid mixed macroeconomic signals—slowing GDP, stubborn inflation, and geopolitical uncertainties—this holding pattern marks a pivotal moment for asset managers and advisors.
This blog dissects what the Fed’s decision means for the U.S. economy, sector-level dynamics, and how investment professionals can position portfolios with precision as Q2 unfolds.
The Fed’s Strategic Balancing Act: Inflation vs. Growth
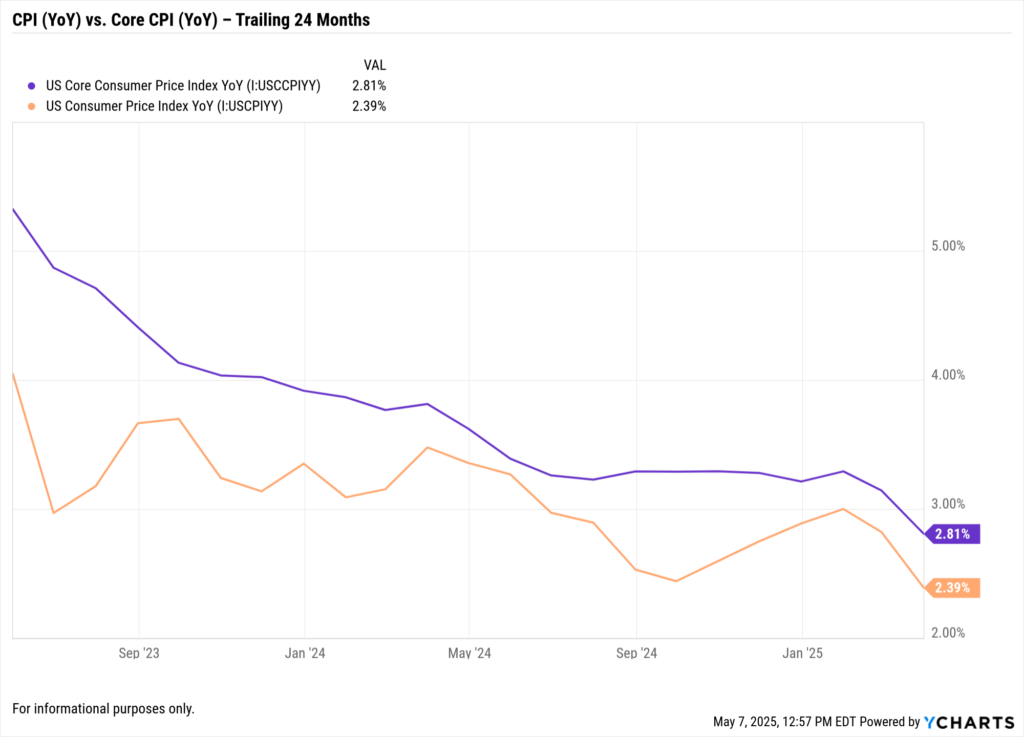
Despite some moderation, inflation remains above the Fed’s 2% target. Simultaneously, the U.S. economy contracted by 0.3% in Q1 2025—the first negative quarter since 2022. These data points have created a split narrative: inflation remains sticky, but the economy is slowing.
Chair Jerome Powell emphasized during his press conference that the Fed will stay the course with a data-dependent approach, signaling no rush to cut. April’s jobs report showed a net gain of 177,000 jobs with unemployment steady at 4.2%, reinforcing the complexity of this moment: a softening economy, but not soft enough to trigger immediate action.
When Will Rates Move? Projecting the Next Policy Shift
Market Expectations vs. Economic Realism
As of May 2, futures markets reflect a 60–70% probability of a July rate cut, with a follow-up in September also possible. Yet, several Fed watchers and institutional economists urge caution.
Core inflation—particularly in shelter and services—remains elevated. Powell’s commentary highlighted the Fed’s reluctance to risk repeating past mistakes by cutting the federal funds rate prematurely and reigniting inflation.
The Data-Dependent Playbook
The next phase of policy hinges on clear trends in:
- Inflation: Sustained CPI declines across core categories.
- Labor: A softening trend in hiring or rising unemployment.
- Trade & Growth: A worsening trade balance or additional GDP contractions could tip the scales.
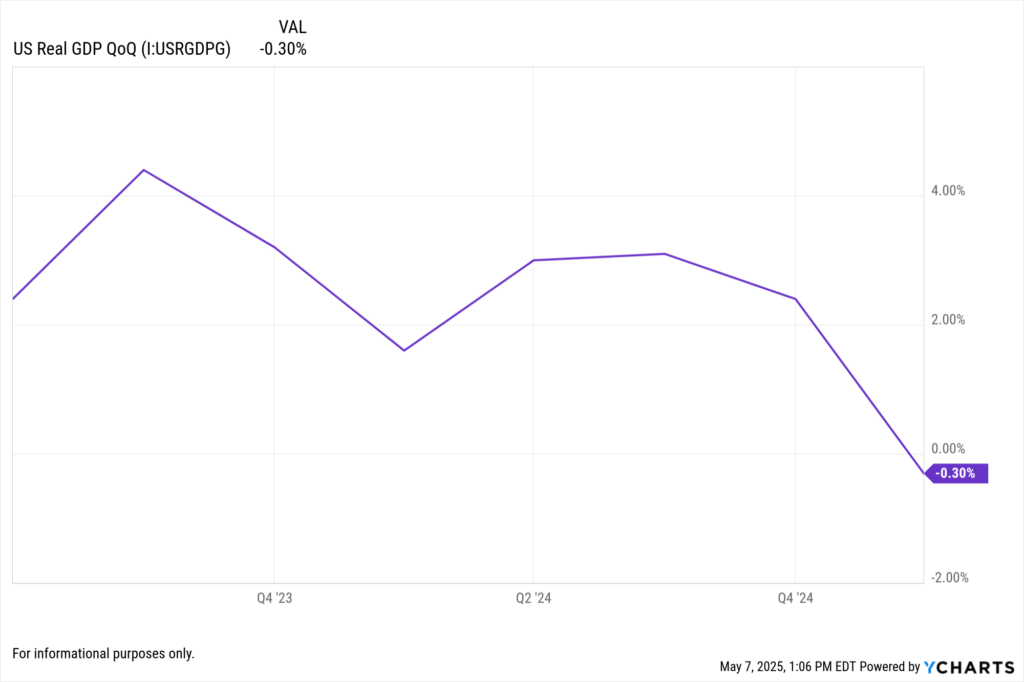
April’s $140.5B trade deficit and the Q1 GDP dip are early signals—but not yet decisive. The Fed is watching for cumulative weakness across data points.
Sector-Level Reactions to a Holding Pattern
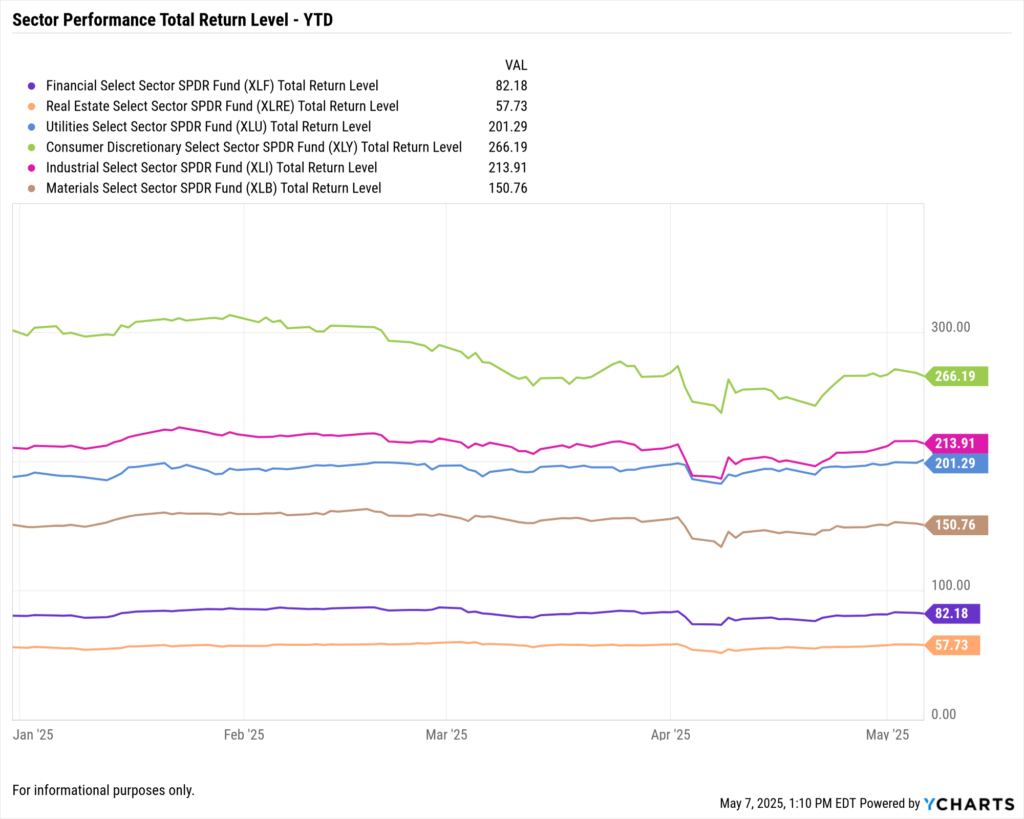
Understanding rate sensitivity is key to shaping portfolio strategy in Q2. Here’s a breakdown of how sectors are reacting to the interest rate hold—and what to watch:
Financials (XLF)
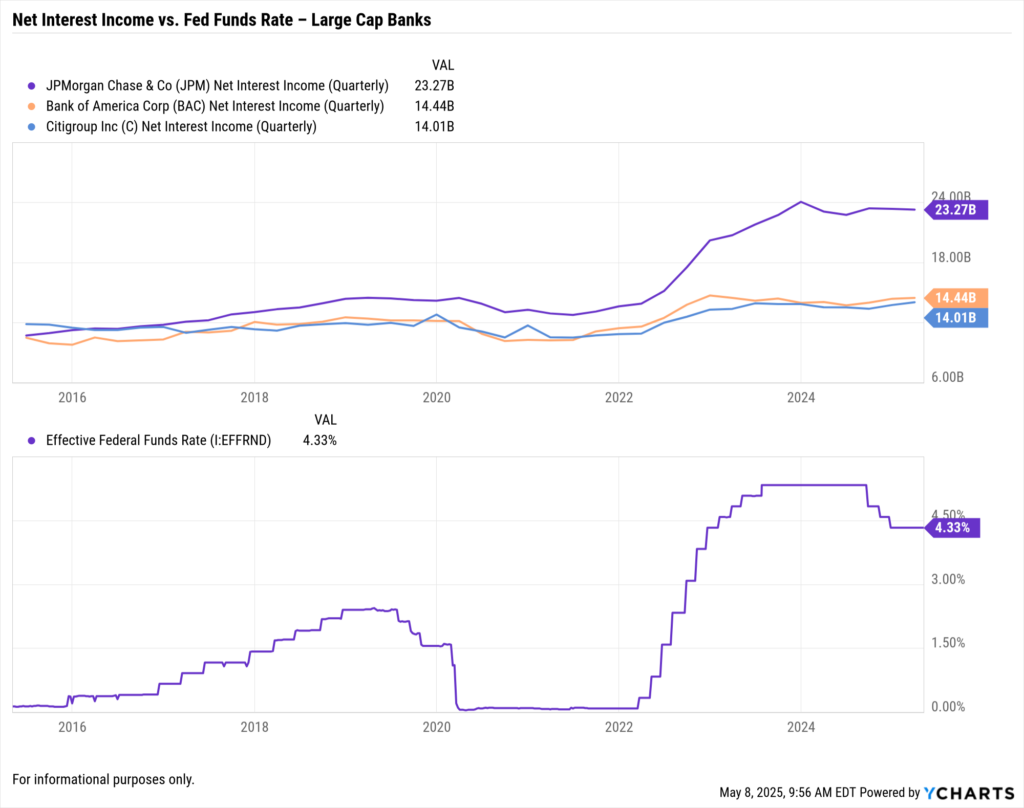
- Positive Catalyst: Stable rates help banks maintain net interest income margins.
- Risk Factor: Slower loan growth amid macroeconomic caution.
- Watch: Regional bank earnings and credit risk trends.
Real Estate (XLRE)
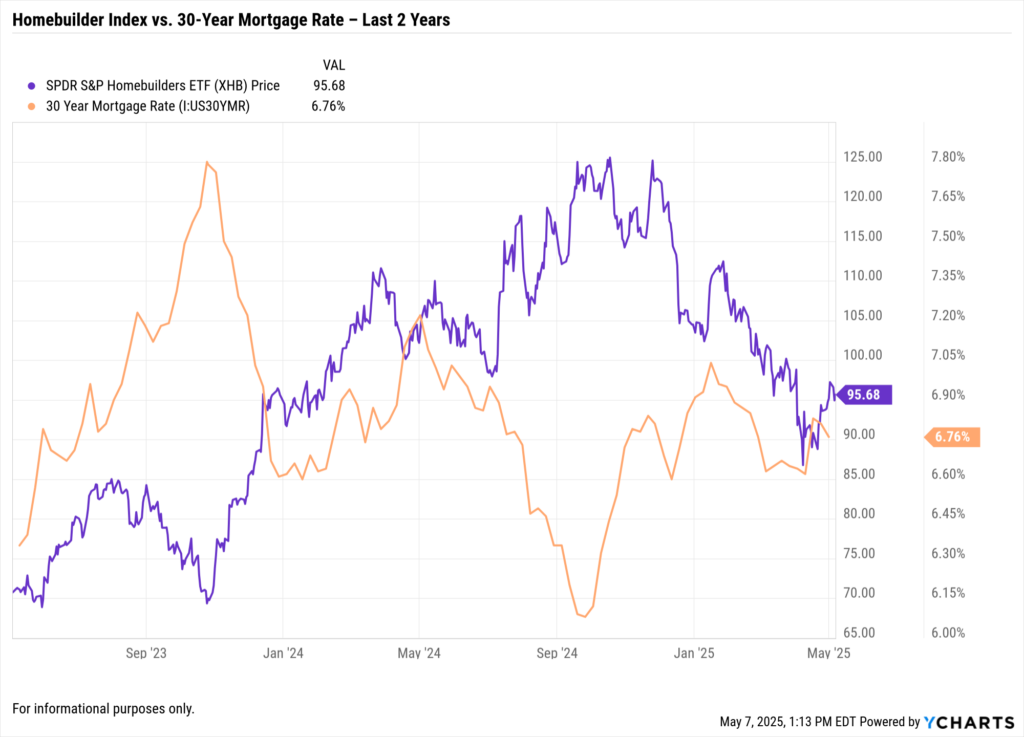
- Headwind: High mortgage and development borrowing costs reduce REIT profitability and homebuyer demand.
- Watch: 30-Year Fixed Mortgage Rate and REIT FFO trends.
Utilities (XLU)
- Challenge: Dividend yields less attractive vs. Treasuries in a high-rate environment.
- Watch: Capital expenditure reports and sector ETF inflows.
Consumer Discretionary (XLY)
- Mixed: Spending resilient so far, but could decline with continued rate pressure on household debt.
- Watch: Auto sales, credit card delinquencies, and guidance from retailers like Home Depot and Nike.
Industrials & Materials (XLI/XLB)
- Slowdown Risk: High rates may deter capital spending.
- Watch: Capital goods orders, PMI data, and margin outlooks in earnings reports from Caterpillar, 3M, and others.
Strategic Considerations for Advisors & Asset Managers
• Tilt toward rate-resilient sectors like Financials and select Consumer Staples with strong cash flow.
• Limit exposure to over-leveraged Real Estate and highly cyclical Industrials.
• Use economic dashboards to watch CPI, PCE, and employment releases for any signs of policy inflection.
• Model outcomes using YCharts Scenario Analysis and monitor sector-level rotation in real-time.
How YCharts Can Help
YCharts tools can help advisors stay ahead of market moves as the Fed navigates the second half of 2025.
Fundamental Charts: Track Fed Funds Rate, CPI, PCE, and GDP YoY trends side-by-side.
Scenario & Stress Testing: Model how a 25bps or 50bps cut would affect portfolio allocations.
Custom Reports: Build investor-facing visuals on macro trends and rate scenarios.
Economic Dashboard: Customize your view of market, portfolio, security, and economic data.
Conclusion: Read Between the (Policy) Lines
The Fed’s decision to hold the interest rate steady isn’t an endpoint—it’s a waypoint. With no immediate cuts, markets are left navigating inflation that’s sticky and growth that’s softening.
For advisors and asset managers, the key is balance:
• Stay positioned for resilience if rates remain elevated.
• Be prepared to pivot quickly when economic data points more clearly toward easing.
• Use platforms like YCharts to visualize risk, build insight, and communicate strategy.
As we await the next CPI print and June FOMC outlook, stay tactical, stay data-driven, and stay client-focused.
Whenever you’re ready, here’s how YCharts can help you:
1. Looking to Move On From Your Investment Research and Analytics Platform?
2. Want to test out YCharts for free?
Start a no-risk 7-Day Free Trial.
Disclaimer
©2025 YCharts, Inc. All Rights Reserved. YCharts, Inc. (“YCharts”) is not registered with the U.S. Securities and Exchange Commission (or with the securities regulatory authority or body of any state or any other jurisdiction) as an investment adviser, broker-dealer or in any other capacity, and does not purport to provide investment advice or make investment recommendations. This report has been generated through application of the analytical tools and data provided through ycharts.com and is intended solely to assist you or your investment or other adviser(s) in conducting investment research. You should not construe this report as an offer to buy or sell, as a solicitation of an offer to buy or sell, or as a recommendation to buy, sell, hold or trade, any security or other financial instrument. For further information regarding your use of this report, please go to: ycharts.com/about/disclosure
Next Article
Q1 2025 Earnings Recap: Sector Trends & Tariff Impact AnalysisRead More →