Economic Update — Reviewing Q1 2022
The post-pandemic stock market rally came to a sobering halt in the first quarter of 2022.
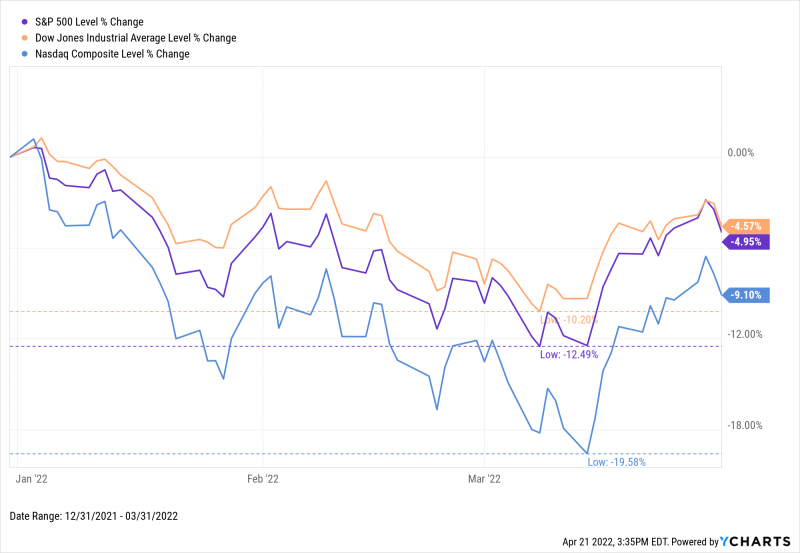
All three major US indices fell by double digit percentage points at some point in Q1. The Dow ended the first quarter of 2022 4.6% lower, the S&P 500 finished Q1 down 5%, and the NASDAQ was off 9.1% after having grazed bear market territory in early March.
Download Visual | Modify in YCharts
As measured by the VIX “fear index”, volatility had been decreasing steadily since April of 2020…up until now.
Sometimes it feels like “the sky is falling”, but a well-informed outlook can help you realize it’s just the ebb and flow of the tide. After all, equities have a long track record of growth—and even at its lowest point of Q1, the S&P 500 was still up 27.5% from its pre-COVID-19 all time high.
Below is a sneak peek of insights from the YCharts Q1 2022 Economic Summary Deck. The deck, published quarterly, arms advisors and investors with key insights from the previous quarter to help you make smarter investment decisions going forward. Furthermore, the deck is easily customizable with your own firm branding to be leveraged in client communications.
Want the Economic Update slide deck sent straight to your inbox? Subscribe here:
Asset Class Performance
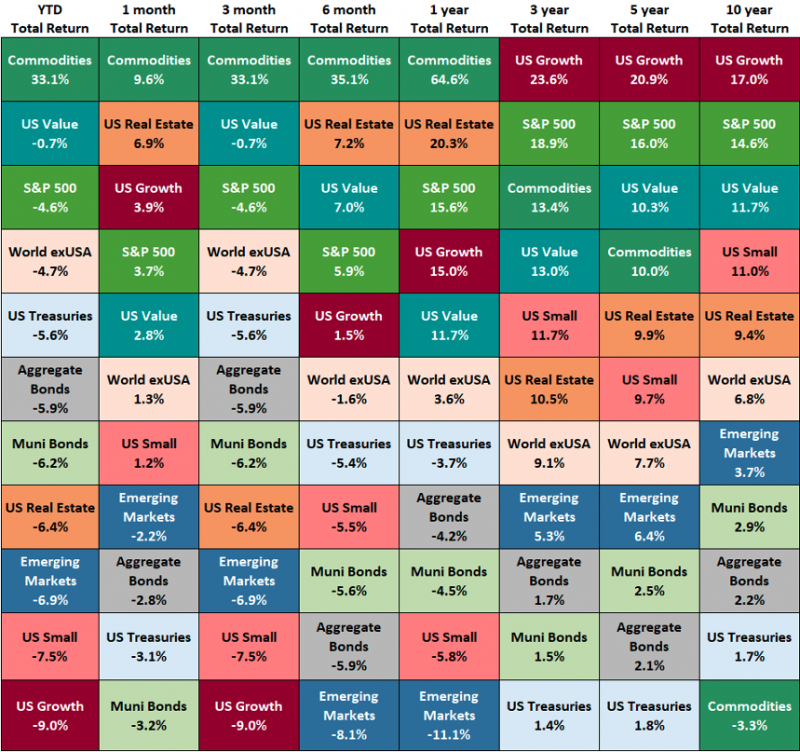
With the notable exception of Commodities, every major asset class fell in Q1.
Commodities jumped 33.1% as a result of constrained energy supplies, which stemmed from the Russia & Ukraine conflict, inflation pressures, and a global economic resurgence that’s pushing demand for gasoline and other resources higher. However, the standout performance of commodities in Q1 (and over the past year) has not been enough to turn the asset class positive over the last decade.
US Value stocks were down the least of any equity class, but its Growth counterpart ended the quarter in last place on the following asset performance matrix, down 9.0%.
Click to Download Asset Class Performance Table
Fixed income prices also drifted lower in Q1 thanks to rising yields and a series of planned Fed rate hikes. US Treasuries fell 5.6%, Aggregate Bonds 5.9%, and Municipal Bonds 6.2%.
Around the globe, ex-USA vehicles fell by 10 more basis points than the US-domiciled S&P 500 did in Q1. Driving the 6.9% quarterly decline in Emerging Markets was the China MSCI Index cratering 14.2%, The country comprises 30% of the Emerging Market index. China’s pullback overshadowed a 34.3% return by the MSCI Brazil Index, which makes up just 6% of MSCI’s EM index.
Rising Gas Prices Pump Inflation Higher
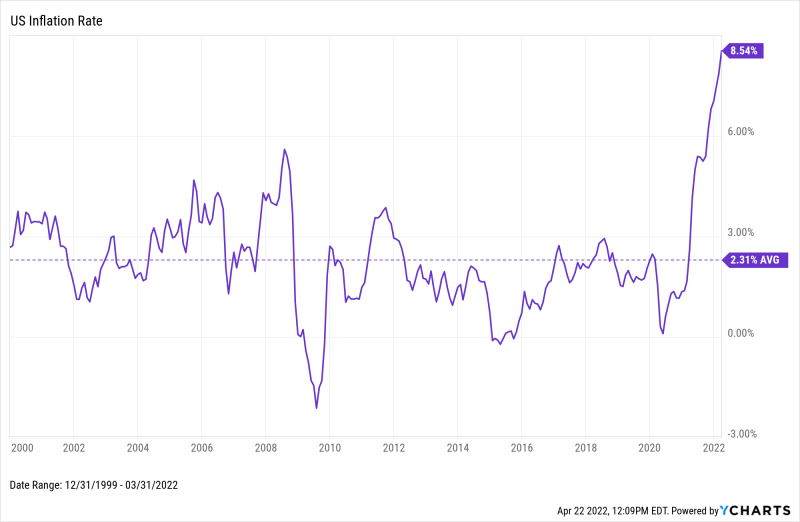
If there’s one input to the Consumer Price Index to blame for runaway inflation, it’s energy costs—a la gas prices. The US Inflation Rate clocked in at 8.5% in March 2022, a level not seen in 40 years. Inflation is currently well above its 2.3% average since 2000, which also happens to be right around the Federal Reserve’s “target” of 2%.
Download Visual | Modify in YCharts
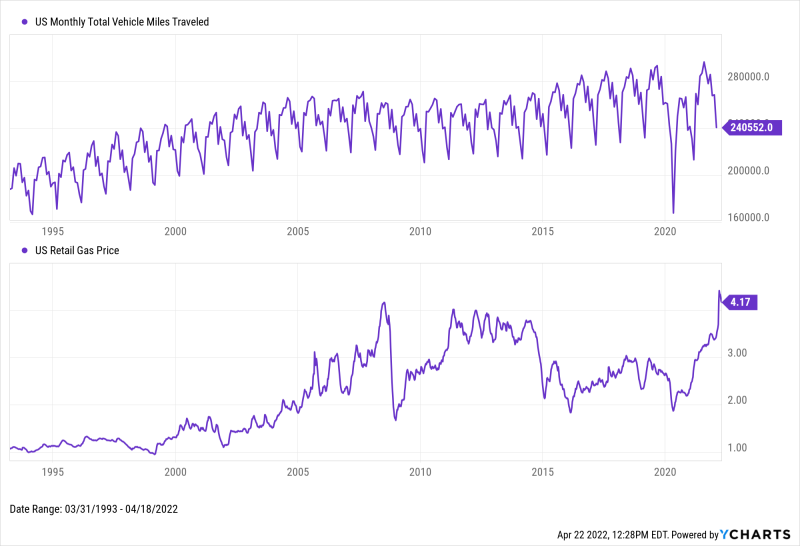
As for prices at the pump, the average US Retail Gas Price also hit a multi-decade high of $4.33 per gallon as of quarter’s end. Premium Gas Prices topped $5.00/gallon in March before settling at $4.99/gallon at the end of Q1, making it more expensive to take that shiny new Corvette out for a Sunday spin. Though US Monthly Total Vehicle Miles Traveled is trending upward on a year-over-year basis through January of 2022, many will be watching to see what effect the newfound surge in gas prices has on Americans’ car travel habits as new data rolls in.
Download Visual | Modify in YCharts
YCharts users—download the full deck in the Support Center. Not a current client? Reach out to get access, or enter your email below to receive a free version of the deck:
Get the Economic Update slide deck sent straight to your inbox by subscribing here:
Connect with YCharts
To get in touch, contact YCharts via email at hello@ycharts.com or by phone at (866) 965-7552
Interested in adding YCharts to your technology stack? Sign up for a 7-Day Free Trial.
Disclaimer
©2022 YCharts, Inc. All Rights Reserved. YCharts, Inc. (“YCharts”) is not registered with the U.S. Securities and Exchange Commission (or with the securities regulatory authority or body of any state or any other jurisdiction) as an investment adviser, broker-dealer or in any other capacity, and does not purport to provide investment advice or make investment recommendations. This report has been generated through application of the analytical tools and data provided through ycharts.com and is intended solely to assist you or your investment or other adviser(s) in conducting investment research. You should not construe this report as an offer to buy or sell, as a solicitation of an offer to buy or sell, or as a recommendation to buy, sell, hold or trade, any security or other financial instrument. For further information regarding your use of this report, please go to: ycharts.com/about/disclosure
Next Article
Inverted Yield Curve, Chinese Stocks, Bond ETF Yields | What's Trending on YCharts?Read More →