Inverted Yield Curve, Chinese Stocks, Bond ETF Yields | What’s Trending on YCharts?
Every month, What’s Trending on YCharts? takes a look at the traffic to different pages on YCharts and reveals the stocks, funds, and economic indicator pages that are being searched for most (on both YCharts and Google).
In March 2022, trending data included the 10-2 Year Yield Spread, which recently and briefly inverted, Alibaba (BABA) and other Chinese companies facing SEC scrutiny, international and US bond ETFs, and much more.
To get the full scoop on everything trending, watch the latest episode here:
Hottest Company Pages
These stock data pages had the largest month-over-month unique pageview growth in March 2022, as compared to February 2022.
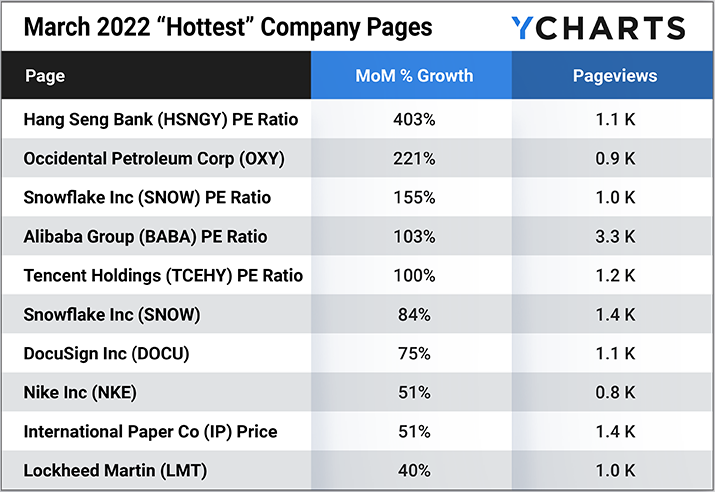
• Hang Seng Bank (HSNGY) PE Ratio
• Occidental Petroleum Corp (OXY)
• Snowflake Inc (SNOW) PE Ratio
• Alibaba Group (BABA) PE Ratio
• Tencent Holdings (TCEHY) PE Ratio
• International Paper Co (IP) Price
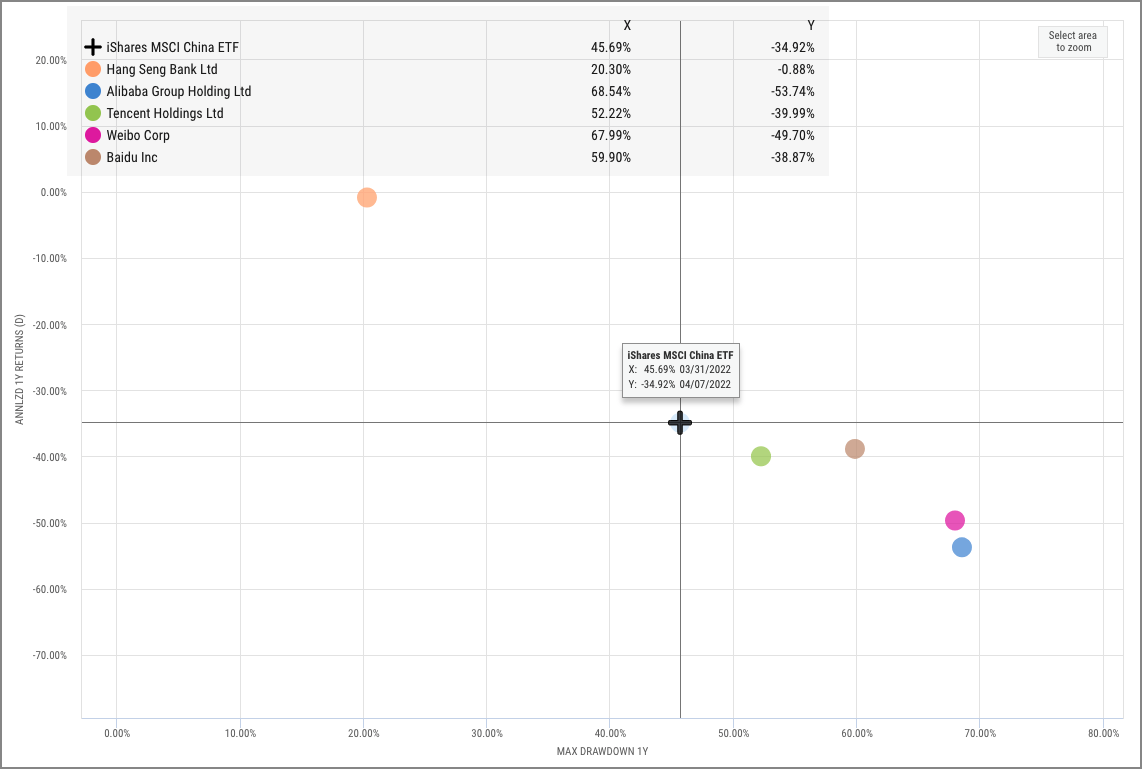
This scatter plot includes the iShares MSCI China ETF (MCHI) and several well-followed companies from China or Hong Kong, Hang Seng Bank, Alibaba Group, Tencent Holdings, Weibo and Baidu. In March, the SEC released an initial list of companies, which included Alibaba and Baidu, whose accounting audits it would like to investigate more thoroughly. Historically, two jurisdictions have not cooperated with the U.S. Public Company Accounting Oversight Board (PCAOB) and their requirements via the Sarbanes-Oxley Act of 2002: China and Hong Kong. Well, the SEC is finally making good on a law from 2020 that puts particular pressure on Chinese stocks and ADRs.
Across the board, Chinese stocks are selling off in response to the news. Alibaba’s and Weibo’s share prices are both down about 45% over the last year, with maximum drawdowns exceeding 67%.
Download Visual | Modify in YCharts
Most Popular Fund Pages
These mutual fund and ETF pages had the most unique pageviews in March 2022.
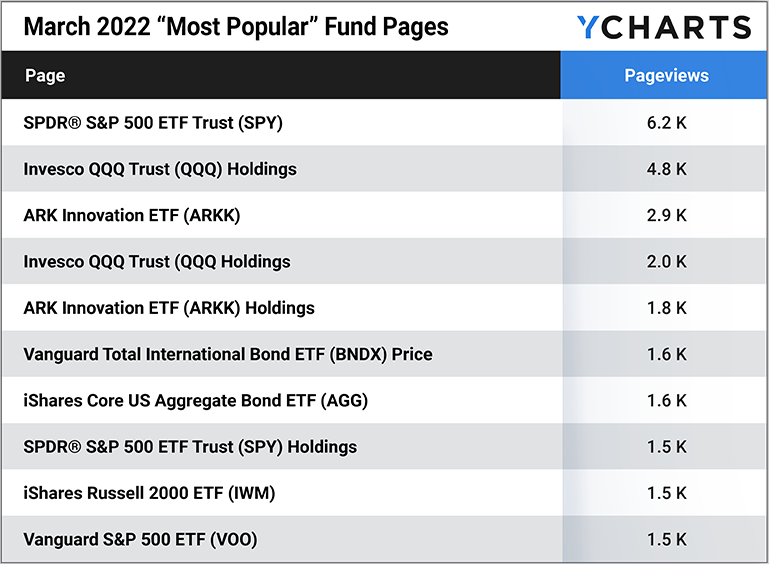
• SPDR® S&P 500 ETF Trust (SPY)
• Invesco QQQ Trust (QQQ) Holdings
• ARK Innovation ETF (ARKK) Holdings
• Vanguard Total International Bond ETF (BNDX) Price
• iShares Core US Aggregate Bond ETF (AGG)
• SPDR® S&P 500 ETF Trust (SPY) Holdings
• iShares Russell 2000 ETF (IWM)
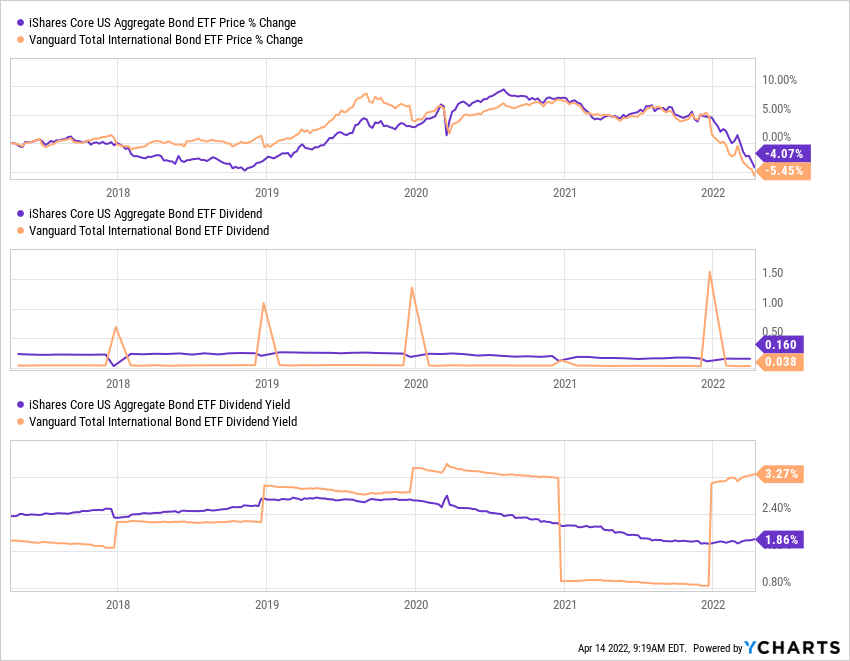
Using the iShares Core US Aggregate Bond ETF (AGG) and Vanguard Total International Bond ETF (BNDX), this chart paints a quick comparison of yields offered by US and international bonds. While AGG pays a consistent but relatively high dividend, BNDX doles out a smaller monthly interest payment, then one big dividend annually. Frequency aside though, a basket of international bonds began to offer better yields than a US bond basket in 2019. Then, BNDX failed to make that big interest payment at the end of 2020 and its yield suffered, but only temporarily—BNDX made its largest interest payment to-date at the end of 2021. Despite quickly rising rates in the US, international fixed income may be worth your consideration.
Download Visual | Modify in YCharts
Most Popular Econ Data Pages
These economic data pages had the most unique pageviews in March 2022.
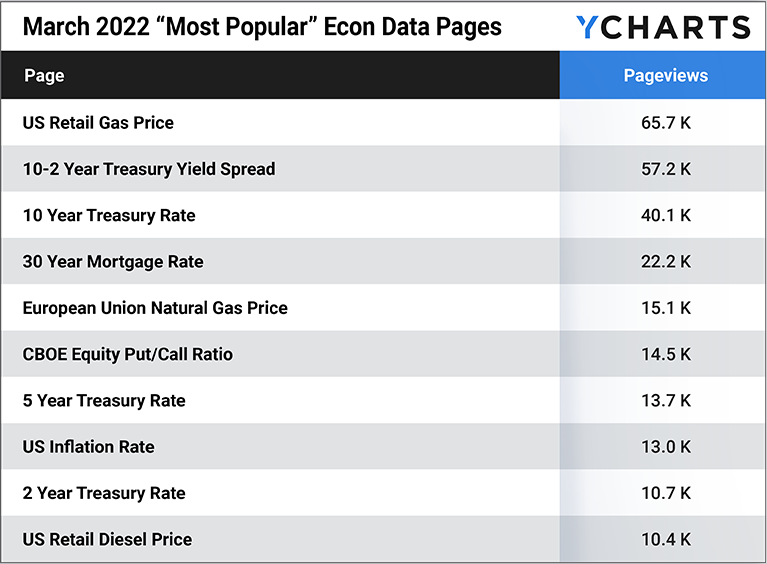
• 10-2 Year Treasury Yield Spread
• European Union Natural Gas Price
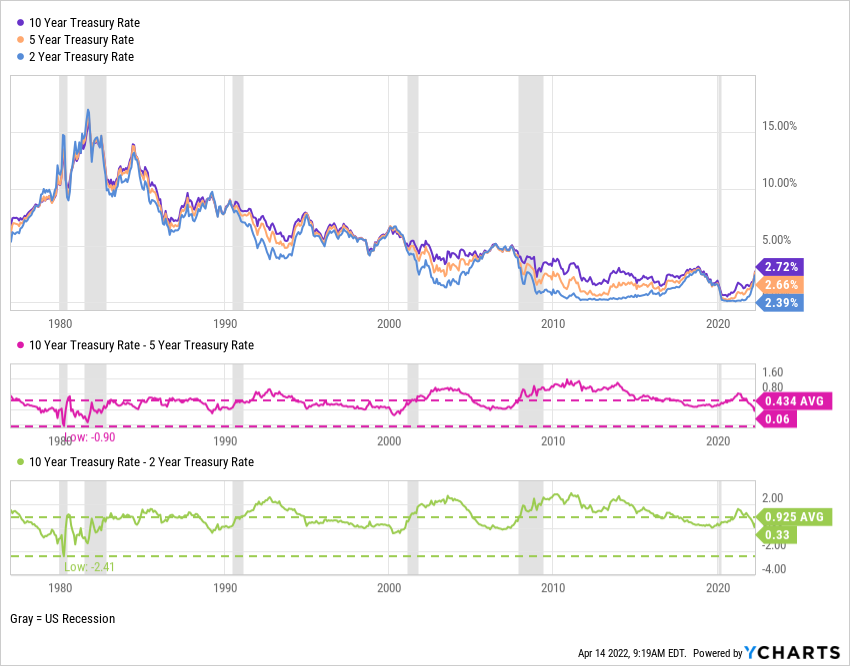
This very long-term view of interest rates, with US economic recessions shaded in gray, shows the significant interest rate compression that has occurred over the last 40 years.
While the 10 Year, 5 Year, and 2 Year Treasury Rates are on the rise, expectations of uncertainty for the US economy have caused another inversion in the yield curve. At the beginning of April, the 10-2 Year Treasury Yield Spread briefly inverted, as did the 10-5 year spread, and many who follow the indicator raised the recessionary alarm. Historically speaking, inversions on the yield curve (and especially the 10-2 spread) have been a harbinger of slowed economic growth.
Download Visual | Modify in YCharts
Connect with YCharts
To learn more, call us at (773) 231-5986, or email hello@ycharts.com.
Want to add YCharts to your technology stack? Sign up for a 7-Day Free Trial to see YCharts for yourself.
Disclaimer
©2022 YCharts, Inc. All Rights Reserved. YCharts, Inc. (“YCharts”) is not registered with the U.S. Securities and Exchange Commission (or with the securities regulatory authority or body of any state or any other jurisdiction) as an investment adviser, broker-dealer or in any other capacity, and does not purport to provide investment advice or make investment recommendations. This report has been generated through application of the analytical tools and data provided through ycharts.com and is intended solely to assist you or your investment or other adviser(s) in conducting investment research. You should not construe this report as an offer to buy or sell, as a solicitation of an offer to buy or sell, or as a recommendation to buy, sell, hold or trade, any security or other financial instrument. For further information regarding your use of this report, please go to: ycharts.com/about/disclosure.
Next Article
Recession Forecasting with Michael GayedRead More →