Economic Update: Reviewing Q1 2025
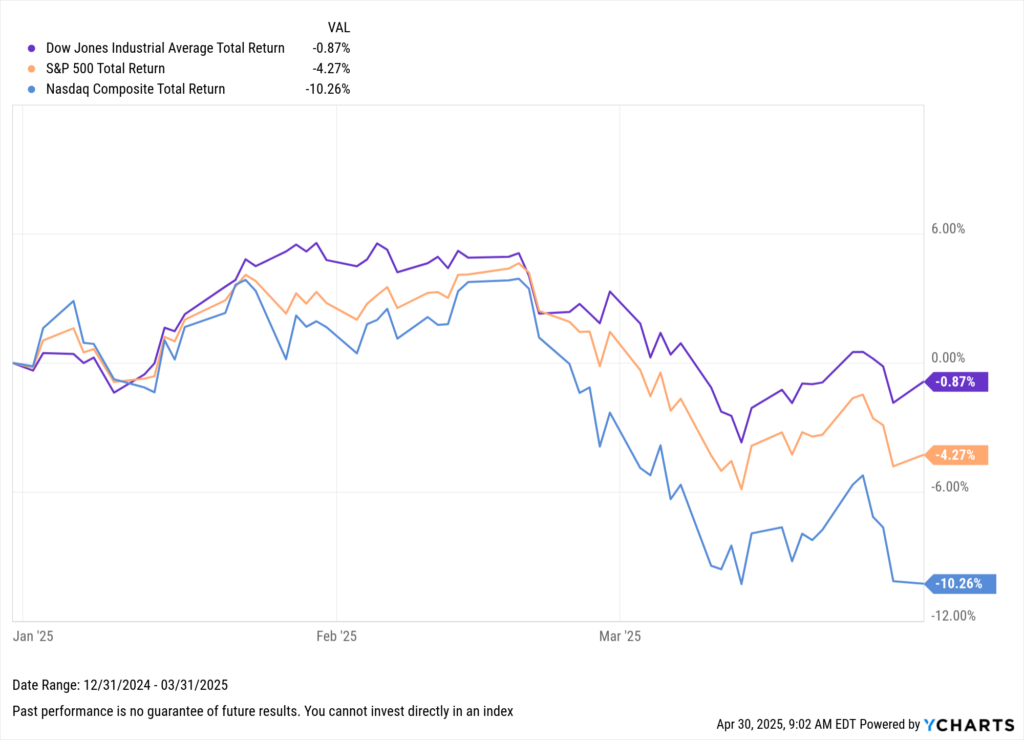
Below is a sneak peek of insights from the YCharts Q1 2025 Economic Summary Deck. U.S. equities faced a challenging start to the year, with all three major indices posting negative returns in Q1. The Nasdaq led the decline, weighed down by sharp losses among mega-cap tech stocks. International markets told a more optimistic story, offering a bright spot for globally diversified investors.
The deck, published quarterly, provides advisors with key insights from the prior quarter to spark more informed client conversations, support smarter investment decisions, and drive organic growth.
Download the Economic Summary Deck:Market and Asset Class Update
In Q1 2025, U.S. equity markets broadly declined. The Dow Jones Industrial Average was the most resilient, ending the quarter nearly flat, down just 0.9%. The S&P 500 fell 4.3%, while the Nasdaq Composite experienced the steepest drop, declining by 10.3% amid continued volatility in growth and tech stocks.
Download Visual | Modify in YCharts
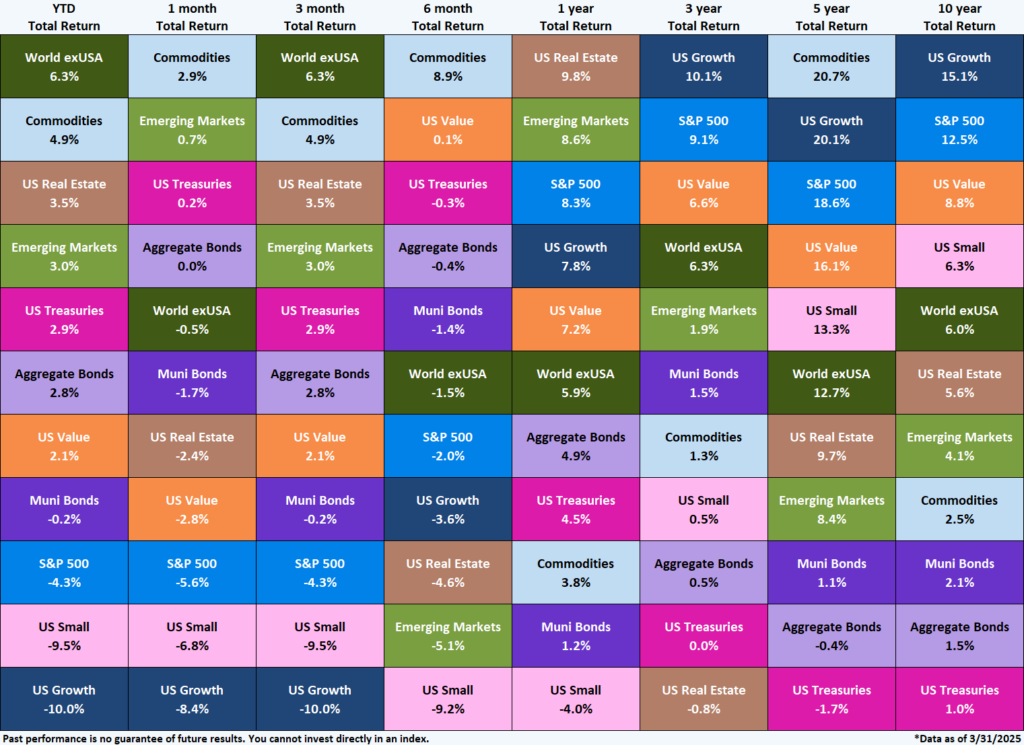
International equities led the way, with World ex-USA returning 6.3% for the quarter and topping the asset class leaderboard. Commodities followed closely with a 4.9% return, while U.S. Real Estate (3.5%) and Emerging Markets (3%) also posted positive gains. U.S. Growth stocks fell sharply, down 10%, ranking as the worst-performing asset class for the quarter.
Download Visual| Contact Us to Access This Quilt
Aggregate Bonds posted a 2.8% gain, outperforming U.S. stocks, offering stability amid equity market volatility. For 60/40 investors, its positive performance in Q1 helped cushion equity losses and underscored the value of diversification, especially when equity leadership breaks down.
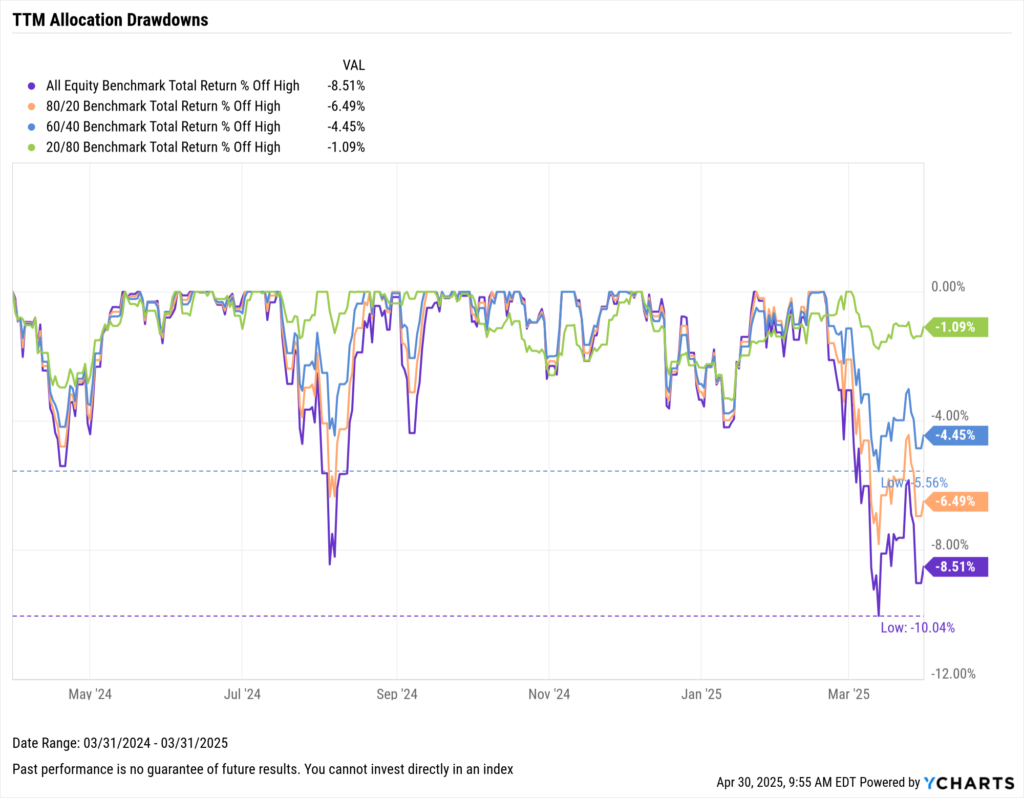
This cushioning effect is clearly illustrated in Q1’s drawdown data: an all-equity portfolio fell as much as -10% from its recent peak, a 60/40 allocation declined just 5.6%, and a conservative 20/80 portfolio’s max drawdown over the previous 12 months was only 3.4%.
Download Visual | Modify in YCharts
Unlike in 2022, when rising rates battered both stocks and bonds, the current environment saw investors rotate into fixed income strategies, taking advantage of decade-high yields and attractive “carry,” or the yield earned from holding a bond over time, which can offset price declines and contribute positively to total return.
As a result, diversified investors were better protected from downside pressure and experienced a far smoother ride through Q1’s volatility.
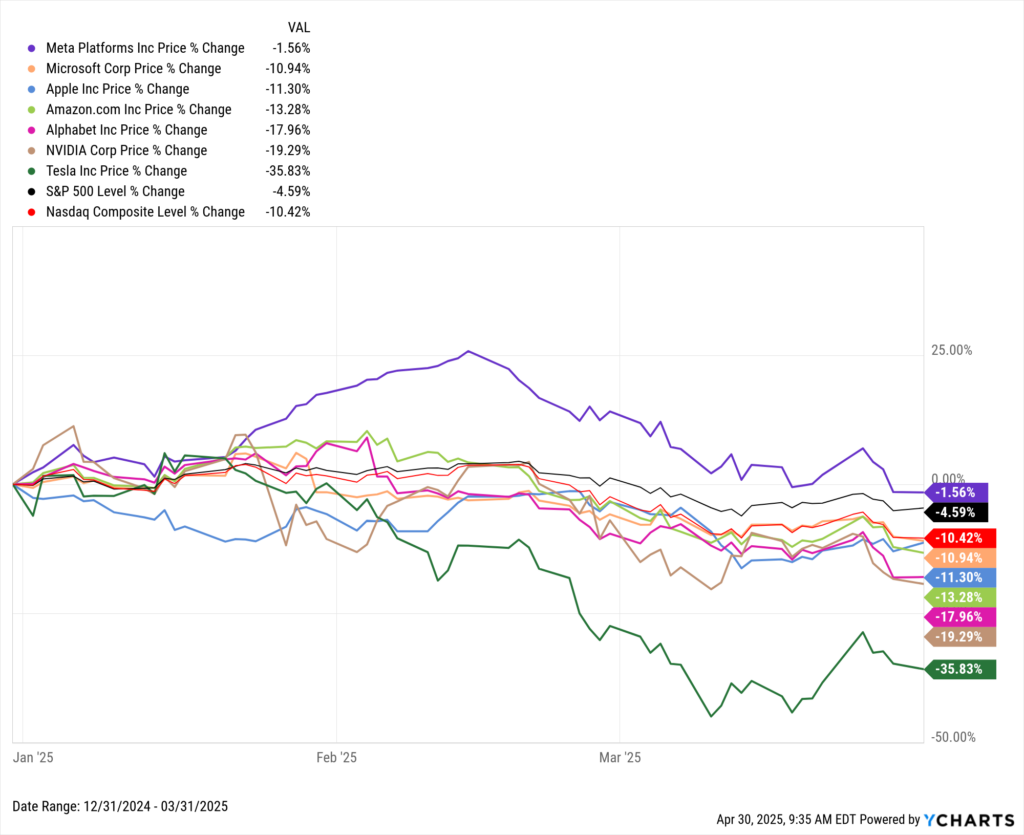
How the Mag Seven Have Fallen
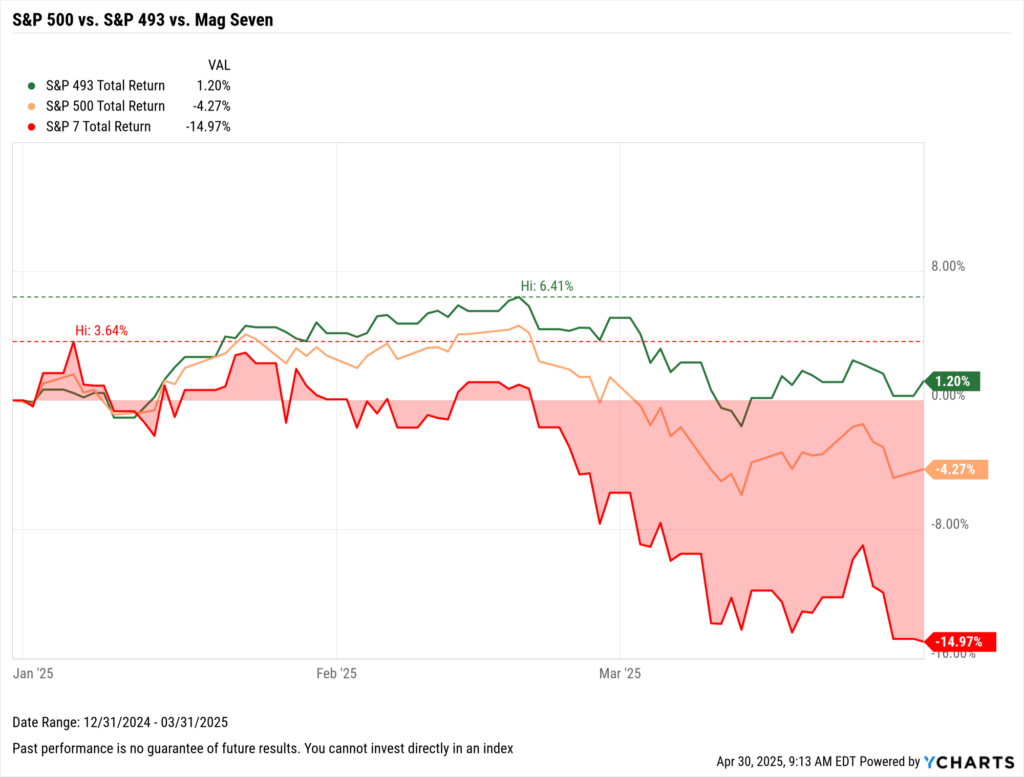
In Q1 2025, the headline S&P 500 declined by 4.3% (including dividends reinvested), but that figure masks a major divergence under the surface. The S&P 493 (the index excluding the seven tech names) actually rose by 1.2%. Meanwhile, the so-called “Magnificent Seven” tumbled a collective 15%, dragging down the broader index.
Download Visual | Modify in YCharts
This reversal follows their sky-high 46.3% return in 2024, vastly outpacing the 13.4% gain from the rest of the index. As noted last quarter, concerns about an “Icarus moment” for these dominant names were growing, and Q1’s drawdown may have validated those fears.
Tesla (-35.8%), NVIDIA (-19.3%), and Alphabet (-18%) led the declines, with most other mega-caps also posting double-digit losses.
Download Visual | Modify in YCharts
The top 10 holdings now make up over a third of the S&P 500 and nearly 50% of the Nasdaq-100, intensifying the downside impact of these high-flyers. Advisors must continue to emphasize the importance of diversification—not only across asset classes but within equity sleeves—as concentration risk remains top of mind.
For a comprehensive overview and deeper insights into macroeconomic indicators, download the Q1 2025 Economic Summary Deck. This valuable resource supports your marketing and client engagement efforts, helping you spark conversations, fill the top of your funnel, and drive organic growth. To get a white-labeled version of this deck, reach out to your account representative.
Whenever you’re ready, there are 3 ways YCharts can help you:
1. Looking to better communicate the importance of economic events to clients?
Send us an email at hello@ycharts.com or call (866) 965-7552. You’ll be directly in touch with one of our Chicago-based team members.
2. Want to test out YCharts for free?
Start a no-risk 7-Day Free Trial.
3. Download a copy of the Quarterly Economic Update slide deck:
Download the Economic Summary Deck:Disclaimer
©2025 YCharts, Inc. All Rights Reserved. YCharts, Inc. (“YCharts”) is not registered with the U.S. Securities and Exchange Commission (or with the securities regulatory authority or body of any state or any other jurisdiction) as an investment adviser, broker-dealer or in any other capacity, and does not purport to provide investment advice or make investment recommendations. This report has been generated through application of the analytical tools and data provided through ycharts.com and is intended solely to assist you or your investment or other adviser(s) in conducting investment research. You should not construe this report as an offer to buy or sell, as a solicitation of an offer to buy or sell, or as a recommendation to buy, sell, hold or trade, any security or other financial instrument. For further information regarding your use of this report, please go to: ycharts.com/about/disclosure
Next Article
Q1 2025 Materials Sector Earnings: Key Highlights & Market ReactionsRead More →