Economic Update: Reviewing Q4 2024

Below is a sneak peek of insights from the YCharts Q4 2024 Economic Summary Deck. This quarter saw mixed performance in U.S. equities, with the Nasdaq leading gains while international markets struggled. Meanwhile, sector rotation and individual stock performances highlighted key market shifts.
The deck, published quarterly, provides advisors and investors with key insights from the previous quarter to help you make smarter investment decisions going forward.
Market and Asset Class Update
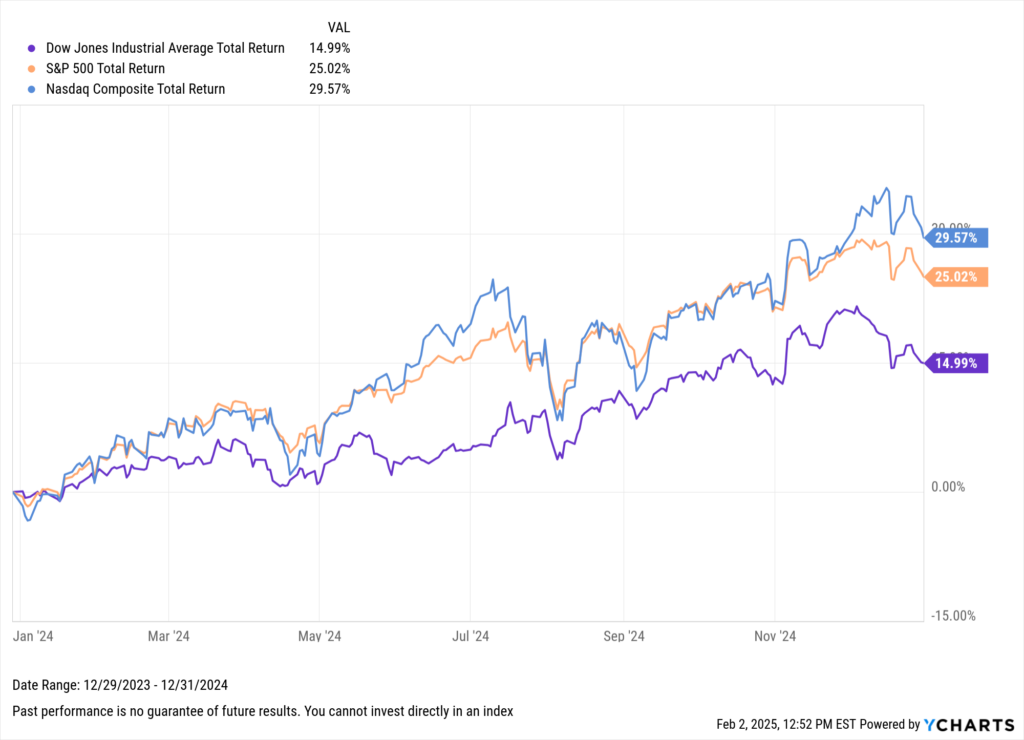
In Q4 2024, the major U.S. markets exhibited mixed performance. The Nasdaq Composite led with a 6.4% total return, outpacing the S&P 500, which posted a modest 2.4% gain. Meanwhile, the Dow Jones Industrial Average lagged, achieving a return of just 0.9% for the quarter.
For the full year, the Nasdaq also topped the other two indices with a 29.6% return. The S&P 500 followed with a substantial 25% gain, and the Dow managed a respectable 15% increase.
Download Visual | Modify in YCharts
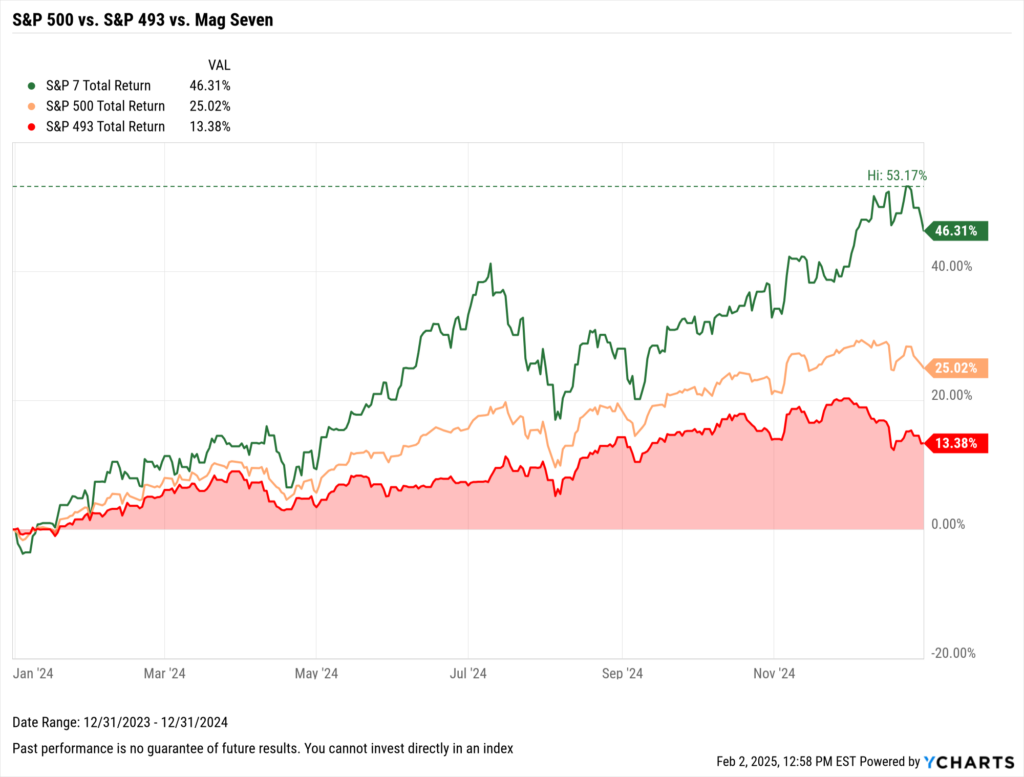
Amid consecutive years of robust performance from major indices, some investors are developing Icarus-like concerns about their equity investments. These apprehensions are intensified by the significant influence of the “Magnificent Seven” stocks on these indices. For instance, the Magnificent Seven delivered 46.3% returns this year, starkly contrasting the 13.4% returns from the remaining 493 companies in the S&P 500.
Download Visual | Modify in YCharts | Get in Touch to Access Chart
While some may argue that the concentration of gains is a characteristic of a bull market, advisors must continue addressing client worries about single-stock concentration risks. This includes assisting employees from companies like Nvidia and other tech giants in managing their Employee Stock Purchase Plan (ESPP) and unique stock options, as Josh Brown and Ritholtz Wealth Management laid out.
Additionally, advisors must address concerns about the increasing concentration of passive investments in these seven stocks. In this context, advisors must advocate for the benefits of diversification, both within equity portfolios and across various asset classes.
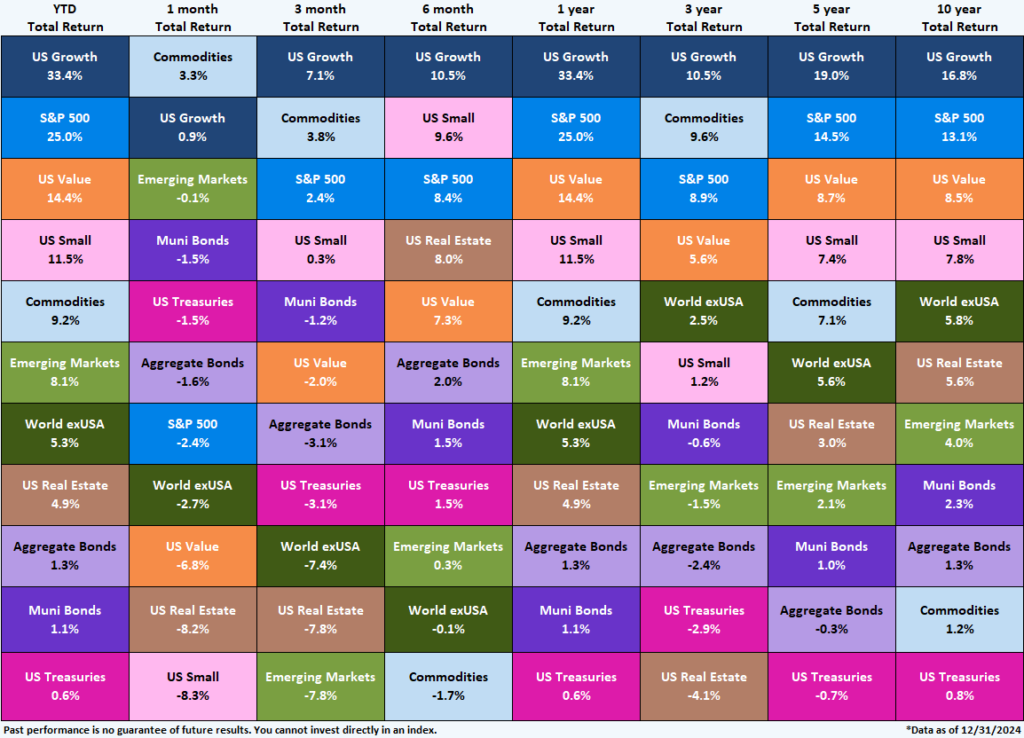
In 2024, U.S. Growth stocks outperformed all other asset classes but were not the sole source of positive returns, as all observed asset classes posted gains for the year. U.S. Value stocks notably provided a 14.4% return, surpassing the asset class’s annualized returns over the past 3, 5, and 10 years. Similar trends occurred in U.S. Small Caps, Commodities, and Emerging Markets, which also outperformed their long-term annualized returns.
Download Visual | Contact Us to Access This Quilt
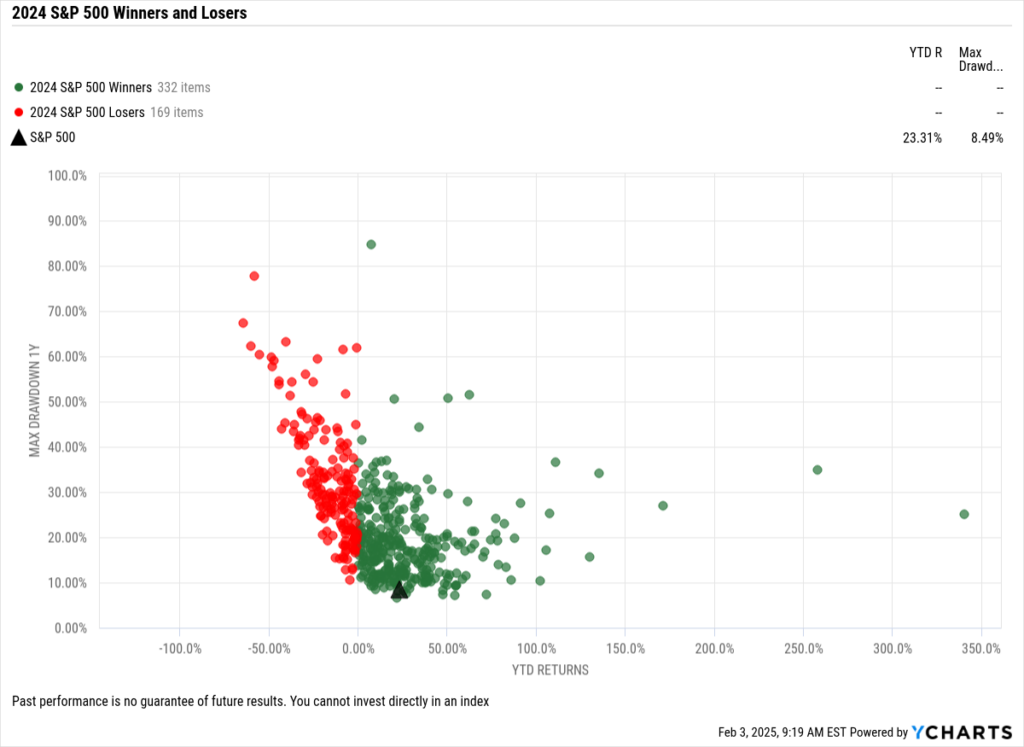
2024 S&P 500 Winners & Losers
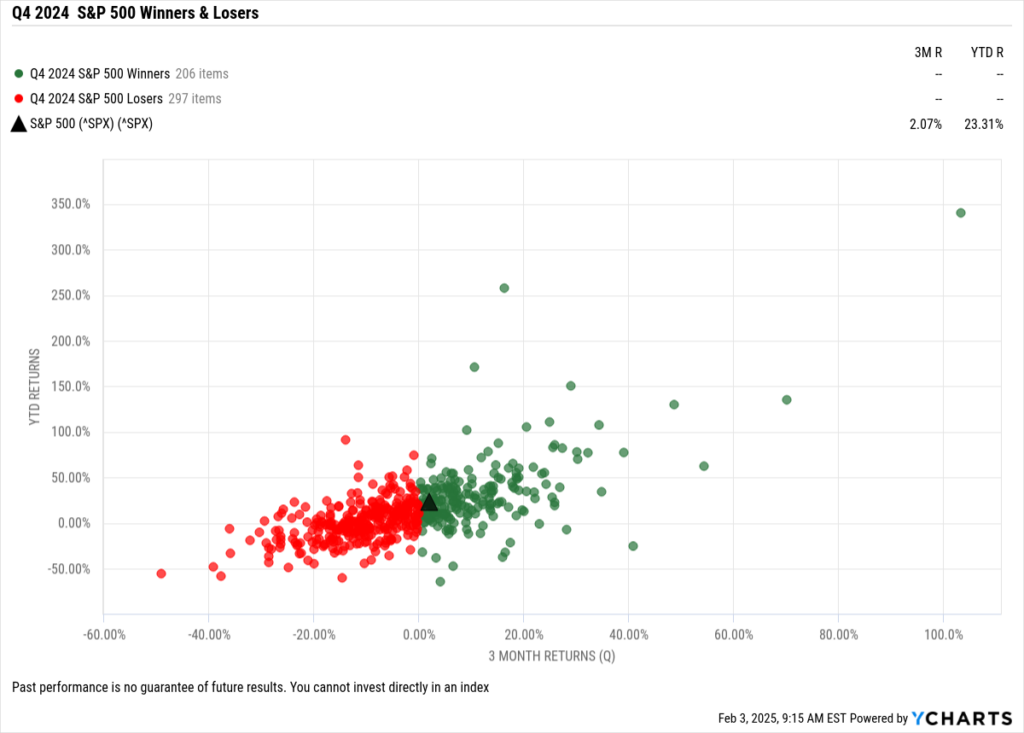
A microscopic look at the S&P 500’s performance in Q4 reveals that 297 constituents, or 59% of the index, posted negative returns. The biggest loser was Celanese Corp (CE) which plummeted 49.1% in Q4. Palantir Technologies (PLTR) was the S&P 500’s biggest winner in Q4, surging 103.3% in the quarter.
Download Visual | Modify in YCharts
In 2024, the S&P 500 saw a majority of its constituents deliver positive returns, with 332 companies (or 66% of the index) ending the year in the green. Among these, PLTR emerged as the standout performer, recording a 340.5% surge in its stock price over the course of the year.
Download Visual | Modify in YCharts
For a more comprehensive breakdown of the top performers and laggards across other major indices, including the Dow Jones Industrial Average, Nasdaq Composite, Russell 1000, and Russell 2000, readers can refer to “The Best Performing Stocks of 2024” blog. This post offers a deeper dive into the individual stocks and sectors that drove market performance throughout the year, providing valuable insights for investors and market analysts alike.
As we wrap up our review of Q4 2024, it’s clear that market performance was varied, with the Nasdaq leading gains among major indices and U.S. Growth stocks dominating across asset classes. Despite challenges in international markets and sector fluctuations, opportunities for substantial returns persisted, particularly in U.S. Value stocks, Small Caps, Commodities, and Emerging Markets.
For a comprehensive overview and deeper insights into macroeconomic indicators, download the Q4 2024 Economic Summary Deck. This valuable resource can help you navigate the complexities of the market and make more informed investment decisions. To get a white-labeled version of this deck, reach out to your account representative.
Whenever you’re ready, there are 3 ways YCharts can help you:
1. Looking to better communicate the importance of economic events to clients?
Send us an email at hello@ycharts.com or call (866) 965-7552. You’ll be directly in touch with one of our Chicago-based team members.
2. Want to test out YCharts for free?
Start a no-risk 7-Day Free Trial.
3. Download a copy of the Quarterly Economic Update slide deck:
Download the Economic Summary Deck:Disclaimer
©2025 YCharts, Inc. All Rights Reserved. YCharts, Inc. (“YCharts”) is not registered with the U.S. Securities and Exchange Commission (or with the securities regulatory authority or body of any state or any other jurisdiction) as an investment adviser, broker-dealer or in any other capacity, and does not purport to provide investment advice or make investment recommendations. This report has been generated through application of the analytical tools and data provided through ycharts.com and is intended solely to assist you or your investment or other adviser(s) in conducting investment research. You should not construe this report as an offer to buy or sell, as a solicitation of an offer to buy or sell, or as a recommendation to buy, sell, hold or trade, any security or other financial instrument. For further information regarding your use of this report, please go to: ycharts.com/about/disclosure
Next Article
Is Growth and Value Investing Mutually Exclusive?Read More →