Is Growth and Value Investing Mutually Exclusive?
Introduction: The Growth vs. Value Debate
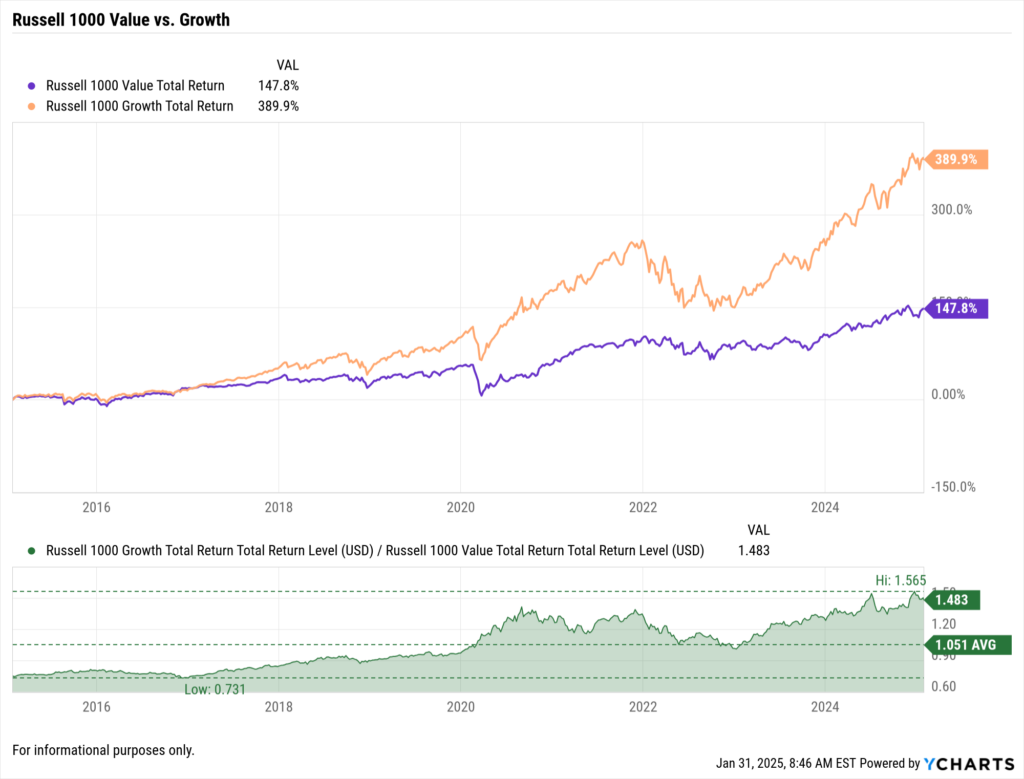
For decades, growth and value investing have been considered distinct strategies within the investment landscape. Growth stocks are expected to outperform the market by expanding revenue and earnings faster than average, while value stocks are perceived as underpriced relative to their fundamentals, often with higher dividend yields and lower valuation multiples.
Many financial advisors and asset managers construct portfolios based on this segmentation, believing that combining both strategies results in a well-balanced investment approach. However, when analyzing two of the most popular ETFs representing these styles—the SPDR Portfolio S&P 500 Growth ETF (SPYG) and the SPDR Portfolio S&P 500 Value ETF (SPYV)—a surprising degree of holdings overlap emerges.
This overlap raises a critical question for portfolio managers and financial professionals: Are growth and value truly distinct categories, or do today’s markets blur the line between these investment styles?
This blog explores the composition of SPYG and SPYV, highlights key holdings that appear in both funds, and discusses best practices for evaluating ETF overlap using YCharts.
Holdings Overlap Between SPYG and SPYV
While SPYG and SPYV aim to track different segments of the S&P 500, their holdings reveal that several stocks are classified as both growth and value.
Top Holdings as of January 29, 2025:
| Company | SPYG Weight | SPYV Weight |
|---|---|---|
| Apple Inc. (AAPL) | 6.29% | 7.89% |
| Microsoft Corp. (MSFT) | 6.47% | 6.38% |
| Amazon.com Inc. (AMZN) | 4.87% | 3.76% |
This overlap challenges the assumption that growth and value investing are completely independent. Companies like Apple and Microsoft exhibit characteristics of both styles, leading them to be included in both ETFs.
For financial advisors and asset managers, this has significant portfolio construction implications. Investors looking to diversify between growth and value may be unknowingly increasing concentration risk by holding both funds.
Why This Matters for Advisors and Asset Managers
Understanding holdings overlap is essential when constructing portfolios for clients. Here are key reasons why this is especially important for financial professionals:
1. Hidden Over-concentration in Key Names
Many investors allocate funds into multiple ETFs, assuming they are achieving diversification. However, significant overlap between SPYG and SPYV can lead to excessive exposure to a handful of large-cap stocks, reducing the intended diversification benefits.
For instance, if an advisor constructs a 50/50 portfolio using SPYG and SPYV, a disproportionate allocation to top holdings like Apple, Microsoft, and Amazon may occur, skewing the portfolio’s risk profile.
2. Assessing Style Drift in Growth and Value Strategies
Traditional value stocks were characterized by low price-to-earnings (P/E) ratios, strong balance sheets, and reliable dividends. However, in today’s market, several high-growth technology stocks have begun appearing in value portfolios due to their strong cash flows and lower relative valuations.
This style drift means that growth and value strategies may not be as different as they once were, requiring portfolio managers to reassess how they categorize asset allocations.
3. Managing Factor Exposures and Risk
For asset managers incorporating factor investing into client portfolios, an unintended overweight in a few mega-cap stocks can result in concentrated exposure to a specific factor—such as momentum or large-cap growth—even within a supposedly diversified strategy.
By analyzing ETF holdings overlap, advisors can fine-tune allocations and ensure proper factor diversification across different market conditions.
Apple’s Dual Role in Growth and Value Investing
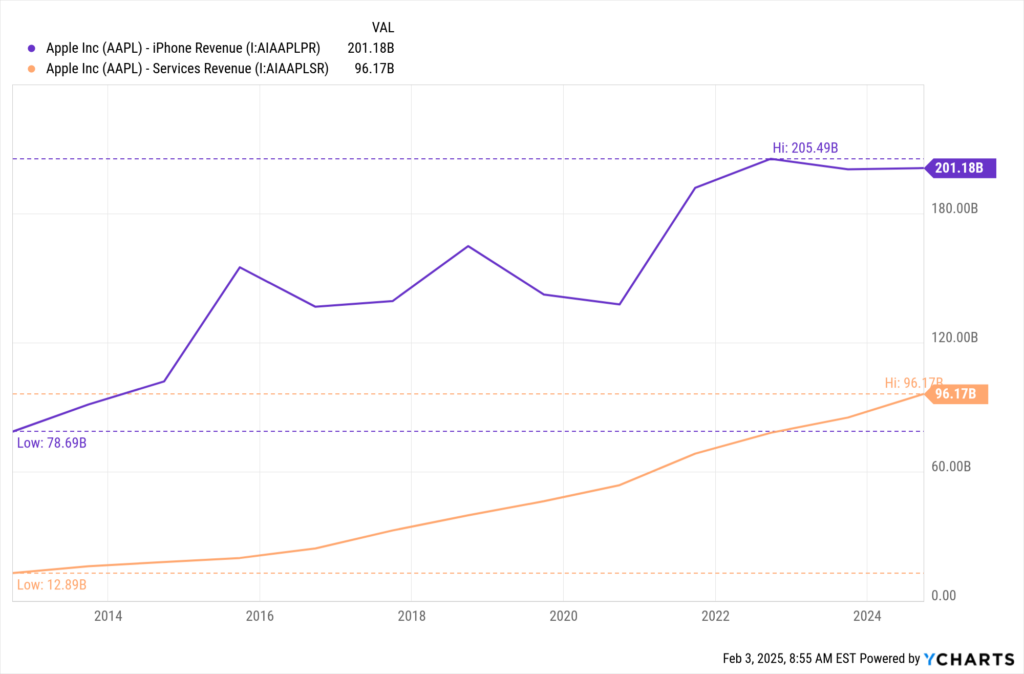
Apple Inc. (AAPL) is a prime example of a stock that defies traditional growth vs. value classifications. As shown in the chart below, Apple’s revenue sources illustrate its evolution:
Key Insights from Apple’s Revenue Growth:
iPhone Revenue Growth is Slowing – The core driver of Apple’s business remains stable but is growing at a slower rate, reflecting its status as a mature cash-generating asset (value characteristics).
Services Revenue and Wearables Expansion – Apple’s services segment, including subscriptions like Apple Music, iCloud, and the App Store, has become a major growth driver, contributing to steady recurring revenue. Additionally, newer hardware segments such as the Apple Watch and AirPods have seen significant percentage-based growth, further reinforcing Apple’s dual status as both a value and growth stock.
Market Implications:
Apple’s Unique Classification: AAPL’s strong balance sheet, dividends, and established market position align with value investing. However, its innovation and expansion into new revenue verticals continue to make it a top growth stock.
Growth vs. Value Labeling is Dynamic: Investors relying solely on ETF labels may miss important shifts in company fundamentals over time.
Implications for Portfolio Strategy: Financial advisors must look beyond ETF classifications and evaluate holdings on a fundamental level to avoid unintended portfolio concentration.
S&P 500 Earnings Growth vs. Market Performance
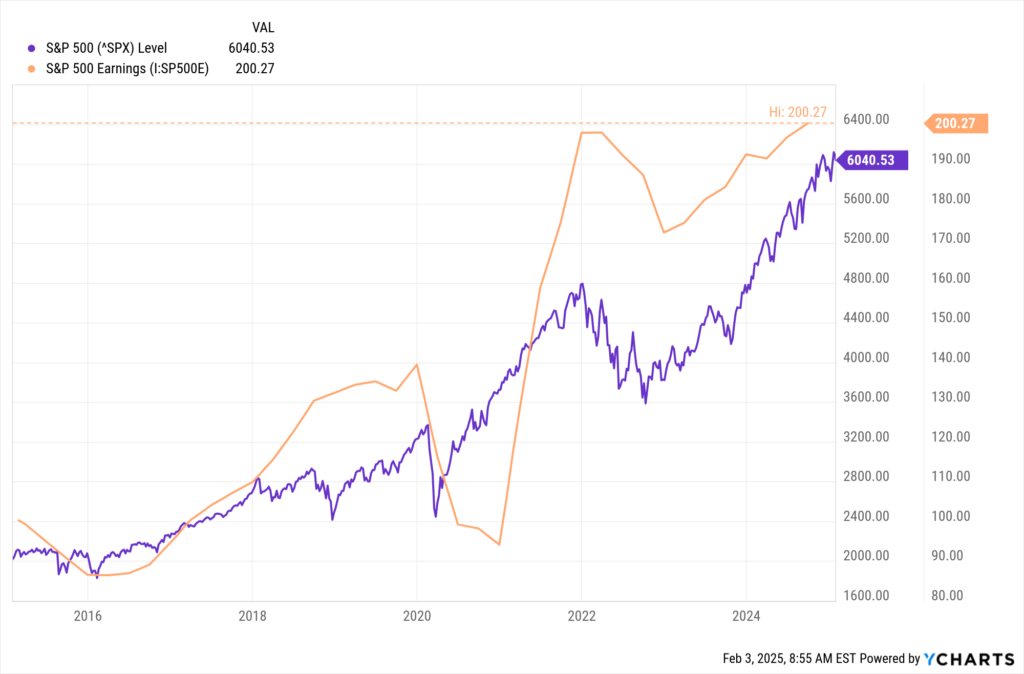
The relationship between stock market performance and earnings growth provides further context to the blurring lines between growth and value investing. The chart below illustrates the trajectory of the S&P 500 index alongside the aggregate earnings of its constituents.
Key Takeaways from the Chart:
Earnings Growth vs. Market Growth – While the S&P 500 index has climbed significantly, corporate earnings growth has followed an uneven trajectory, with notable dips and rebounds.
Valuation Considerations – The divergence between price levels and earnings suggests that valuation multiples may be driving market performance rather than pure earnings expansion.
Implications for Growth & Value Stocks – Many companies within SPYG and SPYV see shifts in classification over time. As earnings grow and valuations contract, previously “growth-oriented” names like Apple and Microsoft begin to take on value characteristics.
For financial professionals, understanding earnings growth trends is crucial when evaluating ETF allocations. Investors should ensure that exposure to growth and value styles reflects fundamental performance rather than relying solely on ETF classifications.
How to Analyze ETF Holdings Overlap with YCharts
YCharts provides a Holdings Overlap Tool that enables financial professionals to compare up to 12 funds, ETFs, or portfolios to uncover shared exposures and concentration risks.
Key Features of the YCharts Holdings Overlap Tool
- Side-by-Side Fund Comparisons – Analyze SPYG, SPYV, and other ETFs simultaneously.
- Shared Holdings Analysis – Identify overlapping positions and their portfolio weightings.
- Stock Exposure Screening – Filter funds to minimize single-stock concentration risks.
Custom Reports for Clients – Generate client-ready visuals showcasing ETF composition and diversification.
Example Use Case: Optimizing Client Portfolios
Imagine an advisor managing a portfolio that includes both SPYG and SPYV, assuming the client has a diversified approach. By using YCharts’ Holdings Overlap Tool, the advisor can quickly quantify the overlap between these funds and determine whether additional diversification is needed.
Instead of manually reviewing fund fact sheets, YCharts automates this process, allowing advisors to focus on portfolio optimization and client communication.
Conclusion: Are Growth and Value Truly Separate Strategies?
The SPYG and SPYV holdings overlap challenges the conventional belief that growth and value investing are mutually exclusive. In reality, certain large-cap stocks—such as Apple, Microsoft, and Amazon—straddle both categories, leading to significant holdings duplication between ETFs that are designed to track separate investment styles.
For financial professionals, this overlap underscores the importance of thorough portfolio analysis to prevent unintended overconcentration and ensure that clients’ asset allocations align with their risk tolerance and investment objectives.
By leveraging YCharts’ powerful Holdings Overlap Tool, advisors can analyze fund exposures in detail, identify overlap risks, and construct well-diversified portfolios tailored to client needs.
Whenever you’re ready, there are 3 ways YCharts can help you:
1. Looking for a tool to help you better communicate market events?
Send us an email at hello@ycharts.com or call (866) 965-7552. You’ll be directly in touch with one of our Chicago-based team members.
2. Want to test out YCharts for free?
Start a no-risk 7-Day Free Trial.
3. Download a copy of the Monthly Market Wrap slide deck:
Disclaimer
©2025 YCharts, Inc. All Rights Reserved. YCharts, Inc. (“YCharts”) is not registered with the U.S. Securities and Exchange Commission (or with the securities regulatory authority or body of any state or any other jurisdiction) as an investment adviser, broker-dealer or in any other capacity, and does not purport to provide investment advice or make investment recommendations. This report has been generated through application of the analytical tools and data provided through ycharts.com and is intended solely to assist you or your investment or other adviser(s) in conducting investment research. You should not construe this report as an offer to buy or sell, as a solicitation of an offer to buy or sell, or as a recommendation to buy, sell, hold or trade, any security or other financial instrument. For further information regarding your use of this report, please go to: ycharts.com/about/disclosure
Next Article
Pre-Built Report Templates with YCharts: A Beginner’s GuideRead More →