Economic Update — Reviewing Q2 2022
The bear officially came out of hibernation in the second quarter of 2022.
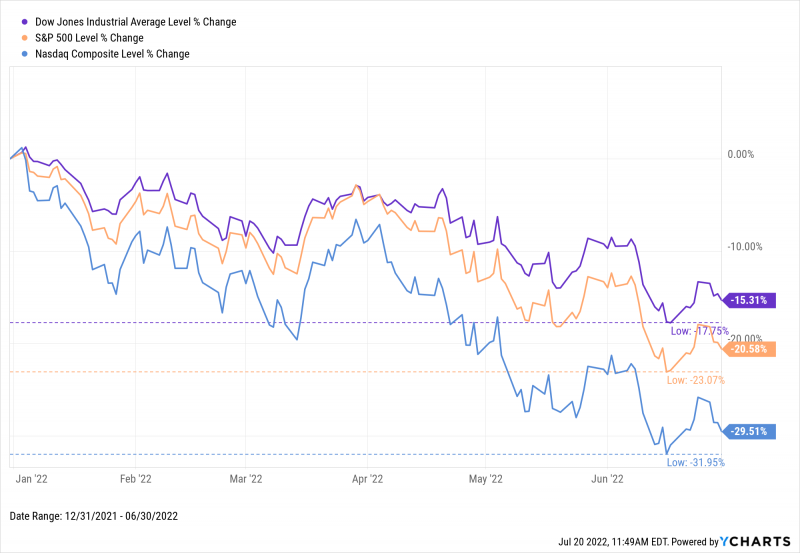
Adding to a down Q1, all three major US indices fell by double-digit percentage points in Q2. The Dow ended the second quarter of 2022 10.8% lower, the S&P 500 was off 16.1%, and the NASDAQ posted a bear market performance in Q2 alone, down 22.3%.
Both the S&P 500 and NASDAQ closed out the first half of the year in bear market territory, while the Dow was down 15.3%.
Download Visual | Modify in YCharts
Also as of June 30th, 2022, the CBOE S&P 500 Volatility Index clocked in at 28.71. This reading of the “fear index” was nearly 50% higher than its long-term average of 19.58 dating back to 1990.
So far in 2022, few charts have gone up-and-to-the-right. In our collection of Highlights, Lowlights, and Insights of 1H 2022, we pointed out that the first half of 2022 marked the S&P 500’s third worst start on record. In fact, 78% of all S&P 500 constituents were in the red through the first two quarters in 2022.
Among the charts that have risen are ones the average person would find unfavorable. US Inflation and US Core Inflation alike have surged to 40-year highs, while Mortgage Rates as of the end of Q2 have spiked to levels last seen around the Great Financial Crisis. In turbulent times like these, it’s critical to stay atop sudden and perhaps shocking market movements.
Below is a sneak peek of insights from the YCharts Q2 2022 Economic Summary Deck. The deck, published quarterly, arms advisors and investors with key insights from the previous quarter to help you make smarter investment decisions going forward. The deck is also easily customizable with your own firm branding to be leveraged in client communications.
Want the Economic Update slide deck sent straight to your inbox? Get it here:
Asset Class Performance
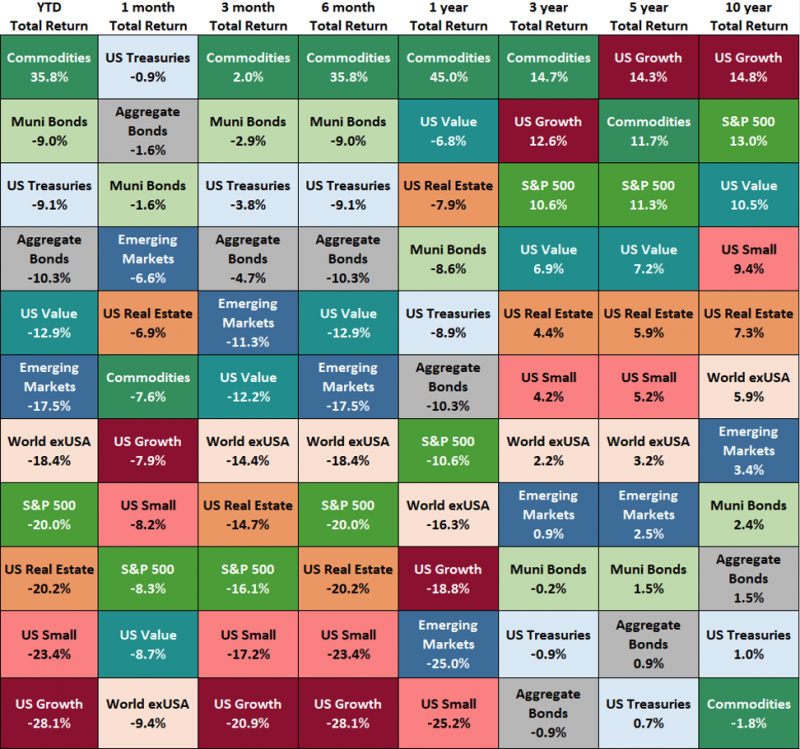
As was the case last quarter, every major asset class declined in Q2 with the exception of Commodities.
Commodities, represented by the S&P GSCI Total Return Index on the following asset performance matrix, rose 2% in Q2 after jumping 33.1% in Q1. Though prices of crude oil and retail gasoline slightly cooled off late in the quarter, they remain at historically elevated levels. The S&P GSCI was largely kept in check by its 46% weighting in non-energy components—notably, the sub-indices of grains and industrial metals. These were down 12.7% and 25.3% in Q2, respectively, and together make up over 25% of the S&P GSCI index.
Click to Download Asset Class Performance Table
Turning to domestic stocks, US Growth’s 20.9% decline put it at the bottom of the matrix for the second consecutive quarter. The Russell 2000 Small Caps index was not far behind, tumbling 17.2%. Increasing cost of capital and shrinking company growth forecasts were largely responsible for the hard hits to these cyclically-sensitive asset classes. US Value somewhat weathered the storm that Q2 brought, ending the quarter down 12.2%.
Fixed income asset classes also drifted lower in Q2 as yields continued their rapid rise and Fed rate hikes occurred at an unprecedented pace. Municipal Bonds slipped 2.9%, US Treasuries fell 3.8%, and US Aggregate Bonds were off 4.7%.
Around the globe, Emerging Markets’s 11.3% decline was the best relative performance among equity asset classes in Q2. The All World ex-USA index fell by 14.4% but topped the US-domiciled S&P 500 by 1.7 percentage points. This relative outperformance can be partially attributed to the United Kingdom’s Q2 performance. The UK posted a smaller 11.3% decline in Q2, and is ex-USA’s second-largest country weight, comprising 14.1% of the ex-USA index.
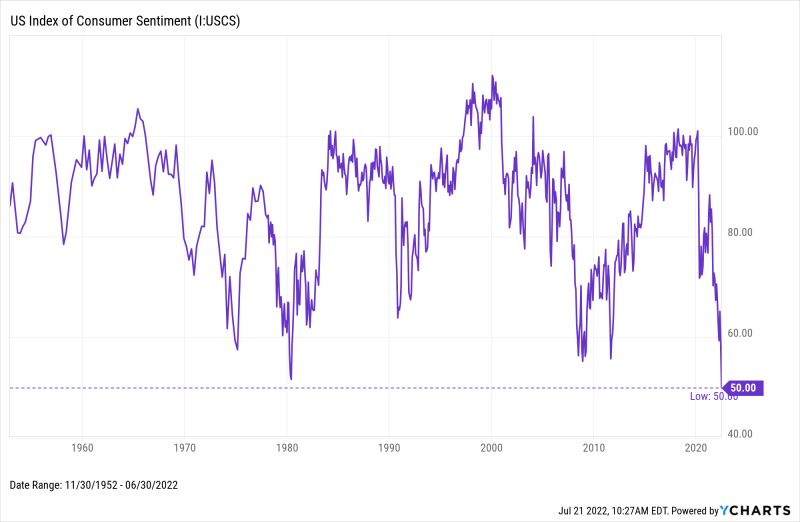
Consumer Sentiment Falls to Weakest Level in History
The US consumer has never been more pessimistic, according to the US Index of Consumer Sentiment. Published monthly by the University of Michigan since 1952, the index reached an all-time low level of 50 in June 2022. So why is the US Consumer feeling this gloomy?
Download Visual | Modify in YCharts
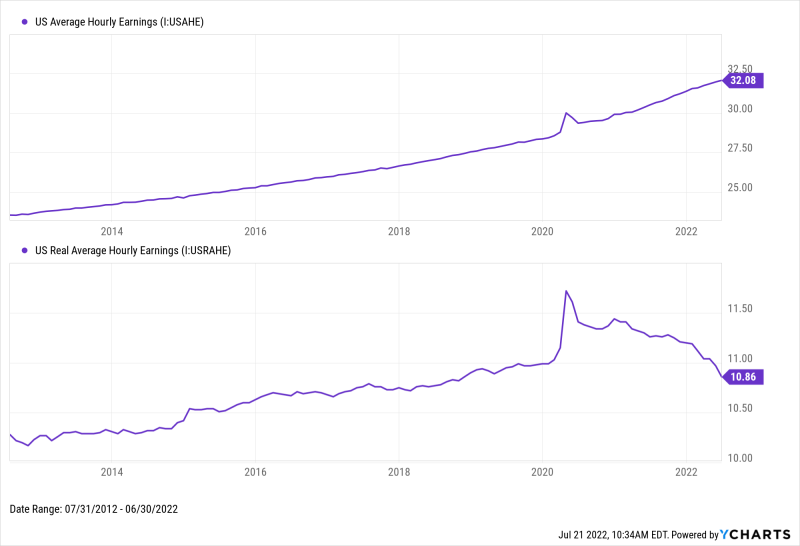
One possible explanation for the high degree of pessimism is inflation—particularly, its effect on purchasing power. June’s YoY inflation reading was 9.06%, representing the highest push in consumer prices over the last 40 years. Despite US Average Hourly Earnings rising steadily over the past ten years, US Real Average Hourly Earnings has moved in the opposite direction since April 2020. The fact that consumers are receiving higher paychecks yet have seen their average purchasing power set back to November 2018 levels may help explain the sourness in sentiment.
Download Visual | Modify in YCharts
YCharts users—download the full deck in the Support Center. Not a current client? Reach out to get access, or enter your email below to receive a free version of the deck:
Get the Economic Update slide deck sent straight to your inbox:
Connect with YCharts
To get in touch, contact YCharts via email at hello@ycharts.com or by phone at (866) 965-7552
Interested in adding YCharts to your technology stack? Sign up for a 7-Day Free Trial.
Disclaimer
©2022 YCharts, Inc. All Rights Reserved. YCharts, Inc. (“YCharts”) is not registered with the U.S. Securities and Exchange Commission (or with the securities regulatory authority or body of any state or any other jurisdiction) as an investment adviser, broker-dealer or in any other capacity, and does not purport to provide investment advice or make investment recommendations. This report has been generated through application of the analytical tools and data provided through ycharts.com and is intended solely to assist you or your investment or other adviser(s) in conducting investment research. You should not construe this report as an offer to buy or sell, as a solicitation of an offer to buy or sell, or as a recommendation to buy, sell, hold or trade, any security or other financial instrument. For further information regarding your use of this report, please go to: ycharts.com/about/disclosure