Harness Volatility & Create Opportunity
While the CBOE S&P 500 Volatility Index (VIX) has long served as a volatility yardstick for investors, often called the “fear index”, the index again stepped into the limelight in March of 2020 when it spiked to its highest level ever. With slumping stocks, rising inflation, and inverting yield curves, a looming recession and climbing VIX have investors tapping into their fight or flight instincts once again.
And while you may be tempted to take flight, there’s a case to be made for fighting through volatility.
First, a quick VIX refresher. The VIX measures the implied volatility of the S&P 500, but it isn’t calculated using the prices of the equities that make up the index. The level of the VIX is actually determined by the number of options contracts bought and sold on those underlying securities — which may indicate hedging and bearishness, but not necessarily a sell-off.
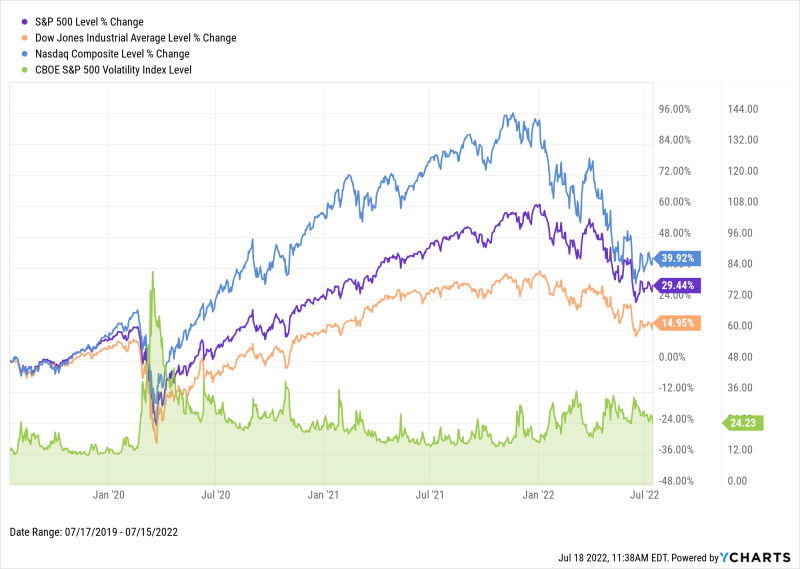
The chart below shows sluggish performance from major indices as the VIX rises in 2022. But it also shows the strong rebound following the COVID crash of 2020, illustrating that increased volatility can actually provide a buying opportunity.
Download Visual | Modify in YCharts
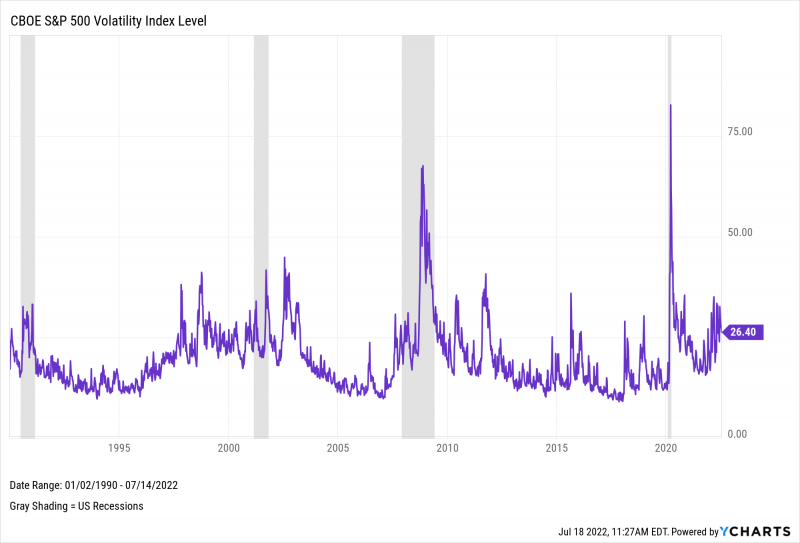
Because of record-high returns and record-low VIX levels during the market’s historic bull run from 2009-2020, investors have developed rosy expectations for both of these metrics. In reality, the VIX’s all-time average level since introduction in 1993 is 19.6; after spiking to an all-time high of 82.7 in March 2020, its average in that calendar year was 29.1. Just past the halfway mark of 2022, the VIX sits at 27.15.
Download Visual | Modify in YCharts
While current volatility is high in comparison to pre-COVID years, the VIX has calmed down considerably since its early 2020 spike. So why does it feel like the markets have never been more volatile?
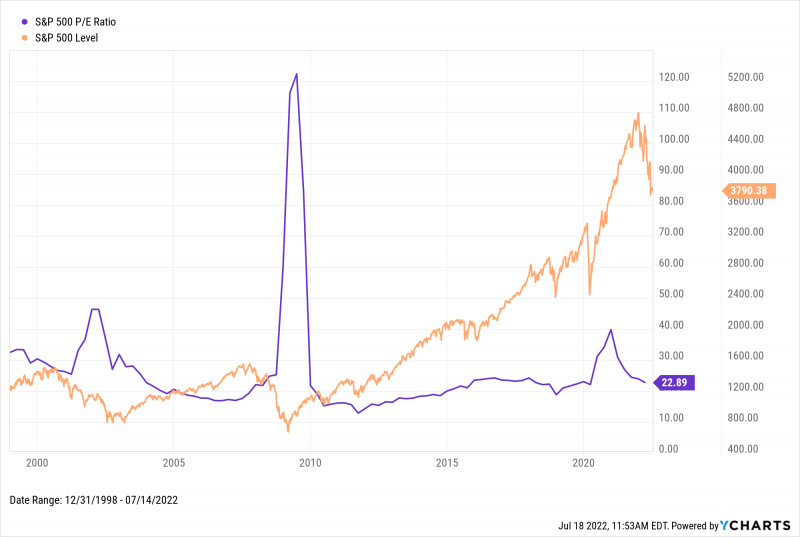
The storylines driving today’s volatility are all familiar sound bites at this point: rising interest rates are putting pressure on equities; with inflation now over 9%, the Federal Reserve all but assures more aggressive rate hikes in 2022; and lingering side-effects from COVID are hindering growth in most sectors. On the flip side, equity valuations are tapering off after spiking in the latter half of 2020.
Download Visual | Modify in YCharts
When stocks dropped to record lows in early 2020, new investors found an affordable entry into the market, in part driving a quick rebound. Is it possible that 2022 losses are being accelerated by the same forces?
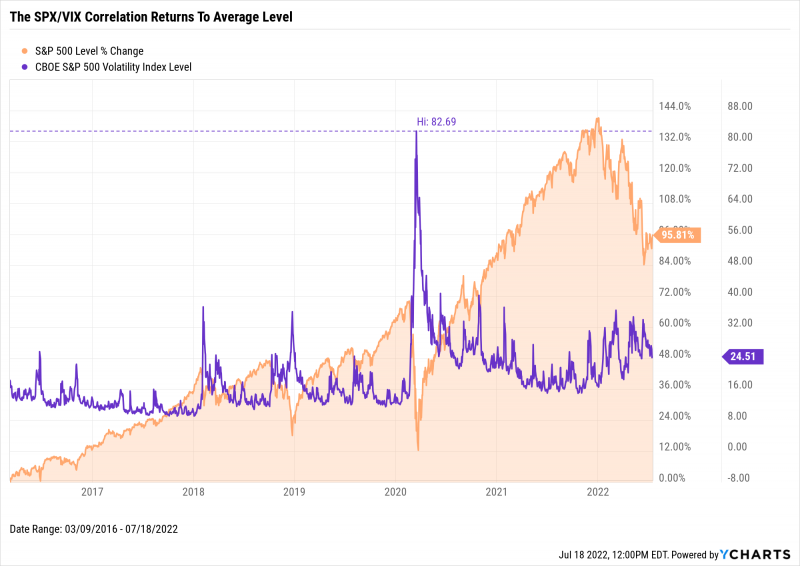
The chart below shows five years of the bull market leading into the COVID crash, and the VIX’s increased oscillation post-COVID. While there’s a clear correlation between market slumps and VIX spikes, watch for the VIX to start receding—stocks may turn a corner.
Download Visual | Modify in YCharts
So what does all this mean for advisors and their clients?
By changing your perspective on volatility, you may see a rising VIX as an opportunity to dive deep on equities and identify those with solid fundamentals that have fallen out of favor. With investors actively taking opposite positions on any single equity — a rare occurrence in the last 10 years or so — fundamental analysis and market monitoring are as important as ever in making smart investment decisions.
There are nearly 100 VIX indices available in YCharts in addition to over 80 VIX indicators to help you stay ahead of volatility.
• Dow Jones Industrial Average VIX
• Oil VIX
Even if volatility is here to stay, it doesn’t have to be synonymous with losses. Finding the winners of 2022 amidst the rotating headlines may require a little more digging, but they’re still out there.
Connect With YCharts
To get in touch, contact YCharts via email at hello@ycharts.com or by phone at (866) 965-7552
Interested in adding YCharts to your technology stack? Sign up for a 7-Day Free Trial.
Disclaimer
©2022 YCharts, Inc. All Rights Reserved. YCharts, Inc. (“YCharts”) is not registered with the U.S. Securities and Exchange Commission (or with the securities regulatory authority or body of any state or any other jurisdiction) as an investment adviser, broker-dealer or in any other capacity, and does not purport to provide investment advice or make investment recommendations. This report has been generated through application of the analytical tools and data provided through ycharts.com and is intended solely to assist you or your investment or other adviser(s) in conducting investment research. You should not construe this report as an offer to buy or sell, as a solicitation of an offer to buy or sell, or as a recommendation to buy, sell, hold or trade, any security or other financial instrument. For further information regarding your use of this report, please go to: ycharts.com/about/disclosure
Next Article
Highlights, Lowlights and Insights from 1H 2022Read More →