Economic Update: Reviewing Q3 2023
Below is a sneak peek of insights from the YCharts Q3 2023 Economic Summary Deck. The deck, published quarterly, arms advisors and investors with key insights from the previous quarter to help you make smarter investment decisions going forward.
Download the Economic Summary Deck:Market and Asset Class Update
Stocks took a breather heading into the final quarter of the year. The Dow Jones fell 2.6% in Q3, the S&P 500 slipped 3.7%, and the NASDAQ lost 4.1%.
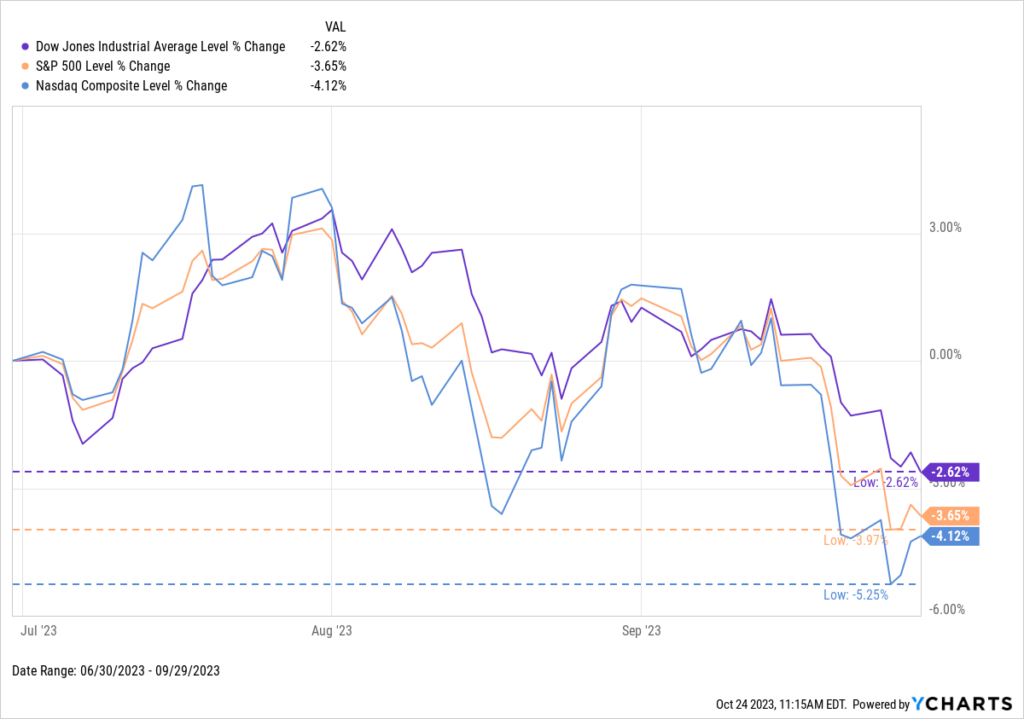
Download Visual | Modify in YCharts
Nonetheless, all three major US indices have rallied in 2023. The NASDAQ has charged higher with a 26.3% gain, the S&P has risen 11.7%, and the Dow Jones has inched up 1.1%.
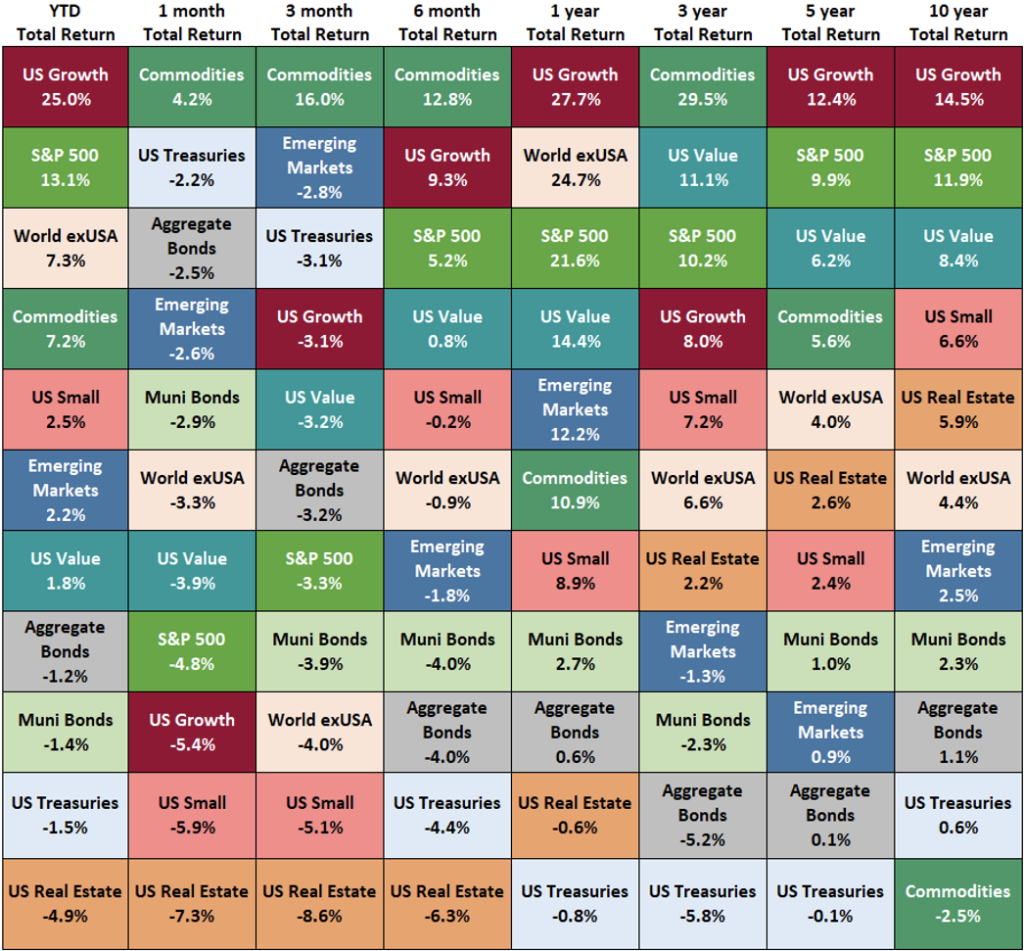
As for asset classes, US Growth and the S&P 500 remain top performers YTD despite taking 3% hits in Q3. Higher oil prices helped vault Commodities to the top spot in Q3 with a 16% gain. The Commodities asset class was also the only positive one in Q3. Emerging Markets’ 2.8% decline was good enough to be the 2nd best-performing asset class on the following table, and US Real Estate was the worst with an 8.6% decline.
Employment: Are Workers Finally Getting Ahead?
The US Labor Force Participation Rate is only six-tenths of a percentage point away from fully recovering to its pre-pandemic level of 63.40% set in February 2020. US Job Openings are 20% below their record high of 12.03 million set in March 2022. This trend, coupled with solid payroll data, suggests employees are indeed returning to the workforce while employers have been succeeding in filling open positions.
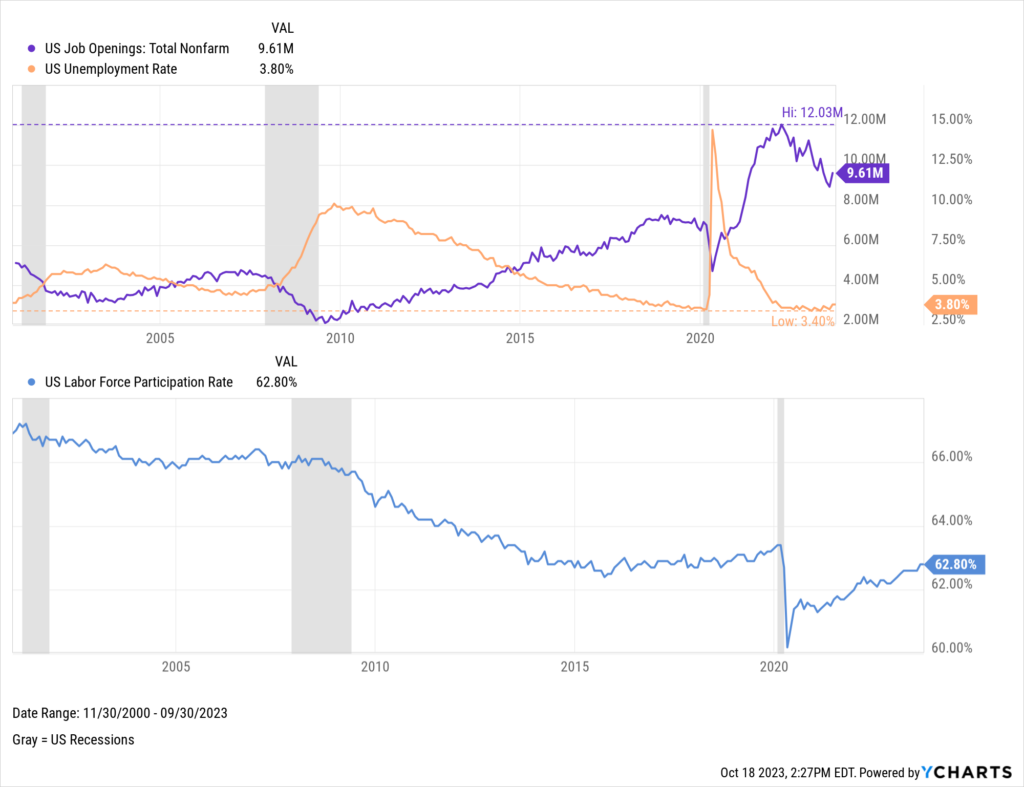
Download Visual | Modify in YCharts
Though YoY US (nominal) Average Hourly Earnings had a streak of declines since March 2022, YoY Real Average Hourly Earnings (adjusted for inflation) just logged its fifth consecutive monthly increase in September 2023. This means that earnings have outpaced inflation each month since May of this year, a stark turnaround from 25 consecutive YoY decreases prior to May.
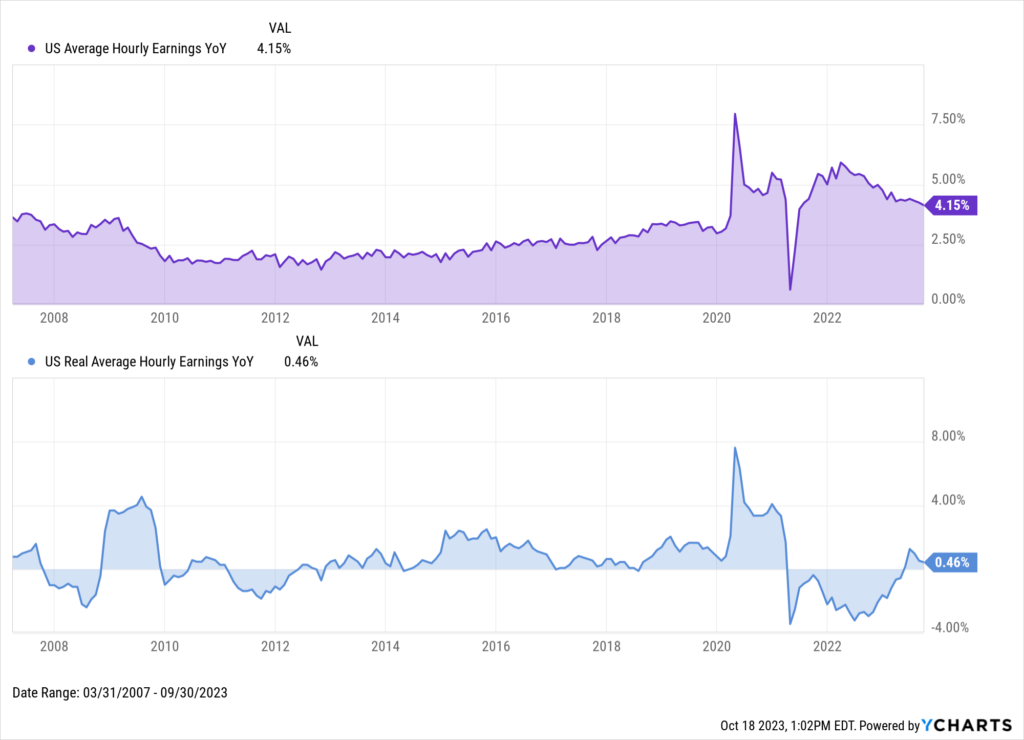
Download Visual | Modify in YCharts
Whenever you’re ready, there are 3 ways YCharts can help you:
1. Looking to better communicate the importance of economic events to clients?
Send us an email at hello@ycharts.com or call (866) 965-7552. You’ll be directly in touch with one of our Chicago-based team members.
2. Want to test out YCharts for free?
Start a no-risk 7-Day Free Trial.
3. Download a copy of the Quarterly Economic Update slide deck:
Disclaimer
©2023 YCharts, Inc. All Rights Reserved. YCharts, Inc. (“YCharts”) is not registered with the U.S. Securities and Exchange Commission (or with the securities regulatory authority or body of any state or any other jurisdiction) as an investment adviser, broker-dealer or in any other capacity, and does not purport to provide investment advice or make investment recommendations. This report has been generated through application of the analytical tools and data provided through ycharts.com and is intended solely to assist you or your investment or other adviser(s) in conducting investment research. You should not construe this report as an offer to buy or sell, as a solicitation of an offer to buy or sell, or as a recommendation to buy, sell, hold or trade, any security or other financial instrument. For further information regarding your use of this report, please go to: ycharts.com/about/disclosure
Next Article
A Closer Look At Q3 2023 Fund FlowsRead More →