A Closer Look At Q3 2023 Fund Flows
The 525bp spike in interest rates since March 2022 has deeply influenced the 2023 fund flow landscape. Consequently, Money Market Funds (Prime and Taxable) have witnessed a $183.9B surge in Q3. Also, fixed income ETFs and Mutual Funds continued their positive momentum, with $34.7B channeled into the category during the same period.
For a more nuanced look at the quarter’s flows, sign up for a copy of our Fund Flows Report and Visual Deck (clients only):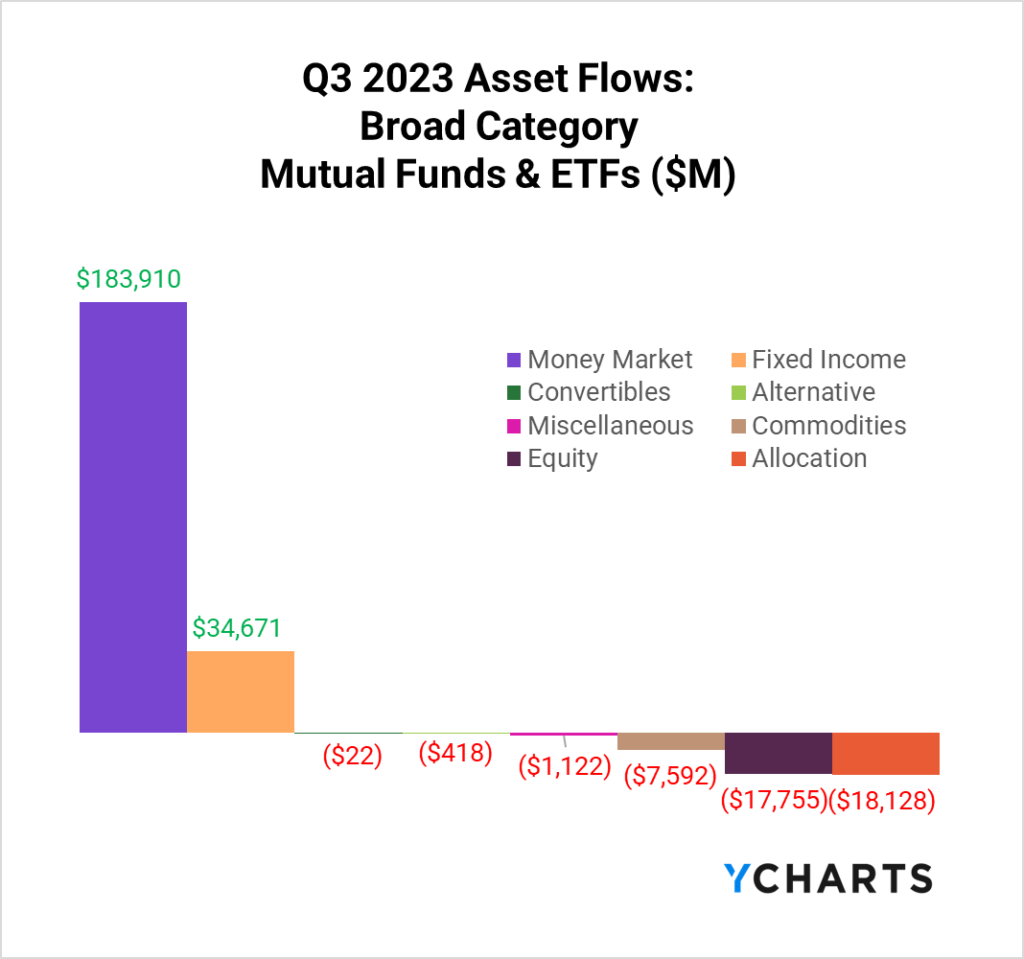
Which Money Market Funds Are the Most Popular
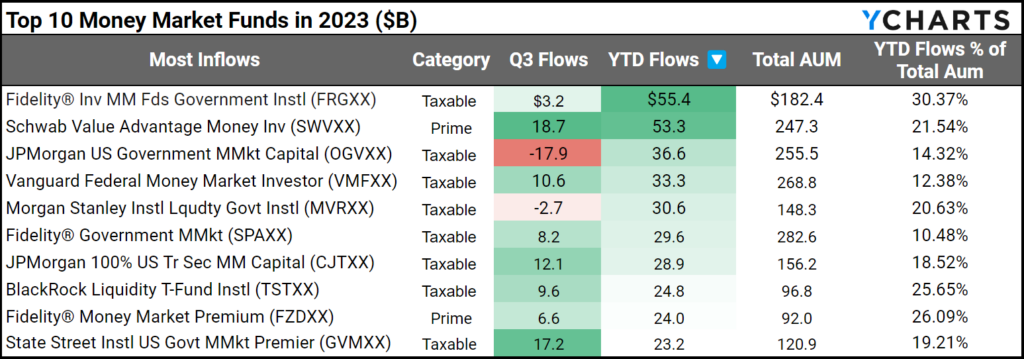
The Federal Reserve’s decision to hike rates has rejuvenated investor interest in Money Market Funds. So far, a whopping $769.48B has flowed into this category year-to-date. Fidelity® Inv MM Fds Government Instl (FRGXX) and Schwab Value Advantage Money Inv (SWVXX) are spearheading this trend, with both funds amassing over $50B this year.
View in YCharts | Download Visual
Passive vs Active Funds in 2023
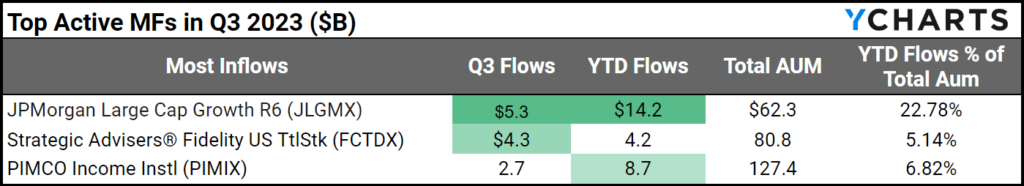
While Money Market Funds have stolen the spotlight, another discernible trend is evident when you look past their massive flows. Passive funds have garnered substantial favor, attracting $301.4B in net flows, while active funds have seen $219.6B in net outflows this year.

Active mutual funds have felt this pressure the most, but certain stalwarts like Strategic Advisers® Fidelity US TtlStk (FCTDX) and JPMorgan Large Cap Growth R6 (JLGMX) have bucked the trend, drawing $4.3B and $5.3B in Q3 respectively.
View in YCharts | Download Visual
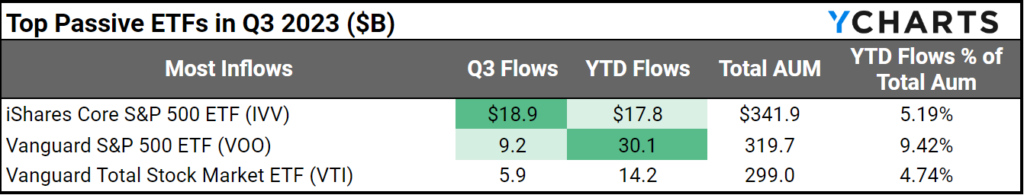
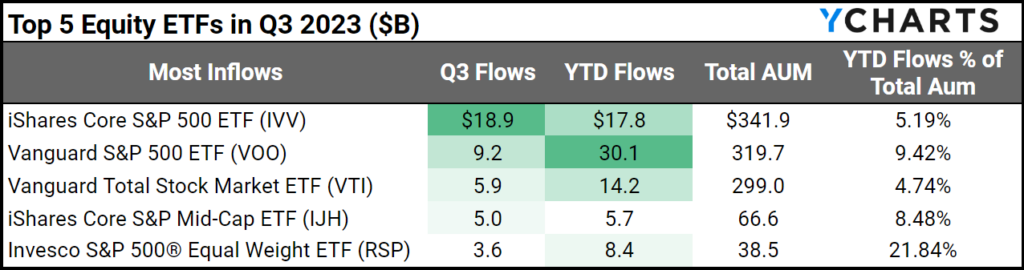
As of September 30th, ETFs have brought in $321.8B YTD as Passive ETFs become increasingly favored. For context, in 2021 – the best year for ETF inflows – they attracted $900B, followed by $614B in 2022. In Q3, two of the most popular S&P 500 ETFs led the way, with iShares Core S&P 500 ETF (IVV) and Vanguard S&P 500 ETF (VOO) bringing in $18.9B and $9.2B, respectively.
View in YCharts | Download Visual
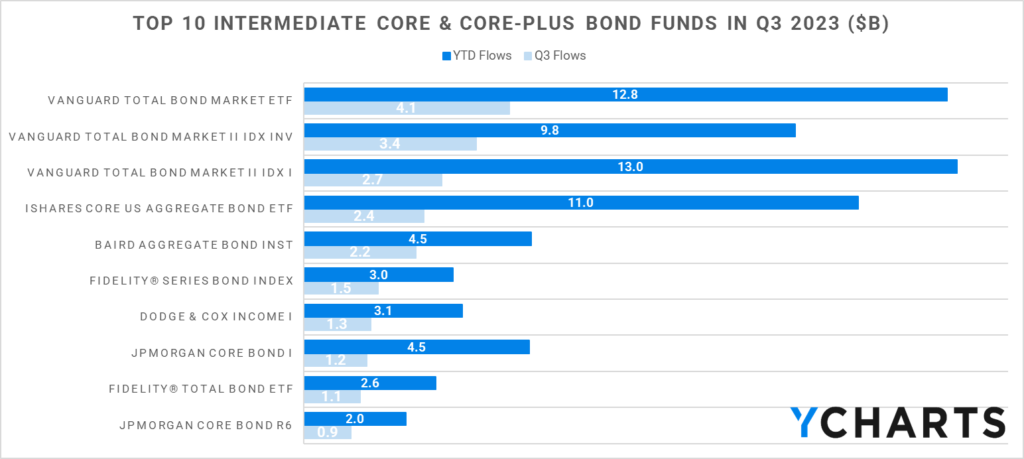
Most Popular Fixed Income Funds in Q3 2023
Mirroring Money Market Funds, fixed-income funds have also basked in the rising-rate scenario, pooling $34.7B in Q3. Intermediate core and core-plus bond funds were the primary recipients, bringing in a cumulative $41B in the quarter.
Vanguard funds claimed the top 3 spots in the quarter. The Vanguard Total Bond Market ETF (BND) led the pack, bringing in $4.1B, Vanguard Total Bond Market II Idx Inv (VTBIX) amassed $3.4B, and Vanguard Total Bond Market II Idx I (VTBNX) attracted $2.7B.
View in YCharts | Download Visual
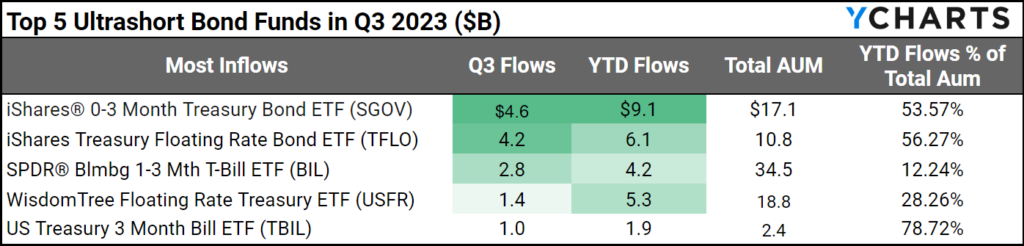
Ultrashort bond funds also had a good quarter, reigning in $10.9B. iShares® 0-3 Month Treasury Bond ETF (SGOV) and iShares Treasury Floating Rate Bond ETF (TFLO) led the way, reeling in $4.6B and $4.2B, respectively, in Q3.
View in YCharts | Download Visual
Most Popular Equity ETFs in 2023
The net negative flows in equities in Q3 were primarily due to outflows from Mutual Funds. Their ETF counterparts flourished, on the other hand, bringing in positive flows across the equity style box.
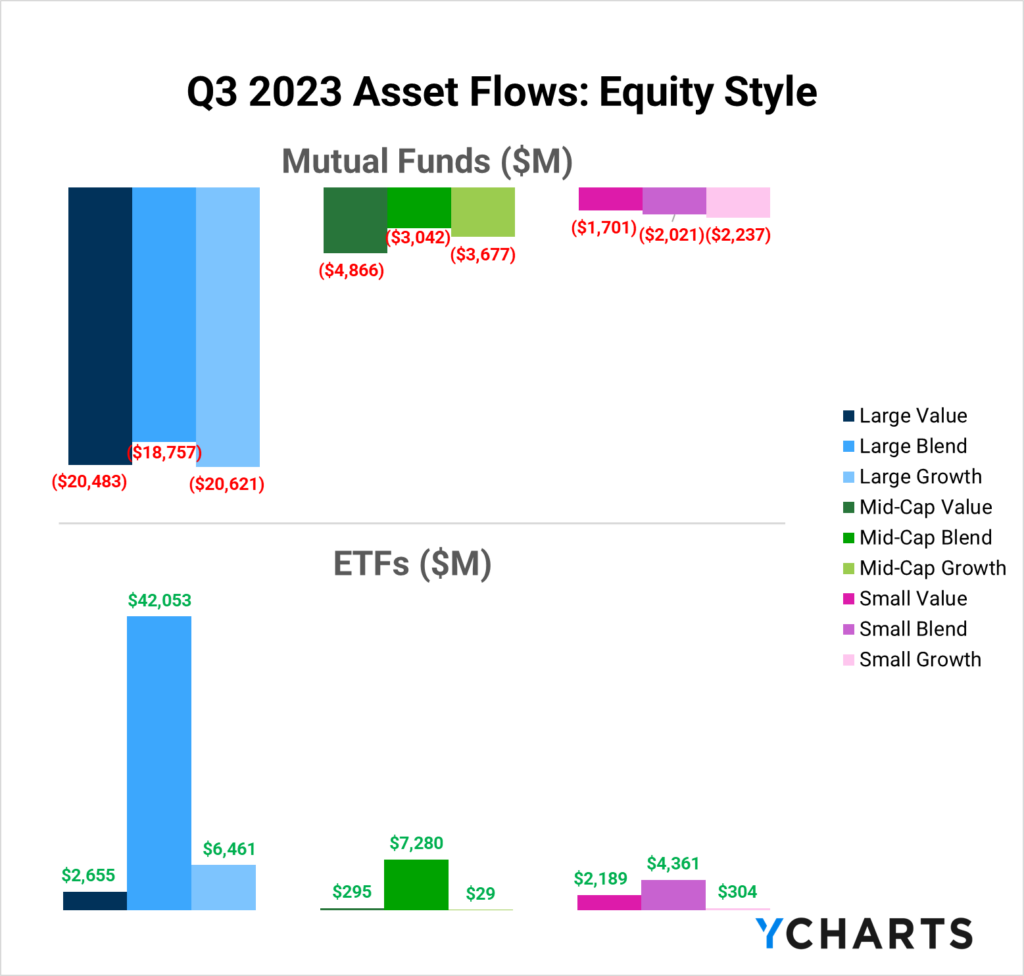
Overall, IVV and VOO were the most successful equity ETFs in securing assets in Q3.
View in YCharts | Download Visual
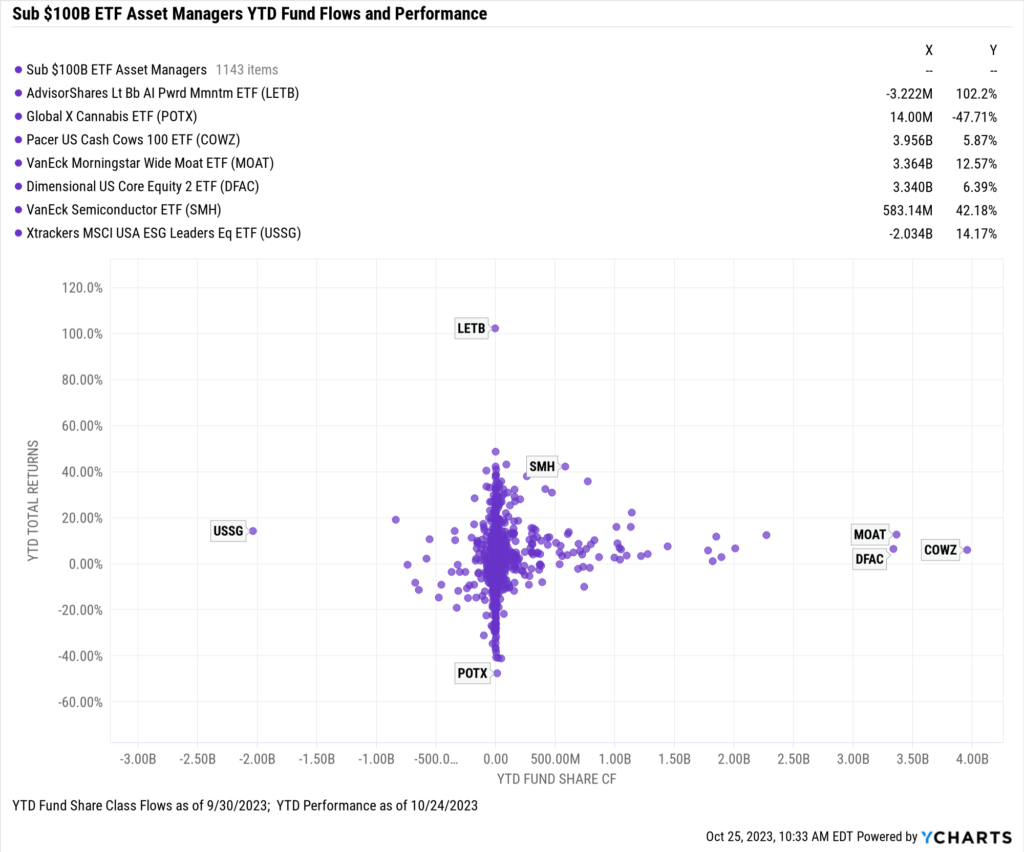
Narrowing this universe down to firms with under $100B in total ETF AUM provides insights into how niche players have faired in 2023. Pacer US Cash Cows 100 ETF (COWZ) has brought in the most assets ($4B) this year, and VanEck Morningstar Wide Moat ETF (MOAT) has brought in $3.6B while producing 12.6% YTD total returns.
Modify in YCharts | Download Visual
How To Leverage Fund Flow Data as a Wholesaler
Let the trend be your friend, whether strategizing for ETF assets conversion or capitalizing on inflows into Intermediate Core Bond and Intermediate Core-Plus Bond funds. Being well-informed empowers your conversations with advisors, offering them current and relevant market insights.
Sign up to get a copy of our Fund Flows Report and Visual Deck sent to you monthly (clients only):YCharts offers several tools to help illustrate why an advisor should use your strategy as they rebalance portfolios for the end of the year and the start of 2024. From unearthing competing funds using the Fund Screener to crafting compliant-friendly Scenarios to Stress Testing your fund’s performance in similar market environments, YCharts has got you covered.
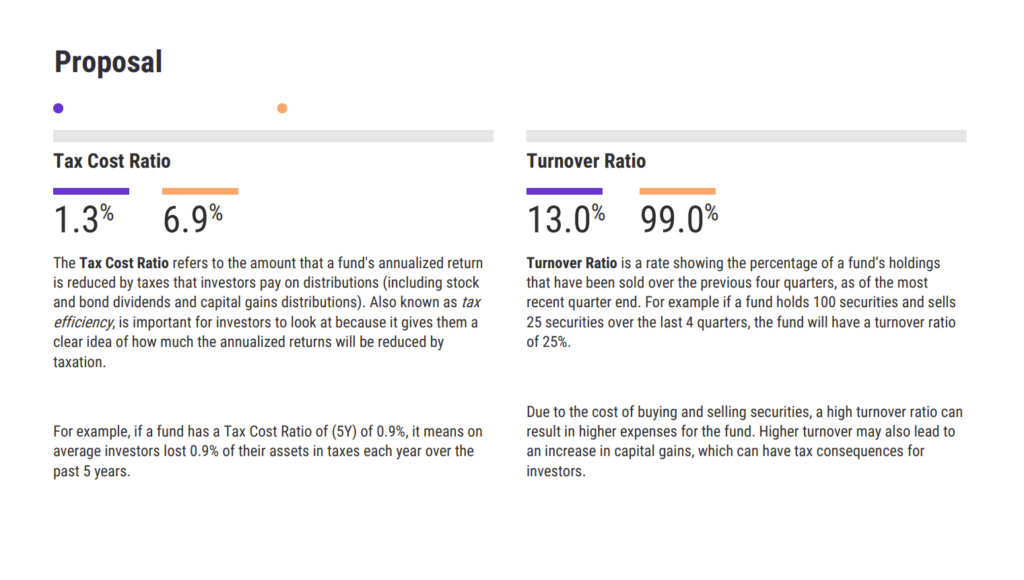
With the power of Talking Points and Proposals, you can create high-level messaging to position your fund as a superior alternative. Whether presenting your fund as an opportunity to save an advisor’s client money during tax season or simply showcasing your fund as a higher yield alternative, you can use YCharts’ Proposals and Talking Points to provide an advisor with high-level reasons why your fund is the right choice for their clients.
Start a Trial to Build Your Own Proposal
With fund flow data and these tools, you can align your strategies with market trends and advisors’ conversations with their clients. Check out our recent Fund Flows Webinar for more ideas on combining YCharts and flow data to grow AUM.
Whenever you’re ready, there are three ways YCharts can help you:
Have questions about how YCharts can help you grow AUM and prepare for meetings?
Email us at hello@ycharts.com or call (866) 965-7552. You’ll get a response from one of our Chicago-based team members.
Sign up for a copy of our Fund Flows Report and Visual Deck (clients only)
Unlock access to our Fund Flows Report and Visual Deck by becoming a client.
Dive into YCharts with a no-obligation 7-Day Free Trial now.
Disclaimer
©2023 YCharts, Inc. All Rights Reserved. YCharts, Inc. (“YCharts”) is not registered with the U.S. Securities and Exchange Commission (or with the securities regulatory authority or body of any state or any other jurisdiction) as an investment adviser, broker-dealer, or in any other capacity, and does not purport to provide investment advice or make investment recommendations. This report has been generated through application of the analytical tools and data provided through ycharts.com and is intended solely to assist you or your investment or other adviser(s) in conducting investment research. You should not construe this report as an offer to buy or sell, as a solicitation of an offer to buy or sell, or as a recommendation to buy, sell, hold or trade, any security or other financial instrument. For further information regarding your use of this report, please go to: ycharts.com/about/disclosure
Next Article
Earnings Season Playbook: Q3 2023 Reports To WatchRead More →