Q3 2023 Fund Flows: The Biggest Inflows and Outflows of the Quarter
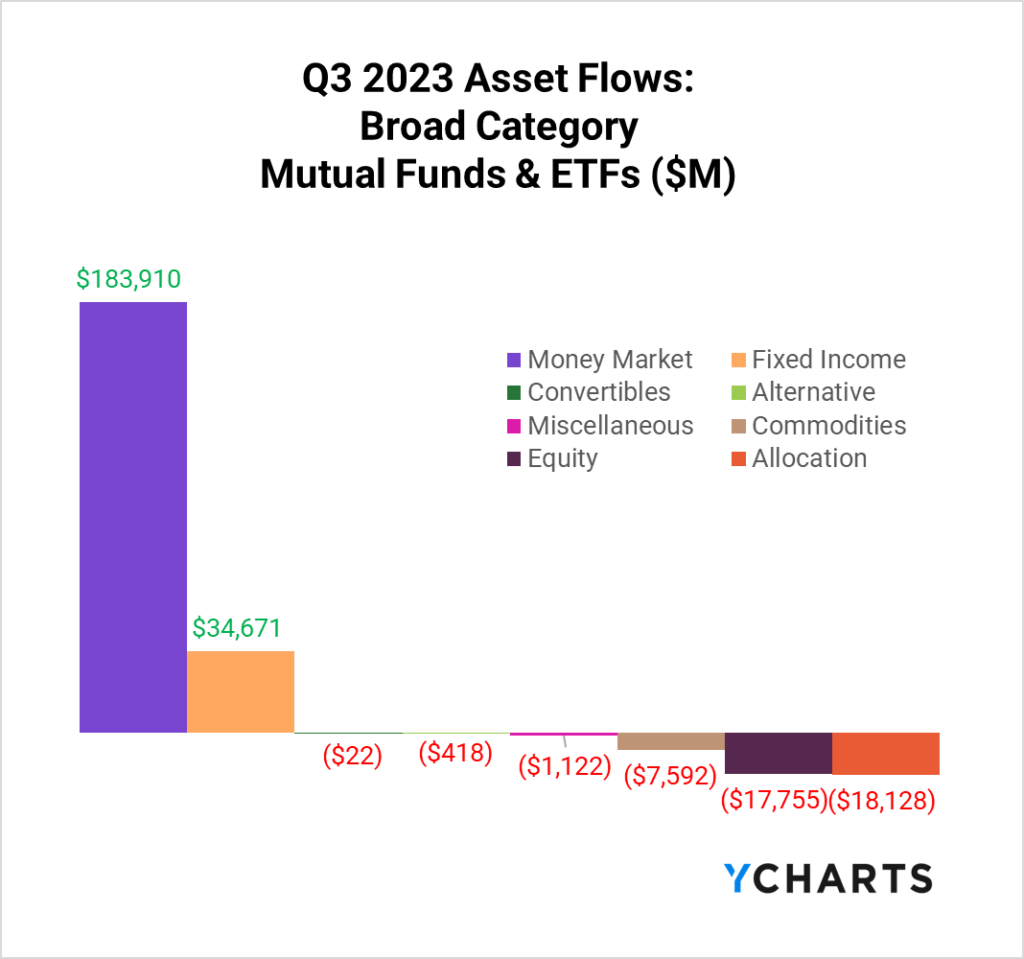
The third quarter of 2023 saw a continuation of this year’s trend of investors steadily funneling into Money Market funds, which amassed inflows of $183.9B. Elsewhere in the market, the rise in 10-year treasury yields influenced flows across various asset classes in a somewhat predictable fashion.
During a lackluster quarter for major indices – the S&P 500 dipped 3.7% from June 30th to September 29th – outflows were prominent in the equity market. Concurrently, the Bloomberg US Aggregate trailed closely with a 3.2% dip in Q3. Fixed Income, however, emerged as the only other broad category capturing positive flows, likely propelled by investors keen on capitalizing on the new yield environment.

The Federal Reserve’s stance was notable in this quarter’s narrative. After a 15-month ascent to a 15-year high, the FOMC elected to maintain the Target Federal Funds Rate range at 5.25-5.50% during its September assembly.
With rising yields and a static Federal Reserve stance, the landscape of Q3 2023 reflects a blend of caution and tactical positioning. The $34.7B infusion into Fixed Income funds this quarter, driven by rising yields, highlights investors’ preference for steadier returns over the risks associated with equities. As we dissect sector and style-based fund flows in subsequent sections, we’ll delve into how these dynamics influence investors’ strategies as the year’s final quarter unfolds.
Fund flows are the net cash inflow into a fund (purchases) or net outflow from a fund (redemptions). Irrespective of fund performance, when a mutual fund or ETF has positive fund flows (or net issuances for ETFs) in a given period, that fund’s managers have more cash to buy more holdings. The opposite is also true: as fundholders sell shares, fund managers sell out of positions and use the cash to pay redemptions.
This means that fund flow data can indicate higher or lower demand for different asset types, depending on which funds and categories have relatively large inflows or outflows.
Mutual Fund Flows: Biggest Winners and Losers
Money Market funds were a significant draw in Q3 2023, amassing $183.9B in inflows. With 10-year treasury yields climbing to their highest point since 2007 and the yield curve trending towards normalization, Fixed Income funds received $34.7B in inflows. This year’s habitual frontrunners, Intermediate Core Bond and Intermediate Core-Plus Bond funds, were the primary recipients of these inflows, securing $18.8B and $10.8B, respectively, epitomizing the sustained quest for stability among investors.

The top three categories witnessing mutual fund outflows came from equities. As we’ll explore later, this is part of a broader trend where equity flows move from mutual funds to ETFs. However, this quarter, the outflows from the Large Growth ($20.6B) and Large Value ($20.5B) styles dwarfed any inflows into their ETF counterparts, producing net negative equity flows in Q3. This departure from Mutual Funds across the equity style box reflects the sign of the times, where substantial yields are now accessible through alternative investment avenues like Money Market funds and longer-term treasuries.

ETF Flows: Biggest Winners and Losers
As mentioned above, in Q3 2023, investors continued to transition from Mutual Funds to ETFs, specifically in the Large Blend space. The $42.1B in inflows to Large Blend were responsible for that style being the only equity segment with over $1B in overall inflows (mutual funds and ETFs) in Q3. Ultrashort bond ETFs attracted $17.2B inflows as some investors seemed to opt for a barbell strategy – aiming to mitigate interest rate risk while delivering a satisfactory yield – in the evolving yield environment marked by the higher-for-longer interest rate outlook.

Outflows in ETFs were substantially lower than mutual funds in Q3. The category that saw the most assets leave was Commodities, seeing $6.6B in outflows. Corporate bonds ($6.2B) and Short-Term bonds ($3.7B) followed closely. The migration suggests investors can find attractive yields with reduced credit risk elsewhere. Moreover, a burgeoning appetite for diverse duration risk has led to a sidelining of short-term bonds.

Equity Style Fund Flows and Performance
The table below summarizes the nine equity-style boxes’ performance and combined ETF and mutual fund flows.
In Q3, investors continued to favor Large-Cap Blend funds over any other equity style. As highlighted earlier, most equity outflows originated from mutual funds, which significantly eclipsed any inflows directed toward value or growth funds across all size categories. Large-Cap Blend emerged as the big winner, attracting a substantial $23.3B in inflows. Additionally, both Small and Mid-cap Blend funds experienced net positive flows. This trend suggests in the ever-present value versus growth debate, investors are opting for more balanced fund strategies as they rebalance their portfolios for the fourth quarter.

Q3 2023 Sector Flows Reflect Monetary Tightening
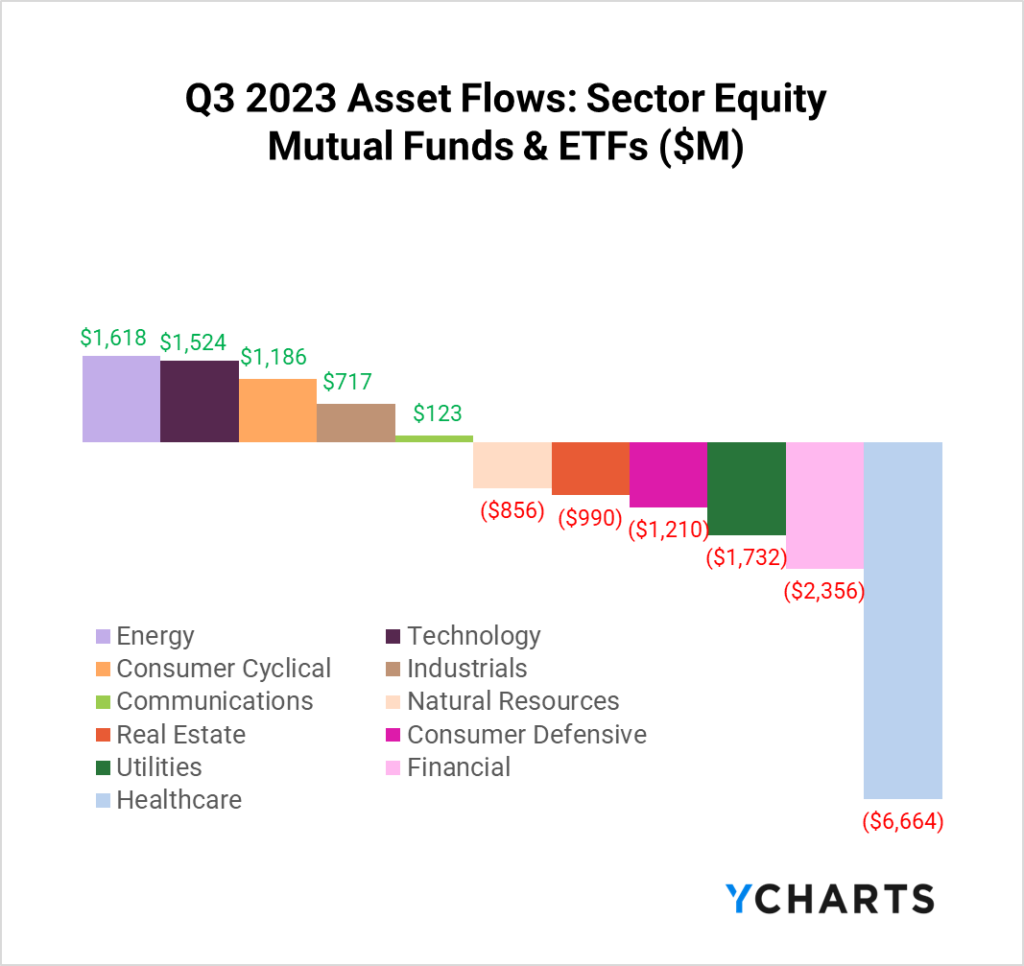
In Q3 2023, investors’ sector preferences shifted in a tightening monetary landscape. The Energy sector, mirroring surging global energy prices, attracted $1.6B after seeing $7B in outflows last quarter. Technology continued its ascent with $1.5B inflows, spurred by an optimistic Q4 earnings outlook for mega-cap tech stocks. Conversely, healthcare extended its decline from Q2, shedding an additional $6.6B. The shifts in sector flows are yet another reflection of investors seeking balanced investment strategies at the tail end of the year.

Leveraging Insights: A Note for Wholesalers
The surge in inflows for Intermediate Core Bond and Intermediate Core-Plus Bond funds poses a prime opportunity for wholesalers with products in these categories. As advisors increasingly discuss these asset categories with their clients, you have a unique opportunity to deliver valuable insights. After using the Fund Screener to uncover rival funds, use Scenarios or Stress Tests to highlight your fund’s performance over time or during similar market environments.
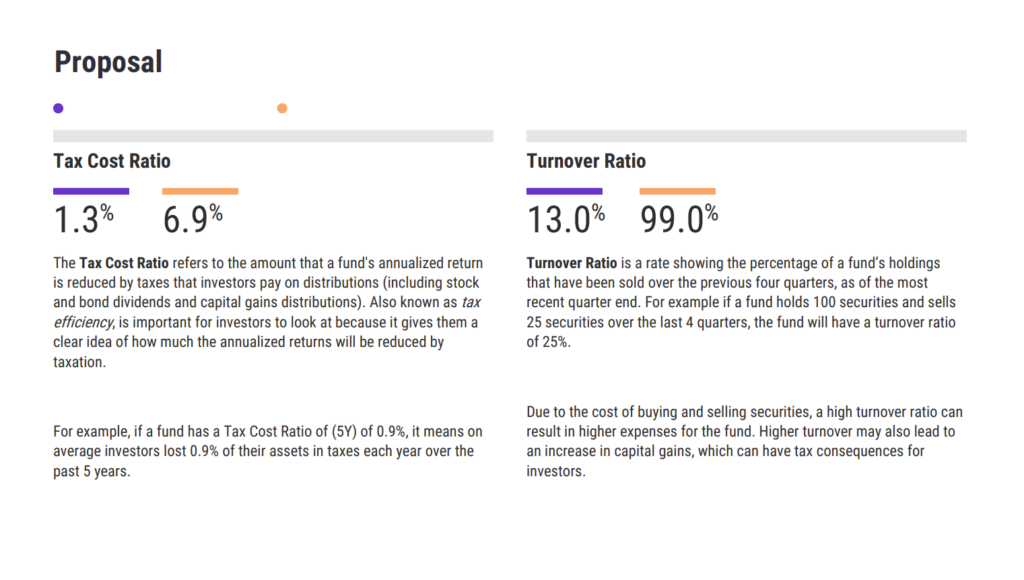
Then, with the power of Talking Points and Proposals, you can convincingly position your fund as a superior alternative. Whether presenting your fund as an opportunity to save an advisor’s client money during tax season or simply showcasing your fund as a higher yield alternative, you can use YCharts’ Proposals and Talking Points to provide an advisor with high-level reasons why your fund is the right choice for their clients.

Start a Trial to Build Your Own Proposal
With fund flow data and these tools, you can align your strategies with market trends and advisors’ conversations with their clients. Check out a replay of our latest fund flow webinar for a more detailed discussion surrounding fund flows.
Whenever you’re ready, there are three ways YCharts can help you:
Have questions about how YCharts can help you grow AUM and prepare for meetings?
Email us at hello@ycharts.com or call (866) 965-7552. You’ll get a response from one of our Chicago-based team members.
Sign up for a copy of our Fund Flows Report and Visual Deck (clients only)
Unlock access to our Fund Flows Report and Visual Deck by becoming a client.
Dive into YCharts with a no-obligation 7-Day Free Trial now.
Disclaimer
©2022 YCharts, Inc. All Rights Reserved. YCharts, Inc. (“YCharts”) is not registered with the U.S. Securities and Exchange Commission (or with the securities regulatory authority or body of any state or any other jurisdiction) as an investment adviser, broker-dealer, or in any other capacity, and does not purport to provide investment advice or make investment recommendations. This report has been generated through application of the analytical tools and data provided through ycharts.com and is intended solely to assist you or your investment or other adviser(s) in conducting investment research. You should not construe this report as an offer to buy or sell, as a solicitation of an offer to buy or sell, or as a recommendation to buy, sell, hold or trade, any security or other financial instrument. For further information regarding your use of this report, please go to: ycharts.com/about/disclosure
Next Article
Is the Stock Market too Concentrated? Magnificent Seven Q3 2023 UpdateRead More →
