Q2 2023 Fund Flows: Equity Outflows, Money Market Influx, and Recession Jitters
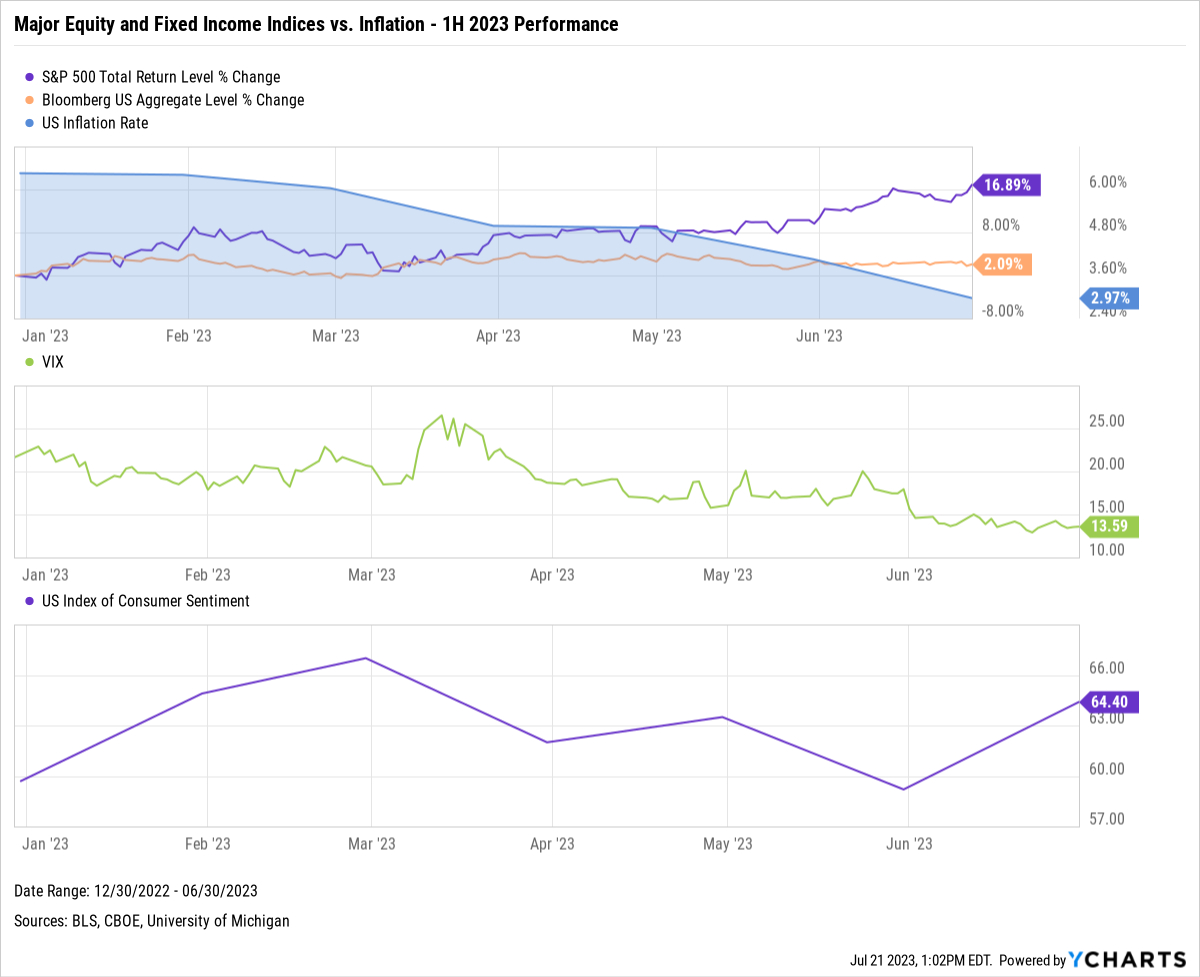
As we cross the halfway mark of 2023, the narrative of the stock market has been characterized by the Magnificent Seven powering major indices forward. The S&P 500 is now flirting with its all-time highs at the same time the Bloomberg US Aggregate is continuing its rally.
YoY inflation retreated to a more manageable 2.97% in June, a significant downtick from its multi-decade record 9% peak just a year ago. And after hiking interest rates for 15 straight months, the Federal Reserve appears to be easing off the gas after pausing hikes in June. However, the central bank anticipates two more hikes before 2023 wraps up.
The VIX has remained relatively subdued, hitting its lowest level since the pre-pandemic period.
Nevertheless, recessionary fears persist, with the predicted chances of an economic downturn hovering at their highest level since the 1980s. But it’s not all storm clouds on the horizon as consumer sentiment is soaring to levels not seen since September 2021.
Download Visual | Modify in YCharts
Between fund flows, consumer sentiment, and reducing inflation, the economy seems caught between recovery and caution, underscored by strong market performance mixed with apprehension of a potential recession.
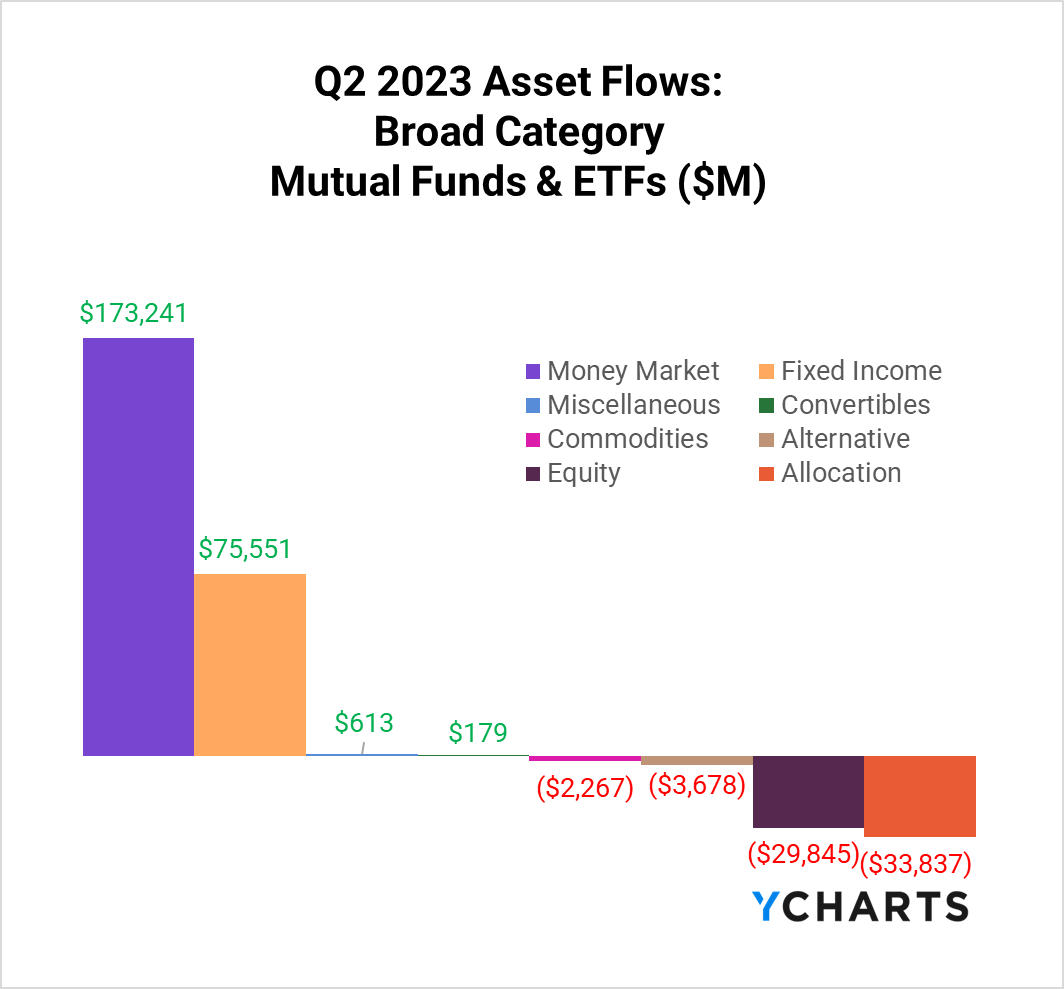
In a reflection of the economic uncertainties, investor behavior in the second quarter was characterized by a sustained preference for safety and liquidity. This manifested itself in the substantial $173.2B inflow into Money Market funds during Q2 2023, albeit at a reduced pace from the Q1 influx. The preference for these low-risk vehicles underscores the ongoing apprehension among investors despite signs of economic recovery and market gains.
Fund flows are the net cash inflow into a fund (purchases) or net outflow from a fund (redemptions). Irrespective of fund performance, when a mutual fund or ETF has positive fund flows (or net issuances for ETFs) in a given period, that fund’s managers have more cash to buy more holdings. The opposite is also true: as fundholders sell shares, fund managers sell out of positions and use the cash to pay redemptions.
This means that fund flow data can indicate higher or lower demand for different asset types, depending on which funds and categories have relatively large inflows or outflows.
Interested in receiving YCharts Fund Flow Reports? Subscribe here:Mutual Fund Flows: Biggest Winners and Losers
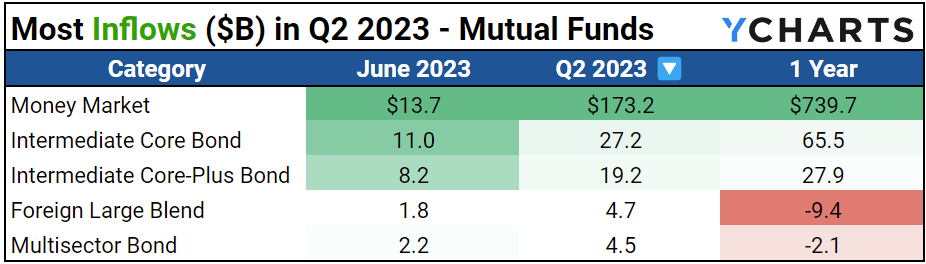
While Money Market funds continued to attract the lion’s share of inflows in Q2 2023 with $173.2B, the fixed income space also witnessed considerable action. The appetite for stability was evident as Intermediate Core Bond and Intermediate Core-Plus Bond mutual funds saw significant quarterly inflows, with $27.2B and $19.2B, respectively. This trend suggests investors’ desire for relatively safer assets amid economic uncertainty.
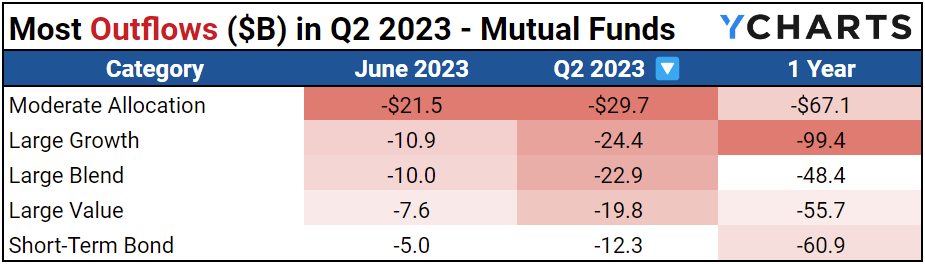
There were prominent outflows from equity and allocation funds. Large Growth mutual funds continued their trend from last quarter, experiencing quarterly outflows of $24.4B, and $22.9B also fled Large Blend mutual funds. Meanwhile, Moderate Allocation funds were hit hardest with $29.7B exiting the category, indicating a shift in investor sentiment away from balanced strategies.
ETF Flows: Biggest Winners and Losers
In Q2 2023, investors demonstrated a continued transition from mutual funds to ETFs, most notably in equities. Despite their mutual fund counterparts experiencing significant outflows, Large Blend and Growth ETFs saw quarterly inflows of $57.9B and $8.8B, respectively. Additionally, Intermediate Core Bond funds maintained consistent appeal across both investment vehicles, emphasizing their attractiveness amidst market uncertainty.
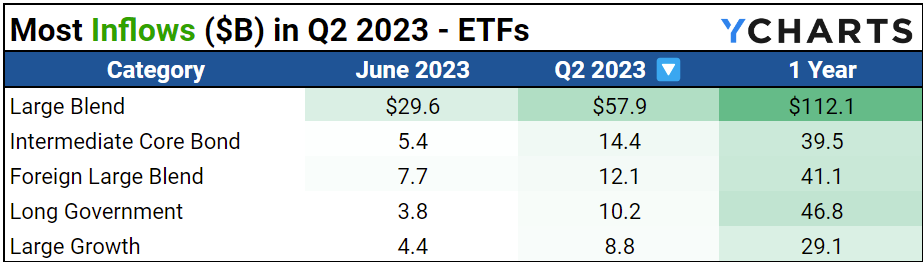
Both the equity and fixed-income sectors saw significant outflows. Large Value ETFs witnessed a substantial exodus of $8.7B, continuing last quarter’s trend and likely reflecting the ripple effect of Large Growth’s outperformance on the year. On the fixed-income side, Inflation-Protected Bond ETFs faced a decline of $3.4B, likely due to investors rethinking their inflation-hedging strategies as the inflation rate continues to cool.

Equity Style Fund Flows and Performance
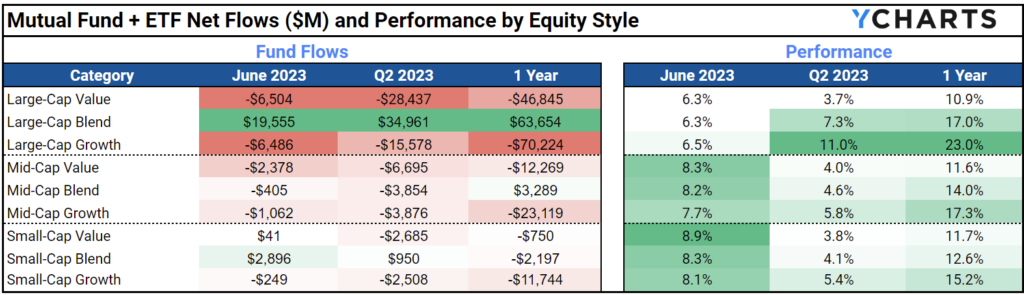
The table below summarizes the nine equity-style boxes’ performance along with combined ETF and mutual fund flows.
Despite positive returns across all equity styles, assets flowed out of equity funds of every style but two. In the large-cap segment, Blend stood out with strong inflows of $35B. Yet, despite the outperformance of Growth that delivered 11% returns, flow data suggests that returns in the first half of the year have still not convinced investors back to equities fully.
Investor Caution Grows as Outflows Hit High-Performing Sectors
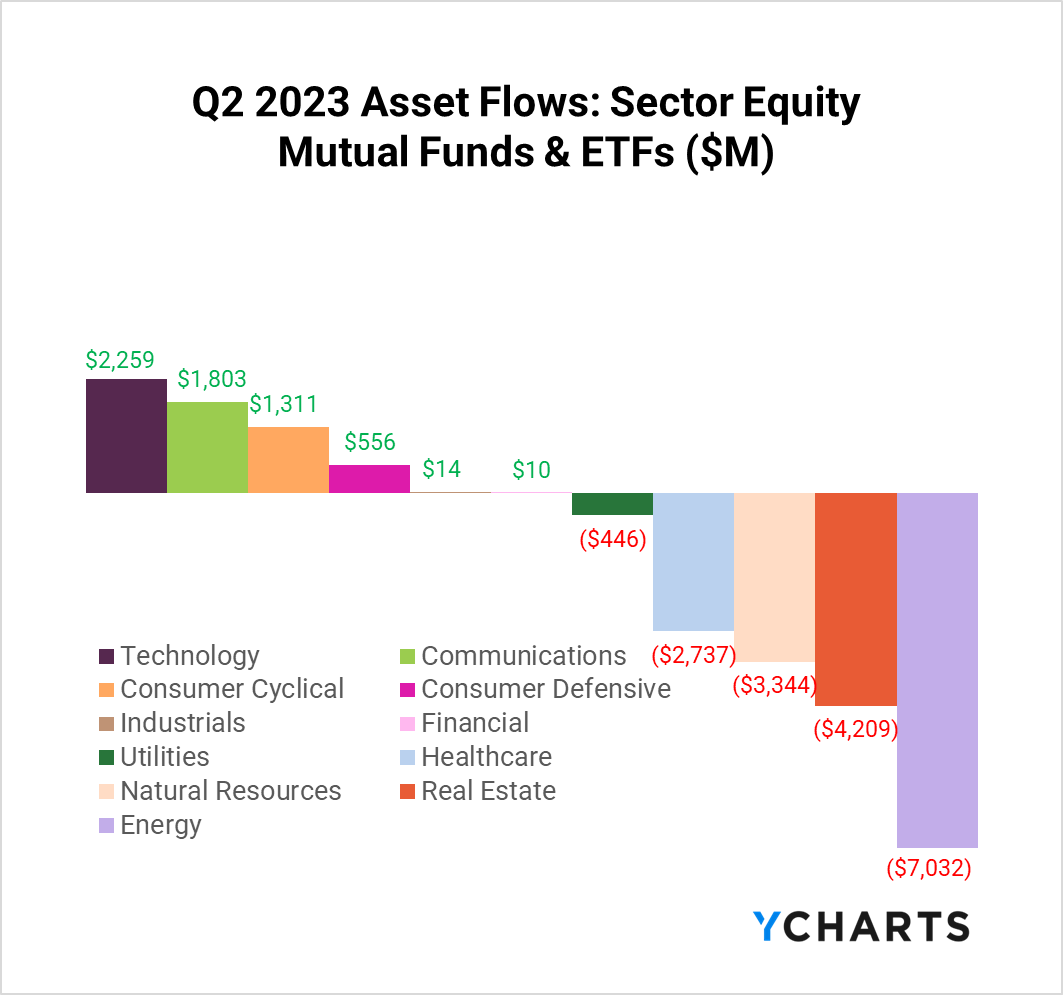
Likely buoyed by the performances from major tech names, investors have continued to pivot towards growth-oriented sectors. Consequently, funds weighted toward Technology and Communication Services saw quarterly inflows of $2.3B and $1.8B, respectively. On the other end of the spectrum, the leader-to-laggard shifts continued for Energy and Health Care funds in Q2, seeing an exodus of $7B and $2.7B, respectively.
Leveraging Insights: A Note for Wholesalers
The surge in inflows for Intermediate Core Bond and Intermediate Core-Plus Bond funds poses a prime opportunity for wholesalers with products in these categories. As advisors increasingly discuss these asset categories with their clients, you have a unique opportunity to deliver valuable insights. By utilizing the Fund Screener to uncover rival funds within these categories and dissect their strengths and weaknesses, you can convincingly position your offerings as superior alternatives, seamlessly integrating your insights into advisors’ ongoing conversations with their clients.
In the equity space, Large Growth funds experienced considerable outflows during Q2, suggesting that investors are reevaluating their strategies in the growth space. Utilize the Scenarios or Stress Tests to highlight your Large Growth fund’s performance over time or during similar market environments.
Proactively using fund flow data and other various tools at your disposal can help position your funds. By aligning your products with market trends and conversations advisors are having with their clients, you can emphasize your funds’ unique value in today’s market. For a more detailed discussion surrounding fund flows, check out a replay of our latest fund flow webinar.
Connect with YCharts
To learn more, schedule time to meet with an asset management specialist, call us at (773) 231-5986, or email hello@ycharts.com.
Want to add YCharts to your technology stack? Sign up for a 7-Day Free Trial to see YCharts for yourself.
Disclaimer
©2022 YCharts, Inc. All Rights Reserved. YCharts, Inc. (“YCharts”) is not registered with the U.S. Securities and Exchange Commission (or with the securities regulatory authority or body of any state or any other jurisdiction) as an investment adviser, broker-dealer, or in any other capacity, and does not purport to provide investment advice or make investment recommendations. This report has been generated through application of the analytical tools and data provided through ycharts.com and is intended solely to assist you or your investment or other adviser(s) in conducting investment research. You should not construe this report as an offer to buy or sell, as a solicitation of an offer to buy or sell, or as a recommendation to buy, sell, hold or trade, any security or other financial instrument. For further information regarding your use of this report, please go to: ycharts.com/about/disclosure