Earnings Season Playbook: Q3 2023 Reports To Watch
Just like that, we’re in Q4, which means Q3 2023 earnings season is upon us. Equities have risen most of the year despite corporate profits lingering below their Q4 2021 level (more on that below). However, the last three months have pressured the stock market’s returns for 2023. After a 5.6% dip since July 31, the S&P 500 is currently up 12.8% YTD.
Despite the recent retreat, the Magnificent Seven stocks still constitute 29% of the S&P 500, their earnings results have the potential to move the broader market substantially. Positive results could lift the entire index, while disappointing figures might drag it down, underscoring their pivotal role in the modern equity environment.
Given the Magnificent Seven’s significant influence on the broader market, being well-prepared for client discussions about these tech giants is crucial. Our “Top 10 Visuals Deck for Prospect & Client Meetings” slide deck is tailored to equip you with the insights and visuals you need.
Sign Up Now to secure your copy of our Top 10 Visuals for Prospect & Client Meetings:Long-term yields have soared to decade-highs, introducing a fresh risk-free return avenue through Treasuries. This shift isn’t good news for stocks since investors now seek greater returns from the “riskier” equity market. The Utilities Sector has been one of the biggest laggards, as more income-centric or risk-averse investors can now get a 4.8% yield on the 10-year Treasury.
If rates stay higher for longer, borrowing costs will impact corporate profits and drag on earnings. Higher rates also slow down the consumer, who has over $1 trillion in revolving credit. Finally, a strengthening US dollar creates profit headwinds for multinational companies.
“Earnings Season”: the months during which most publicly traded publicly traded companies release quarterly financial results & earnings reports, notably earnings-per-share (EPS) and revenue, usually in January, April, July, and October.
Whether you’re a buy-and-hold investor or trade around earnings, Our Earnings Season Playbook is designed to keep you and your clients informed.
Click to jump to a specific section:
Corporate Profits at the Market Level
Biggest Beats of Q2 2023
Biggest Misses of Q2 2023
Stock Earnings Calendar
Using YCharts to Navigate Earnings Season
Corporate Profits at the Market Level
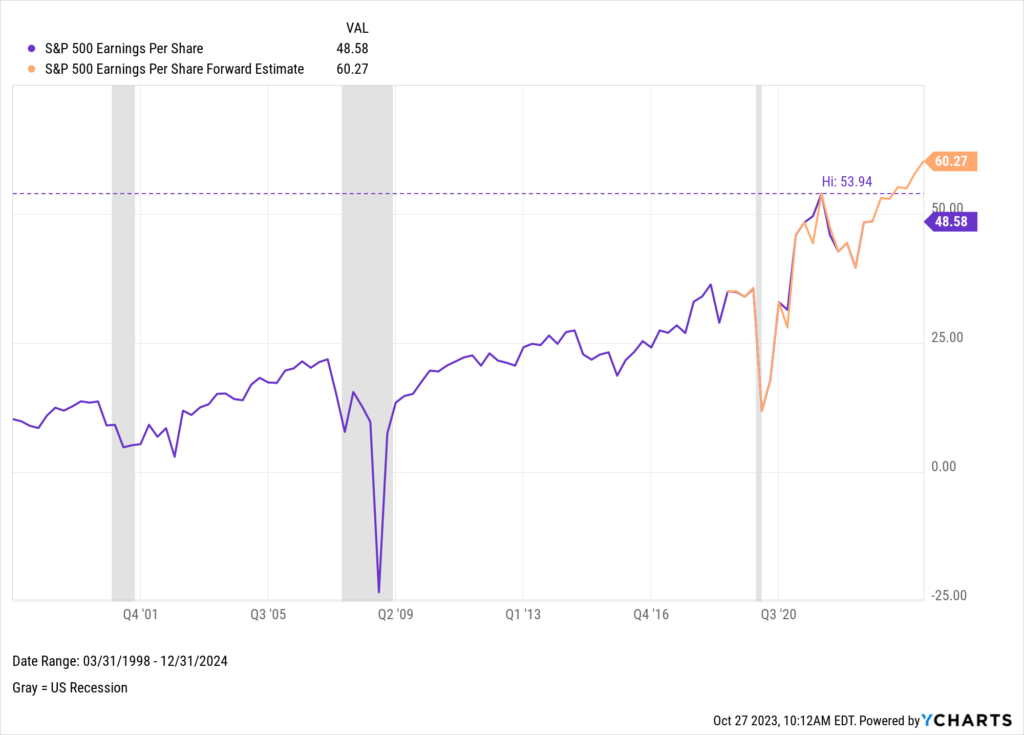
Since the March 2020 bottom, equities rallied on strong corporate profits and improving sentiment—until 2022. According to Standard & Poor’s, the composite EPS for all S&P 500 stocks reached an all-time high of 53.94 in Q4 2021.
However, as of Q1 2023, the most recent data available, composite EPS retreated 10.3% from its previous peak. Based on forward estimates, S&P 500 earnings are anticipated to revisit their previous high by Q3 2023.
Download Visual | Modify in YCharts
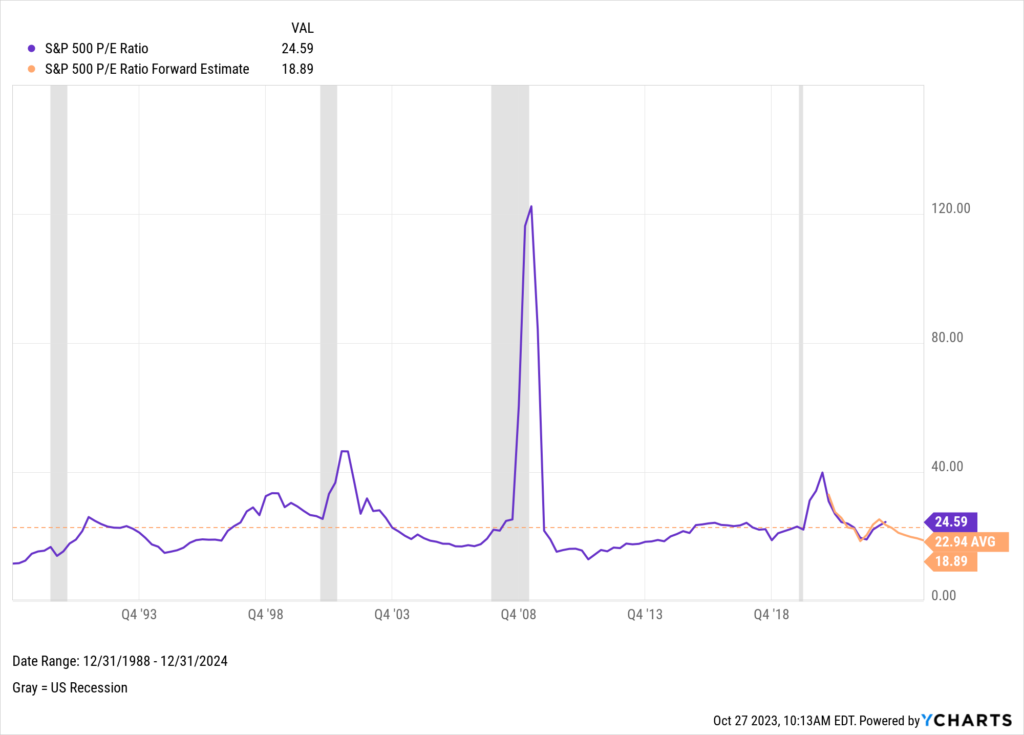
This year’s rally has nudged the S&P 500’s valuation higher. The S&P 500 Price-to-Earnings (P/E) ratio stands at 24.59, reflecting a 4.81% increase from the preceding quarter and slightly above its historical average of 24.31. Market analysts are left wondering if corporate earnings can support this accelerated price trend.
Based on analyst expectations, S&P 500 Forward P/E is 19, which is below the long-term average of 23. With that in mind, there are two prevailing narratives. The bullish narrative is that the market is currently undervalued and we’re set up for a year-end rally. The bearish narrative is that forward earnings estimates are too high and results will come in lower than expected. The result would be a pull back for the broader market.
Download Visual | Modify in YCharts
Biggest Earnings Beats of Q2 2023
Looking at earnings reports from Q2 2023—the most recent data available—there were 14 companies across the S&P 500 and Nasdaq-100 that beat consensus estimates by 75% or more.
Can these names continue their strong winning ways this earnings season?
Access & Modify Data in YCharts
Biggest Earnings Misses of Q2 2023
The same reports from Q2 earnings season can also be used to identify names at the bottom of the barrel. Last quarter, 11 companies from the S&P 500 and Nasdaq-100 reported EPS figures 25% or more below estimates.
If these were isolated performance lapses, could these names be poised to surprise the street this earnings season?
Access & Modify Data in YCharts
Stock Earnings Calendar
To keep you organized this earnings season, this calendar below provides scheduled reporting dates for the 50 largest U.S. companies. A similar earnings calendar can also be created in YCharts for all stocks, or constituents of specific indices.
Using YCharts to Navigate Earnings Season
Find companies on an earnings beat run
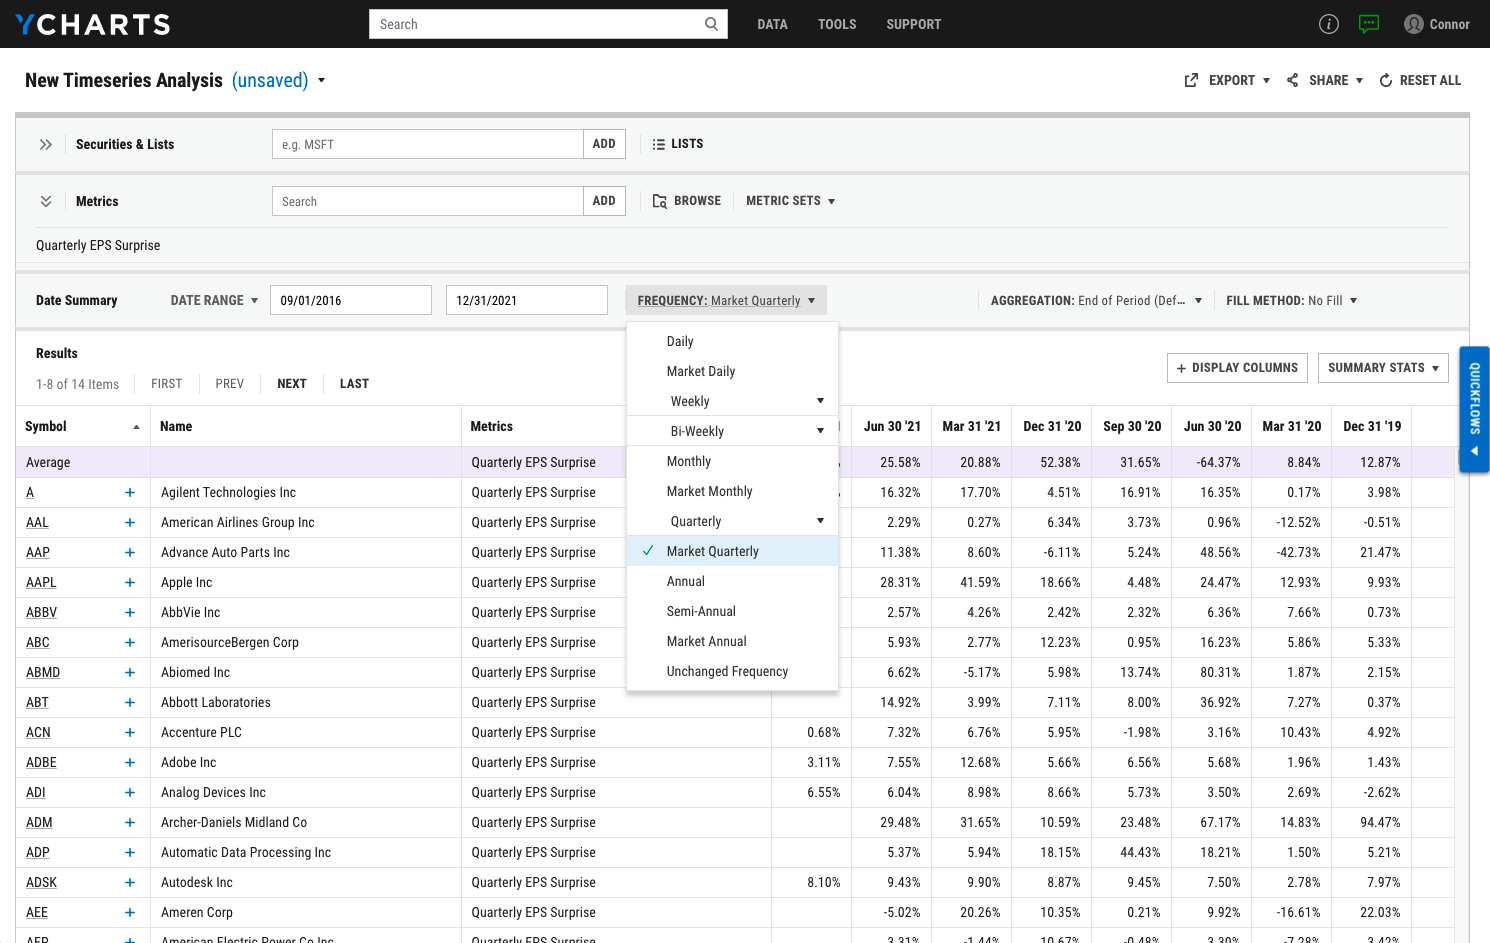
To find companies that have beat analyst expectations over consecutive quarters, use Timeseries Analysis to quickly compile and align data like EPS Surprise, Forward EPS Estimates, and Actual EPS. Because companies report financial results on different days throughout earnings season, format unlike data by clicking “Frequency” then select “Market Quarterly” to align all EPS data to the standard quarter-ends.
Armed with properly formatted data, click “Export” then either “Export Data” or “Export to Excel Add-in” (if using the YCharts Excel Add-in, the spreadsheet will be linked to YCharts and automatically update when new data becomes available). From here, you can layer additional formulas to identify which names have a streak of beating expectations.
If you spot a company of interest, use the Earnings Chart Quickflow to dig deeper by visualizing the company’s historical EPS beat and miss trends—and how the share price has responded. The Quickflows Menu is accessed via the blue tab on the right-hand side of YCharts.
Find companies with the biggest earnings beats and misses
Want to see which companies outpaced the street’s expectations? Or find opportunities in names that sold off after an earnings miss?
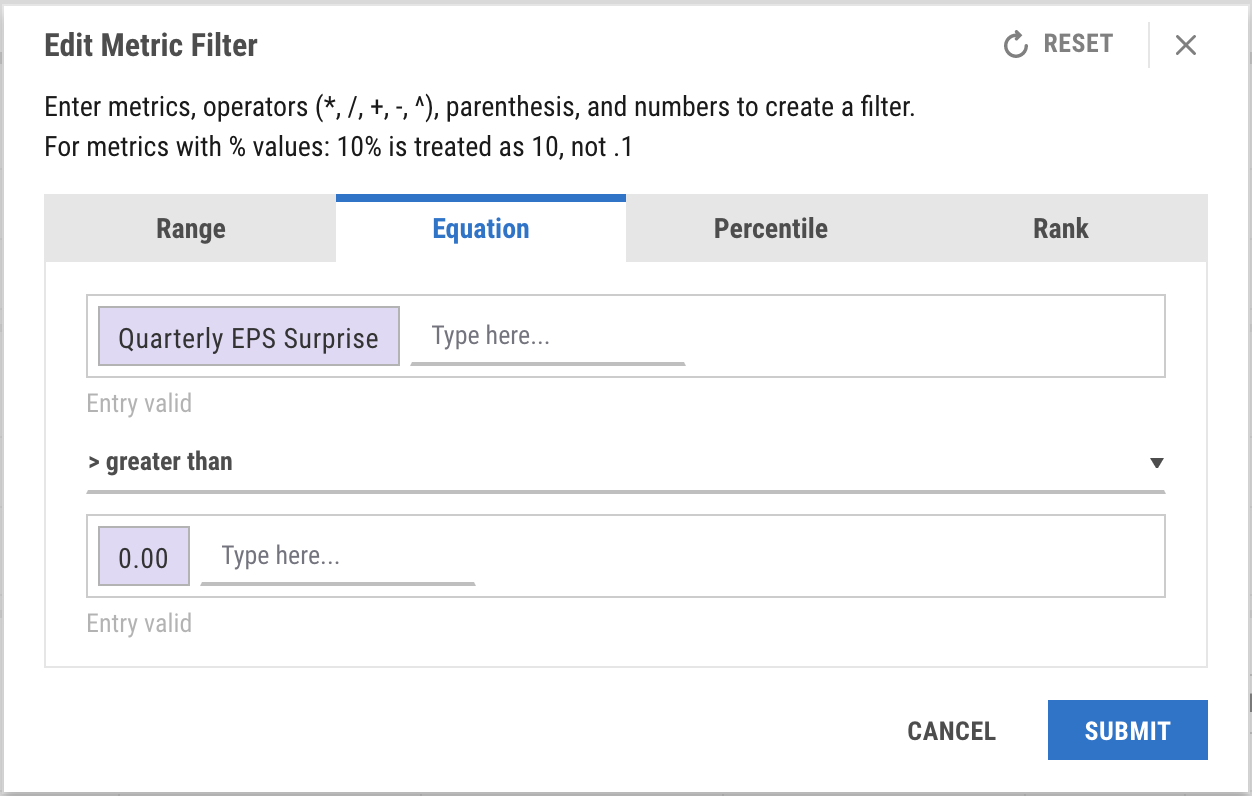
Use the Stock Screener to find companies with a positive Earnings Surprise and compare their data side-by-side. In the Stock Screener, add either a broad market index, like the S&P 500, or a more targeted list, such as your portfolio holdings, by clicking “Modify” and toggling between the “Equities” and “My Lists” menus. Then click “Add Filter” and type to search for “EPS Surprise” or related metrics, and set a range or equation for its value.
Click the screen’s name in the upper left corner to save, and distribute to colleagues by clicking “Share” in the upper right corner.
Create a custom earnings season calendar
Click “Data” in the top navigation bar, then “Events Calendar”. From here, a stock earnings calendar can be created by unchecking all Event types except “Earnings”. In the upper left corner, click “Select a List” to filter the calendar by stock style, index, sector, and more.
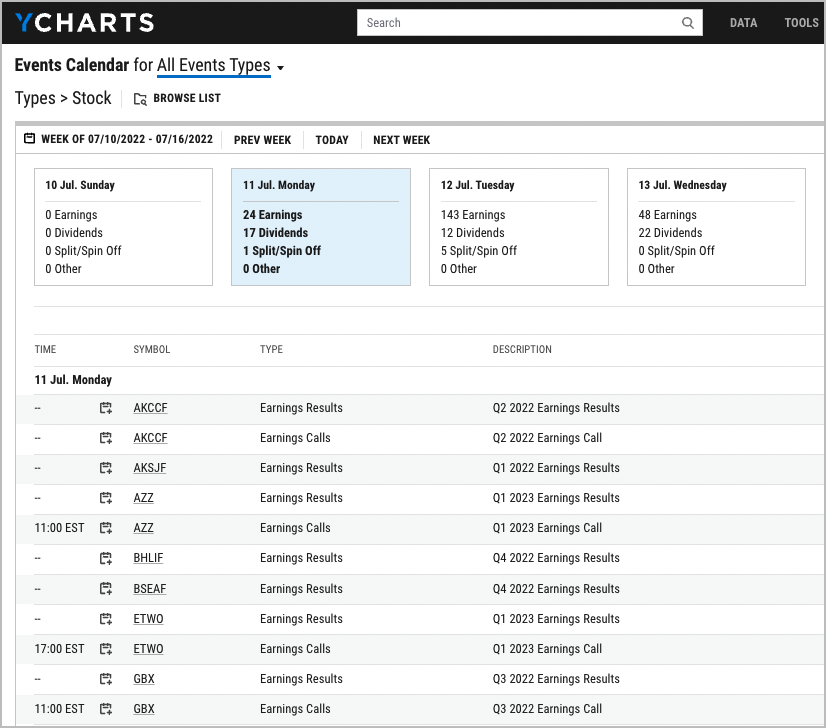
Modify a Stock Earnings Calendar in YCharts
Whenever you’re ready, there are 3 ways YCharts can help you:
1. Have questions about how YCharts can help you prepare for earnings season?
Send us an email at hello@ycharts.com or call (866) 965-7552. You’ll be directly in touch with one of our Chicago-based team members.
2. Want to test out YCharts for free?
Start a no-risk 7-Day Free Trial.
3. Download a copy of The Top 10 Visuals for Prospect & Client Meetings:
Disclaimer
©2023 YCharts, Inc. All Rights Reserved. YCharts, Inc. (“YCharts”) is not registered with the U.S. Securities and Exchange Commission (or with the securities regulatory authority or body of any state or any other jurisdiction) as an investment adviser, broker-dealer or in any other capacity, and does not purport to provide investment advice or make investment recommendations. This report has been generated through application of the analytical tools and data provided through ycharts.com and is intended solely to assist you or your investment or other adviser(s) in conducting investment research. You should not construe this report as an offer to buy or sell, as a solicitation of an offer to buy or sell, or as a recommendation to buy, sell, hold or trade, any security or other financial instrument. For further information regarding your use of this report, please go to: ycharts.com/about/disclosure
Next Article
How to Effectively Communicate Tax Savings to Your ClientsRead More →