Economic Update: Reviewing Q4 2023
Below is a sneak peek of insights from the YCharts Q4 2023 Economic Summary Deck. The deck, published quarterly, arms advisors and investors with key insights from the previous quarter to help you make smarter investment decisions going forward.
Download the Economic Summary Deck:Market and Asset Class Update
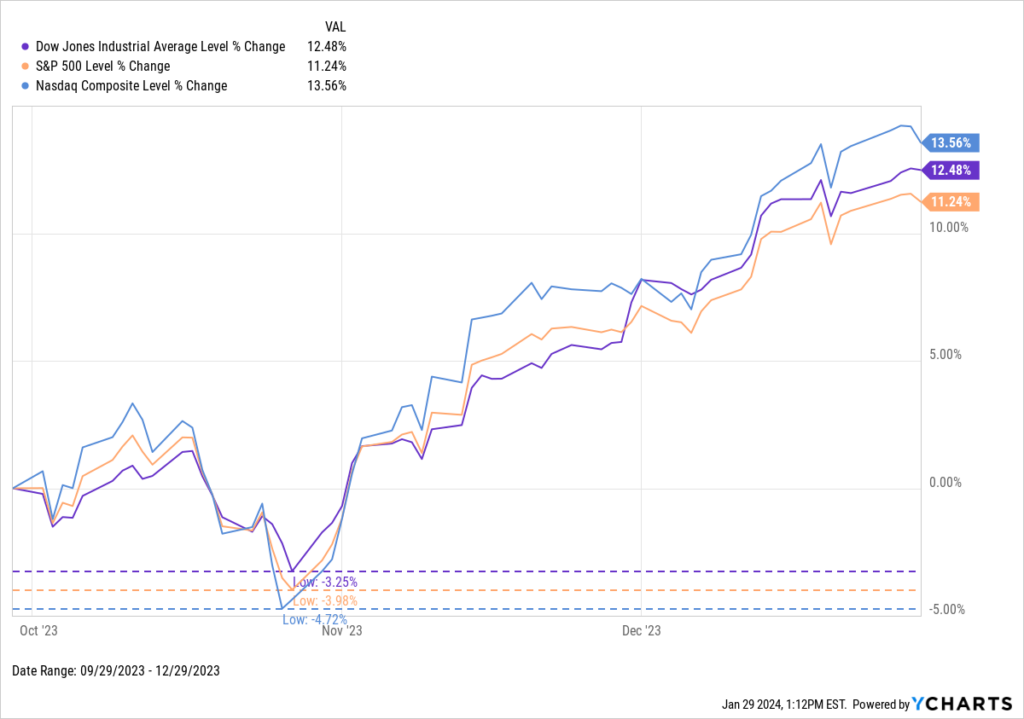
Investors went risk-on to close out the year as stocks rebounded from a drawdown in Q3. The NASDAQ led the way with a 13.6% gain in Q4. The Dow Jones was right behind, rising 12.5%, while the S&P 500 advanced 11.2%.
Download Visual | Modify in YCharts
The Q4 rebound in the stock market resulted in all three major US indices producing positive double-digit returns in 2023. The NASDAQ surged 43.4%, the S&P tacked on 24.2%, and the Dow Jones increased by 13.7%.
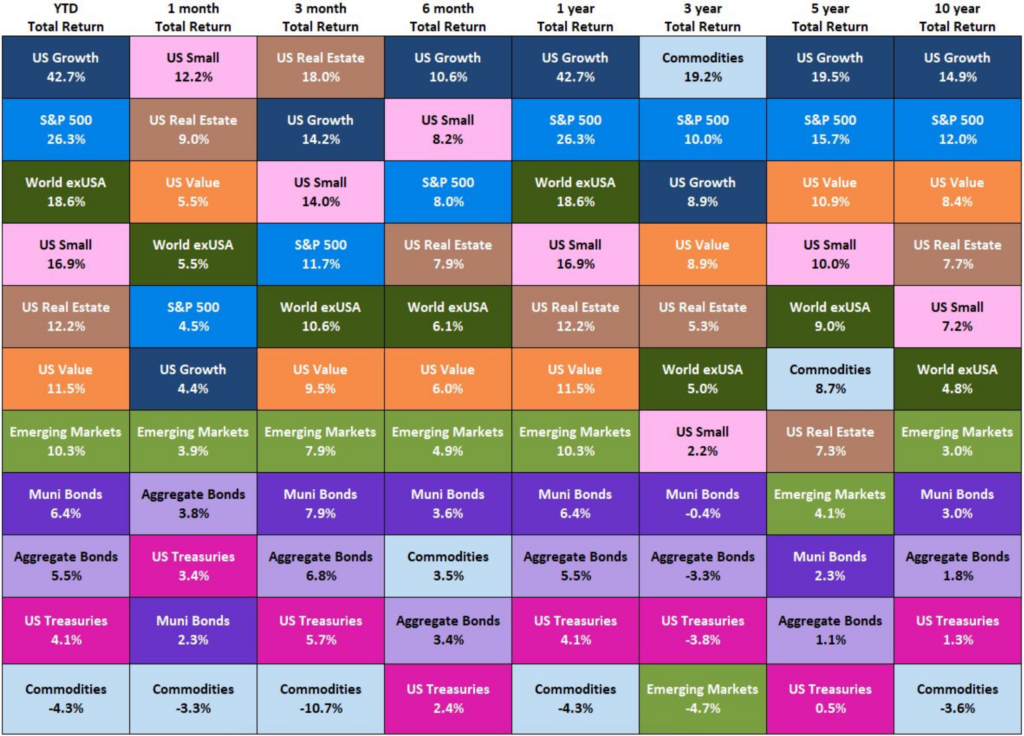
As for total returns across asset classes, Real Estate was the leader in Q4 with an 18% gain. Right behind it were the sensitive asset classes of US Growth and US Small Caps. Commodities were the only asset class that failed to post a positive return in both Q4 and the full year.
Download Visual | Email Us to Access This Quilt
Manufacturing: Contraction, or Expansion?
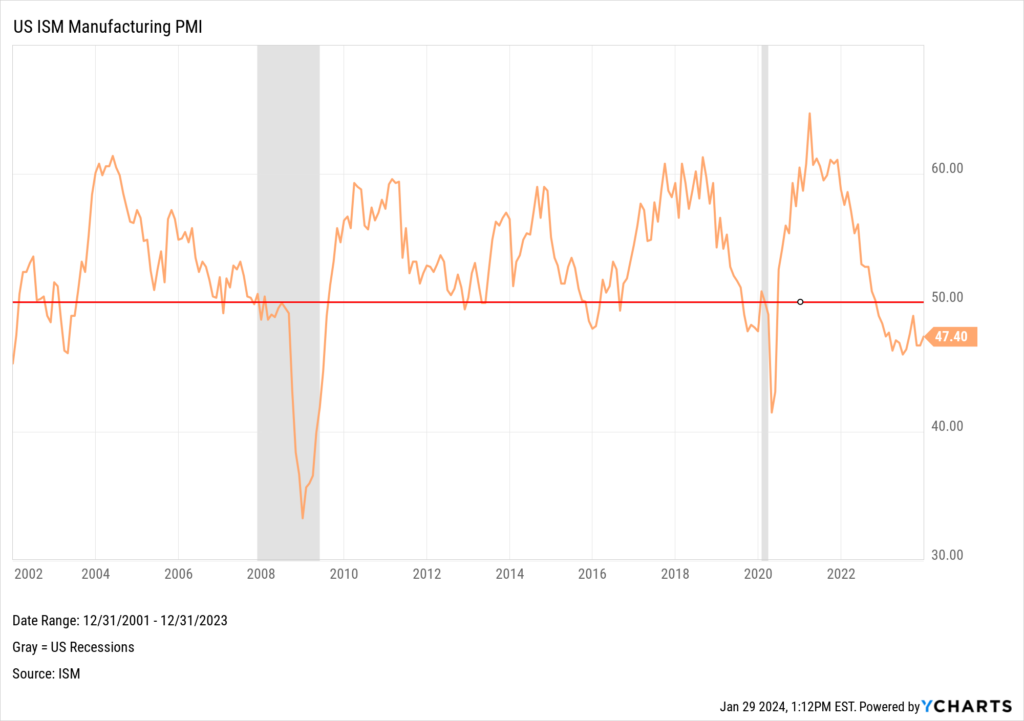
The state of the US manufacturing sector is a complex picture right now. If using the ISM Manufacturing PMI, the sector is in contraction territory.
When the PMI is below 50, it signals a contraction in the sector. As shown in the chart below, the PMI has been under this threshold since November 2022.
Download Visual | Modify in YCharts
The trajectories of US Manufacturing Construction Spending and US Manufacturing New Orders present a different picture entirely. Both have seen a notable acceleration over the same timeframe.
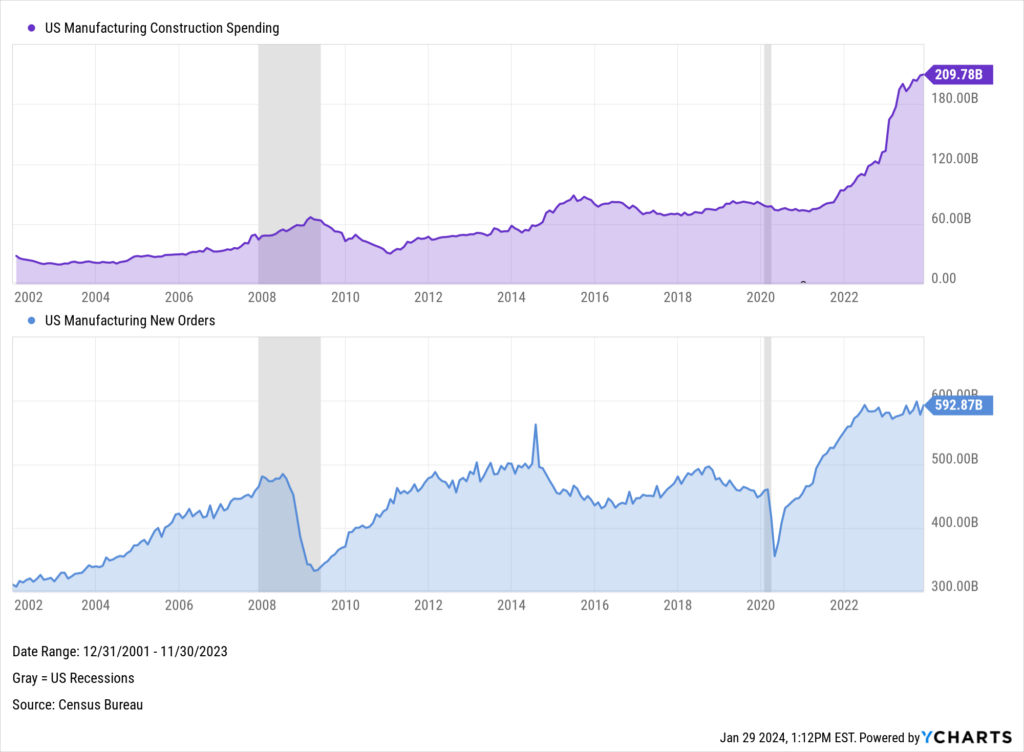
Download Visual | Modify in YCharts
The divergence between the PMI and construction spending and orders may point to a sector that is preparing for a rebound despite current contractionary pressures. Could the sustained high volume of new orders be a signal that the sector may actually be on the verge of an expansion?
Whenever you’re ready, there are 3 ways YCharts can help you:
1. Looking to better communicate the importance of economic events to clients?
Send us an email at hello@ycharts.com or call (866) 965-7552. You’ll be directly in touch with one of our Chicago-based team members.
2. Want to test out YCharts for free?
Start a no-risk 7-Day Free Trial.
3. Download a copy of the Quarterly Economic Update slide deck:
Disclaimer
©2024 YCharts, Inc. All Rights Reserved. YCharts, Inc. (“YCharts”) is not registered with the U.S. Securities and Exchange Commission (or with the securities regulatory authority or body of any state or any other jurisdiction) as an investment adviser, broker-dealer or in any other capacity, and does not purport to provide investment advice or make investment recommendations. This report has been generated through application of the analytical tools and data provided through ycharts.com and is intended solely to assist you or your investment or other adviser(s) in conducting investment research. You should not construe this report as an offer to buy or sell, as a solicitation of an offer to buy or sell, or as a recommendation to buy, sell, hold or trade, any security or other financial instrument. For further information regarding your use of this report, please go to: ycharts.com/about/disclosure
Next Article
Risk-Reward Profiles of the Best Performing ETFs in 2023Read More →