Risk-Reward Profiles of the Best Performing ETFs in 2023
What’s better than a 25%+ total return for the S&P 500? Beating it. With the insights below, you can find the 16% of ETFs that beat the S&P in 2023 and which of those funds could’ve significantly improved the risk mitigation and performance of your clients’ portfolios over five years.
The Best Performing ETFs of 2023 white paper compiles the returns of the best-performing ETFs of 2023 across various categories, including size, style, sector, and duration (for fixed income).
Download your copy to get the full analysis for your own due diligence.
Get your copy of The Best Performing ETFs of 2023 here:Comparing S&P 500 Outperformers’ Upside and Downside Capture
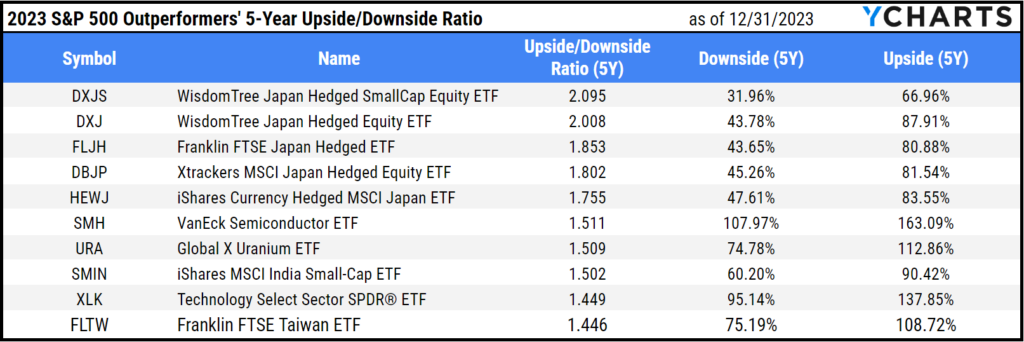
Our analysis of all equity ETFs found that only 16% (328 out of 2028 ETFs as of January 1st) outperformed the S&P 500’s 26% total return in 2023. Out of those 328 funds, only 97 have an upside/downside ratio greater than 1 (meaning they captured more of the market’s upside than downside) over five years.
The WisdomTree Japan Hedged SmallCap Eq ETF (DXJS) had the highest upside-downside ratio of 2.095 during this time, capturing 67% of the market’s upside while limiting its downside capture to just 32%.
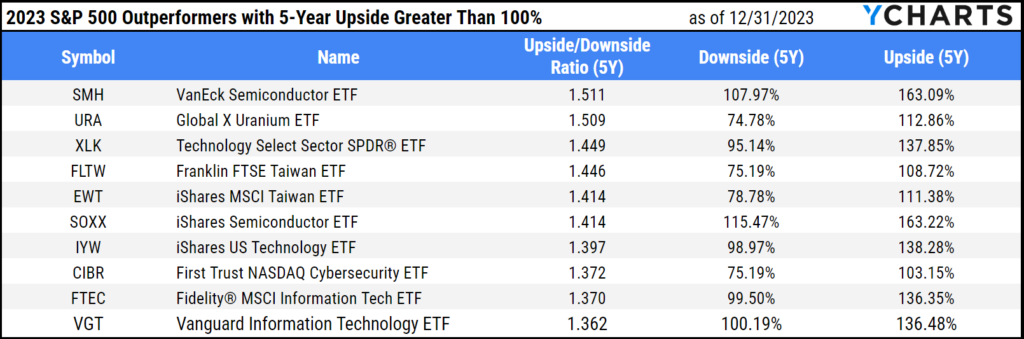
For funds that captured more than 100% of the market’s upside over five years, VanEck Semiconductor ETF (SMH) led the way, achieving a 1.511 five-year upside-downside ratio by capturing 163.1% of the market’s upside and only 108% of the downside.
Here’s a sortable table of all 97 ETFs that beat the S&P 500 last year and have a five-year upside/downside ratio greater than 1:
Comparing the Standard Deviations for 2023’s Best Performing Active Mid-Cap ETFs
The data from our white paper shows that active managers were most effective in the mid-cap category in 2023. Active mid-cap ETFs had a higher percentage of outperformers compared to their Russell and S&P benchmarks than their passive counterparts. Furthermore, the average performance of Active mid-cap ETFs (15.57%) was higher than the average performance of Passive Mid Cap ETFs (12.59%).
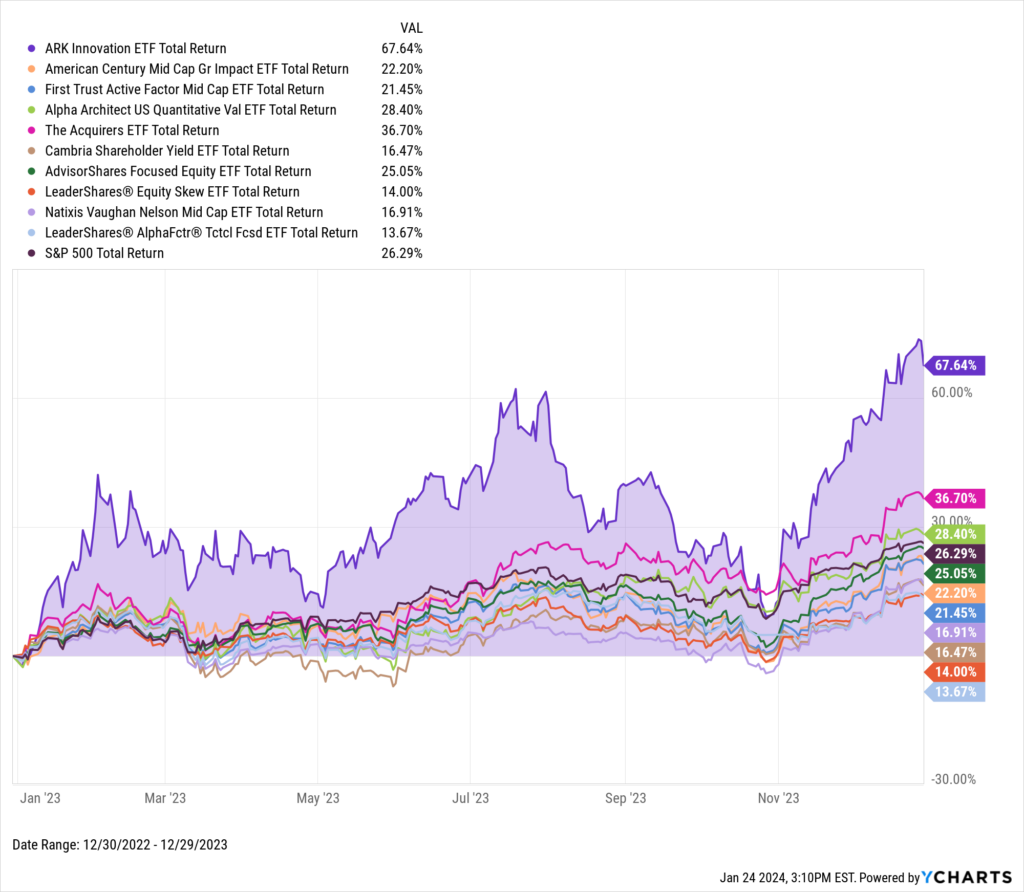
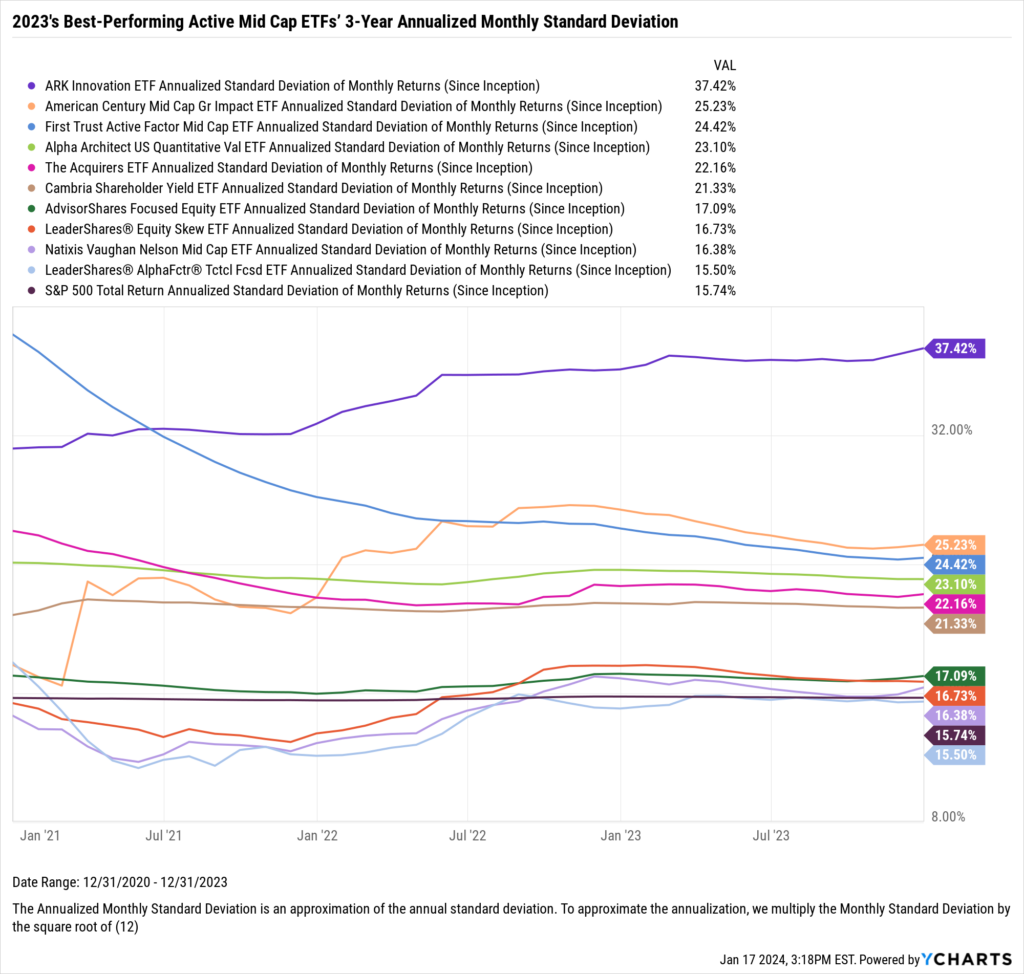
We analyzed the 3-year annualized monthly standard deviations of the top 23 performing active mid-cap ETFs from last year to better understand the potential volatility involved in incorporating these ETFs into a client’s portfolio. Of those 23 funds, only 10 had inception dates before January 1, 2021. Among these, the ARK Innovation ETF (ARKK) delivered a category-leading 67.64% return in 2023:
Download Visual | Modify in YCharts
Since 2021, ARKK has also exhibited the highest volatility among the active mid-cap ETFs charted above, with a 37.42% annualized monthly standard deviation.
In contrast, LeaderShares® AlphaFactor® Tactical Focused ETF (LSAT) – which posted a 13.67% total return in 2023 – demonstrated a lower standard deviation than the S&P 500 over the same period.
Download Visual | Modify in YCharts
Understanding the standard deviation of active mid-cap ETFs (and other ETFs) and their risk-return profiles enables you to craft strategic investment choices that align with your client’s goals.
Whenever you’re ready, there are three ways YCharts can help you:
Interested in doing further ETF research with YCharts?
Email us at hello@ycharts.com or call (866) 965-7552. You’ll get a response from one of our Chicago-based team members.
Want to test out YCharts for free?
Start a no-risk 7-Day Free Trial.
Download The Best Performing ETFs of 2023 for more comparative ETF analysis:
Disclaimer
©2024 YCharts, Inc. All Rights Reserved. YCharts, Inc. (“YCharts”) is not registered with the U.S. Securities and Exchange Commission (or with the securities regulatory authority or body of any state or any other jurisdiction) as an investment adviser, broker-dealer or in any other capacity, and does not purport to provide investment advice or make investment recommendations. This report has been generated through application of the analytical tools and data provided through ycharts.com and is intended solely to assist you or your investment or other adviser(s) in conducting investment research. You should not construe this report as an offer to buy or sell, as a solicitation of an offer to buy or sell, or as a recommendation to buy, sell, hold or trade, any security or other financial instrument. For further information regarding your use of this report, please go to: ycharts.com/about/disclosure
Next Article
A Closer Look at 2023 Fund FlowsRead More →